HESSD
12, 12039–12087, 2015Model-based study of the role of rainfall in the changes in Niger
Red floods
C. Casse et al.
Title Page
Abstract Introduction
Conclusions References
Tables Figures
◭ ◮
◭ ◮
Back Close
Full Screen / Esc
Printer-friendly Version
Interactive Discussion
Discussion
P
a
per
|
Discussion
P
a
per
|
Discussion
P
a
per
|
Discussion
P
a
per
|
Hydrol. Earth Syst. Sci. Discuss., 12, 12039–12087, 2015 www.hydrol-earth-syst-sci-discuss.net/12/12039/2015/ doi:10.5194/hessd-12-12039-2015
© Author(s) 2015. CC Attribution 3.0 License.
This discussion paper is/has been under review for the journal Hydrology and Earth System Sciences (HESS). Please refer to the corresponding final paper in HESS if available.
Model-based study of the role of rainfall
and land use land cover in the changes in
Niger Red floods occurrence and intensity
in Niamey between 1953 and 2012
C. Casse1, M. Gosset1, T. Vischel2, G. Quantin2, and B. A. Tanimoun3
1
Géoscience Environnement Toulouse, CNRS – UMR5563, IRD, Université Toulouse III, Observatoire Midi-Pyrénées, Toulouse, France
2
Laboratoire des Transferts en Hydrologie et Environnement, CNRS – UMR5564, IRD, Université Grenoble I, Grenoble, France
3
Autorité du Bassin du Niger (ABN), Niamey, Niger
Received: 2 October 2015 – Accepted: 26 October 2015 – Published: 18 November 2015 Correspondence to: C. Casse (claire.casse@get.obs-mip.fr)
and M. Gosset (marielle.gosset@ird.fr)
HESSD
12, 12039–12087, 2015Model-based study of the role of rainfall in the changes in Niger
Red floods
C. Casse et al.
Title Page
Abstract Introduction
Conclusions References
Tables Figures
◭ ◮
◭ ◮
Back Close
Full Screen / Esc
Printer-friendly Version
Interactive Discussion
Discussion
P
a
per
|
Discussion
P
a
per
|
Discussion
P
a
per
|
Discussion
P
a
per
Abstract
Since 1950, the Niger River basin went through 3 main climatic periods: a wet period (1950–1960), an extended drought (1970–1980) and since 1990 a partial recovery of the rainfall. Hydrological changes co-occur with these rainfall fluctuations. In most of the basin the rainfall deficit caused an enhanced discharge deficit, but in the Sahelian
5
region the runoff increased despite the rainfall deficit. Since 2000, the Sahelian part of the Niger has been hit by an increase of flood hazards during the so-called Red flood period. In Niamey city, the highest river levels and the longest flooded period ever recorded occurred in 2003, 2010, 2012 and 2013, with heavy casualties and property damage. The reasons for these changes, and the relative role of climate vs. Land Use
10
Land Cover (LULC) changes are still debated and are investigated in this paper. The evolution of the Niger Red flood in Niamey from 1950 to 2012 is analysed based on long term records of rainfall (three data sets based on in situ and/or satellite data) and discharge, and a hydrological model. The model is first run with present LULC condi-tions in order to analyse solely the effect of rainfall variability. The impact of LULC and
15
drainage area modification is investigated in a second step. The simulations based on the current surface conditions are able to reproduce the observed trend in Red flood oc-currence and intensity since the 1980s. This has been verified with three independent rainfall data sets and implies that rainfall variability is the main driver for the Red flood intensification observed over the last 30 years. The simulation results since 1953
re-20
veals that LULC and drainage area changes need to be invoked to explain the changes over a 60 year period.
1 Introduction
The Sahel region has overcome drastic changes over the last 60 years. The long drought that occurred in the 1970s and 1980s (Lamb, 1982; Le Barbé and Lebel,
25
HESSD
12, 12039–12087, 2015Model-based study of the role of rainfall in the changes in Niger
Red floods
C. Casse et al.
Title Page
Abstract Introduction
Conclusions References
Tables Figures
◭ ◮
◭ ◮
Back Close
Full Screen / Esc
Printer-friendly Version
Interactive Discussion
Discussion
P
a
per
|
Discussion
P
a
per
|
Discussion
P
a
per
|
Discussion
P
a
per
|
et al., 2002; Dai et al., 2004; Lebel and Ali, 2009; Panthou et al., 2014) is considered as one of the strongest climatic signal of the 20th century (L’Hôte et al., 2002; Dai et al., 2004; Narisma et al., 2007). In addition to dramatic consequences on the pop-ulation, this drought induced long term changes on the eco- and hydrosystems. Since the 1990s the region has come back to wetter conditions even though the annual
rain-5
fall is not back to the levels reached in the 1950s or 1960s. This recent partial recovery is heterogenic over the Sahel, with dry conditions persisting in the westernmost part (Nicholson et al., 2000; L’Hôte et al., 2002; Dia et al., 2004; Lebel and Ali, 2009; Pan-thou et al., 2014). In the Central-East Sahel the rainfall deficit is dropping over the last decade, interannual variability is strong (Dai et al., 2004) and rainfall appears more
10
intense (more extreme events) than in the 1950s and 1960s (Panthou et al., 2014). Concurrent with these climatic variations West Africa has experienced major hy-drological changes. The Niger is the largest river of West Africa and goes through a strong climatic gradient from the humid Guinean region to the sub-desertic Sahara and through the semi-arid Sahel. The hydrological response to the extended drought
15
of the 1970s–1980s has been different in the various sub-regions of the Niger basin. In the Guinean region the discharge deficit was twice as important as the rainfall deficit (Briquet et al., 1996; Mahé et al., 2000; Mahé 2009; Paturel et al., 2010). After the 1970s–1980s the discharge deficit of the Bani (the main tributary of upper Niger River) compared to the 1950s reached 80 % (Mahé et al., 2000). During the same dry years
20
the phenomenon kown as “Sahelian paradox” (Descroix et al., 2009) was observed in many part of the Sahel: an increase in runoff despite the deficit in rainfall (Albergel, 1987; Amani and Nguetora, 2002; Mahé et al., 2003, 2005, 2009). This phenomenon resulted in a discharge increase in exoreic1basins (Amani and Nguetora, 2002; Mahé et al., 2003, 2005, 2009; Descroix et al., 2009; Amogu et al., 2010) and in larger
25
pond surfaces, infiltration and water table levels in the endorheic2 areas (Desconnet et al., 1997; Leduc et al., 2001; Favreau et al., 2009; Gardelle et al., 2010).
1
Where the hydrographic network does connect to a river and or to the ocean.
2
HESSD
12, 12039–12087, 2015Model-based study of the role of rainfall in the changes in Niger
Red floods
C. Casse et al.
Title Page
Abstract Introduction
Conclusions References
Tables Figures
◭ ◮
◭ ◮
Back Close
Full Screen / Esc
Printer-friendly Version
Interactive Discussion
Discussion
P
a
per
|
Discussion
P
a
per
|
Discussion
P
a
per
|
Discussion
P
a
per
The discharge of the Niger River in Niamey, the capital city of Niger, is impacted by the hydrological behaviour of both the upper Niger basin and of the Sahelian tributaries. The rainfall in the upper Niger triggers the “Guinean flood”, which propagates slowly and occurs in Niamey after the rainy season (around January) (Millot, 1913; Pardé, 1933; Descroix et al., 2012; Sighomnou et al., 2013). The rainfall drained by the
Sa-5
helian tributaries in the vicinity of Niamey, superimposes on the Niger River flows and triggers the“Red flood”; “red” refers to the colour of the water loaded in iron oxide sed-iment during this period (Millot, 1913; Pardé, 1933; Descroix et al., 2012; Sighomnou et al., 2013). Before the rainfall deficit of the 1970s–1980s the hydrograph in Niamey was single peaked; the Red flood was lower and almost merged with the Guinean 10
flood. Gradually after the 1970s–1980s, the runoffincreased in the Sahelian tributaries enhancing their contribution to theRed flood. Consequently the hydrograph in Niamey evolved from a “one peak” to a “two peak” shape (Amani and Nguetora, 2002; Mahé et al., 2003; Amogu et al., 2010; Sighomnou et al., 2013). Descroix et al. (2012) poeti-cally described this phenomenon as “the dromedary became a camel”. The increasing
15
intensity of theRed floodin the last decade has enhanced the inundation risk, caus-ing dramatic human and material losses. In, 2003, 2010, 2012 and 2013 water levels and duration of the inundation were the highest ever recorded since the beginning of observations in 1920 (Sighomnou et al., 2013).
The reasons for this dramatic increase in the flood risk in Niamey are still
de-20
bated by the scientific community. Previous studies (Amani and Nguetora, 2002; Mahé et al., 2003; Amogu et al., 2010; Descroix et al., 2013) have invoqued the increase of the runoffcoefficient in three main tributaries of the Niger before Niamey (the Gor-ouol, Dargol and Sirba rivers) since the 1970s. Several authors (Seguis et al., 2004; Leblanc et al., 2008; Descroix et al., 2009, 2012) attributed these hydrological changes
25
harvest-HESSD
12, 12039–12087, 2015Model-based study of the role of rainfall in the changes in Niger
Red floods
C. Casse et al.
Title Page
Abstract Introduction
Conclusions References
Tables Figures
◭ ◮
◭ ◮
Back Close
Full Screen / Esc
Printer-friendly Version
Interactive Discussion
Discussion
P
a
per
|
Discussion
P
a
per
|
Discussion
P
a
per
|
Discussion
P
a
per
|
ing (Peltier et al., 1995; Leblanc et al., 2008) or crop extension (Valentin et al., 2004). Recently small scale changes in the hydrographical network in the vicinity of Niamey have been invoqued as a possible driver for Red flood increase (Amogu et al., 2010; Descroix et al., 2012; Mamadou et al., 2015). In some parts of the Niger left bank, which used not to contribute to the river (endoreism), heavy runoffhas increased the
5
network connection (Leblanc et al., 2008; Amogu et al., 2010) and opened new wa-ter channels to the main river. The role of a changing rainfall regime in the flood risk increase is also an open question (Nka et al., 2015). Recent studies suggest that rain-fall has intensified in the Central Sahel (Panthou et al., 2014). In a region where the runoffis very dependent on high rainfall intensities (Vischel and Lebel, 2007; Casse
10
et al., 2015) a strong hydrological response to rainfall extremes is expected.
The interactions and co-occurrence of the LULC, water pathway and rainfall changes over the past decades, makes it difficult to attribute the flood risk increase on the basis of observations alone. Unlike the intricate reality, models allow testing the influences of each process or variable independently. Model based studies have described the
15
role of LULC on runoffin West Africa (Mahé et al., 2005; Li et al., 2007). Many authors used hydrological modelling (based on different scale, basin, data set and model) to infer the role of climate and LULC on hydrological changes in West Africa since 1950 (1950–1998: Seguis et al., 2004; 1951–2000: D’Orgeval and Polcher, 2008; 1950– 2009: Aich et al., 2015). The conclusions differ among these studies: D’Orgeval and
20
Polcher (2008) found that LULC was less important than rainfall changes, in contrast to Seguis et al. (2004), while Aich et al. (2015) concluded on the role of both LULC and cli-mate. None of these studies include the most recent period and the record Red floods of 2010 and 2012. Casse and Gosset (2015) presented a preliminary work based on a satellite rainfall product (PERSIANN-CDR) between 1983 and 2012. They showed
25
that rainfall variability alone could explain the observed changes in the Niger river hy-drograph in Niamey over the last 30 years.
HESSD
12, 12039–12087, 2015Model-based study of the role of rainfall in the changes in Niger
Red floods
C. Casse et al.
Title Page
Abstract Introduction
Conclusions References
Tables Figures
◭ ◮
◭ ◮
Back Close
Full Screen / Esc
Printer-friendly Version
Interactive Discussion
Discussion
P
a
per
|
Discussion
P
a
per
|
Discussion
P
a
per
|
Discussion
P
a
per
It investigates the sensitivity of the hydrological response to rainfall variability, and also to LULC and drainage area changes. Casse and Gosset (2015) highlighted the role of rainfall over the last 3 decades. The present work investigates if similar conclusions can be drawn when a longer period, that includes the 1950s–1960s wet conditions and the 1970s–1980s droughts, is considered. The model is first run with present LULC
condi-5
tions in order to analyse solely the effect of rainfall variability. The impact of LULC and drainage area modification is investigated in a second step. The numerical experiment is first carried out over the 1983–2012 period where 3 different and independent rainfall products are available. This is to verify that previous conclusions on the hydrological im-pact of rainfall changes over the last 30 years are robust and independent of the rainfall
10
data set. The changes since 1950 are then analysed using the only data set available for the extended period (based on rain gauges). Section 2 describes the study area, the data and the hydrological model set up. Section 3 presents the observed changes in rainfall and discharge over 1950–2012. Section 4 analyses the hydrological model outputs, compares the simulated and observed changes over the six decades, and
15
discusses the sensitivity to LULC and drainage area changes. Section 5 gives the con-clusions about the role of rainfall variability and other drivers of change in the increase of theRed floodevents since the 1950s.
2 Data and method
2.1 Study area and hydrological context
20
This study focuses on the area where the runoffresponsible for the Red flood is pro-duced. This area is situated in the middle Niger basin, in the Sahelian belt, between Ansongo (15◦40′N, 0◦30′E, Mali) and Niamey (13◦31′N, 2◦6′E, Niger) as contoured in red in Fig. 1 (top left panel). The right bank of the Ansongo–Niamey reach collects 3 main tributaries (Fig. 1, bottom left pannel): the Gorouol (in Alcongui), the Dargol
25
HESSD
12, 12039–12087, 2015Model-based study of the role of rainfall in the changes in Niger
Red floods
C. Casse et al.
Title Page
Abstract Introduction
Conclusions References
Tables Figures
◭ ◮
◭ ◮
Back Close
Full Screen / Esc
Printer-friendly Version
Interactive Discussion
Discussion
P
a
per
|
Discussion
P
a
per
|
Discussion
P
a
per
|
Discussion
P
a
per
|
since the inner delta. The Gorouol, Dargol and Sirba are ephemeral rivers, named ko-ris, which flow only during the rainfall season. The left bank of the Niger in the study zone is mainly endorheic. The hydrographical network is organised in connected ponds and the runoffdoes not contribute much to the Niger river. Amogu et al. (2010) and Mamadou et al. (2015) have reported however that in parts of the left bank the
hy-5
drographical network is changing and water channels are created down to the main river bed; the phenomenon is known as “endorheic rupture” and increases the runoff
contribution from the left bank to the Niger main stream.
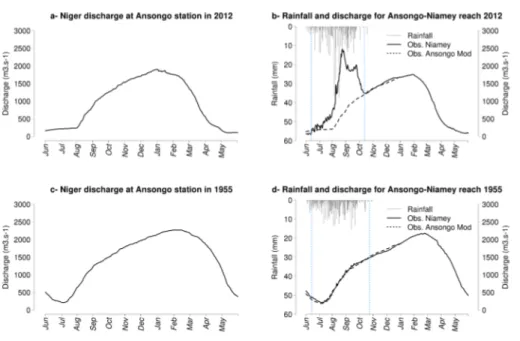
Figure 2 displays the discharge recorded at Ansongo and Niamey gauging stations in 2012 and 1955. 2012 is a good illustration of a strong Red flood event in Niamey.
10
As discussed in the introduction and visible in Fig. 2b, the discharge in Niamey is the superposition of the Guinean flood, arriving from the upper Niger basin (as seen at Ansongo, Fig. 2a) and of the additional runoff generated in the Gorouol, Dargol and Sirba basin between July and October.
2.2 Discharge data
15
Five discharge gauging stations within the studied zone are used to analyse the ob-served changes and also as input/comparison for the model simulations. Ansongo (Mali) at the head of the study zone is needed to analyse the Guinean flood before any influence of the Red flood on the discharge. Ansongo data is also needed as input to the hydrological model (see below). The discharge in Niamey is the main focus of
20
this work, and is the best quality data record of all five. The discharge at the 3 right bank tributaries outlets (Alcongui, Kakassi and Garbey) is used to quantify the locally generated runoff and its variability over the years. All discharge data is provided by the Niger Basin Authority (ABN) data base. The data set covers 60 years from 1953 to 2012 for Ansongo and Niamey (with a significant number of missing data during low
25
HESSD
12, 12039–12087, 2015Model-based study of the role of rainfall in the changes in Niger
Red floods
C. Casse et al.
Title Page
Abstract Introduction
Conclusions References
Tables Figures
◭ ◮
◭ ◮
Back Close
Full Screen / Esc
Printer-friendly Version
Interactive Discussion
Discussion
P
a
per
|
Discussion
P
a
per
|
Discussion
P
a
per
|
Discussion
P
a
per
2.3 Quantifying theRed floodcontribution to Niamey’s discharge
As the study focuses on theRed floodin Niamey, a first challenge is to isolate this flood from theGuinean floodin the Niamey discharge, based on available observations. For recent years, where the two floods are clearly independent (Fig. 2b), an automatic algorithm based on maxima detection can be implemented. For distant years where
5
the two floods were almost merged (Fig. 2d) the task is difficult. A two-step method suitable for both merged and non-merged flood hydrographs is implemented. First, the period where the runoffleading toRed floodoccurs is delimited. Second, theRed flood
contribution is quantified based on comparing Niamey’s and Ansongo’s discharge. For each year theRed floodperiod is delimited based on the observed rainy season,
10
as illustrated with the vertical lines in Fig. 2b and d. The longest rainfall record, available for the whole 1953–2012 period is used (see Sect. 2.4 below). The starting date of the
Red floodperiod is set as the day when 10 % of the annual rainfall amount is reached. The end date is set to the day when 98 % of the annual rainfall is reached plus a 10 day margin. The margin accounts for the time needed for runoffover the entire drainage
15
area to reach Niamey.
Once theRed floodperiod is delimited, the next step is to quantify the proportion of Niamey’s discharge attributable to runoffin the Ansongo–Niamey sub-basin, from what is propagating from the upper basin. Two methods have been used. The first method assumes that the main runoffcontribution between Ansongo and Niamey comes from
20
the 3 right bank tributaries. With this assumption the sum of the 3 discharges can be used as a proxy. This method however occults the contribution of direct rainfall over the river bed or runofffrom the left bank. Also the station records are not available on the entire studied period. The second method is based on subtracting the Ansongo’s discharge to the Niamey’s discharge. Note that during theGuinean flood (Fig. 2a and
25
HESSD
12, 12039–12087, 2015Model-based study of the role of rainfall in the changes in Niger
Red floods
C. Casse et al.
Title Page
Abstract Introduction
Conclusions References
Tables Figures
◭ ◮
◭ ◮
Back Close
Full Screen / Esc
Printer-friendly Version
Interactive Discussion
Discussion
P
a
per
|
Discussion
P
a
per
|
Discussion
P
a
per
|
Discussion
P
a
per
|
dry koris after the rainy season. This loss must be accounted for before substracting Ansongo’s to Niamey’s discharge. To do so Ansongo’s discharge is morphed to fit the shape of theGuinean floodas observed in Niamey. This is illustrated by the difference between the dash line in Fig. 2b (resp. 2d) and the plain line in Fig. 2a (resp. 2c). Then the local contribution is estimated as the area between Niamey’s discharge (black line
5
in Fig. 2b) and Ansongo’s morphed discharge (dash line), between the beginning and end of the red flood period (vertical blue lines in Fig. 2b).
Whatever the method used, the estimation of local runoffproduction is prone to un-certainty. In method one (sum of 3 tributaries discharge) the errors may come from the quality of the data record and ignoring rainfall over the river bed and the left bank. In
10
method two, most of the error comes from the quality of the data record in Ansongo and also from the difficulty to quantify the losses in the discharge between Ansongo and Niamey. In any case, the objective here is not an accurate quantification of the runoffevery year but rather the analysis of the main trends and relative changes over 60 years.
15
2.4 Rainfall data record
Rainfall data is used in Sect. 3 to analyse the observed changes in the climatic and hydrological signals. It is also needed as forcing for the hydrological model.
Rainfall over the Niger basin is associated with the West African Monsoon and falls mainly between June and October. In the studied area, like in overall Sahel, 90 %
20
of rainfall comes from propagating Meso-scale Convective Systems (MCS) (Laurent et al., 1998; Mathon et al., 2002; Lebel et al., 2003). Although MCS patterns vary, they often organize in a curved convective line followed by a stratiform region (Houze, 1993). The resulting rain fields are characterized by strong space–time variability, with intense rain rates when the convective front is passing through (typically during less
25
forc-HESSD
12, 12039–12087, 2015Model-based study of the role of rainfall in the changes in Niger
Red floods
C. Casse et al.
Title Page
Abstract Introduction
Conclusions References
Tables Figures
◭ ◮
◭ ◮
Back Close
Full Screen / Esc
Printer-friendly Version
Interactive Discussion
Discussion
P
a
per
|
Discussion
P
a
per
|
Discussion
P
a
per
|
Discussion
P
a
per
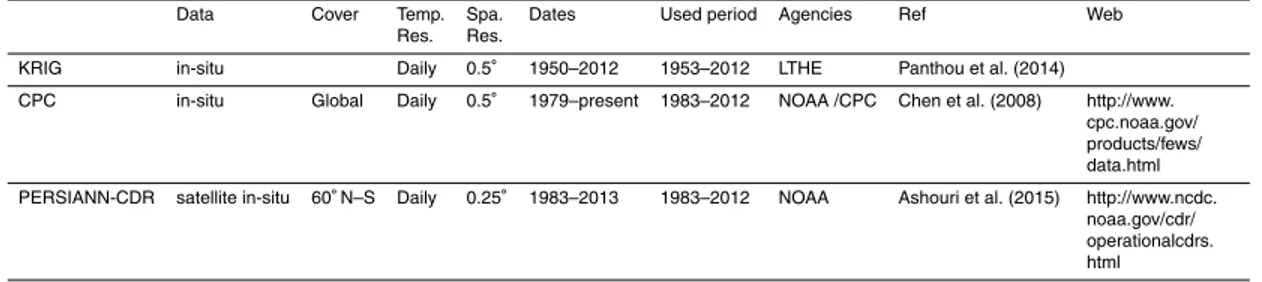
ing models because the hydrological response depends not only on the accumulations but also on the distribution of rainfall in time, space, and intensity classes (Gosset et al., 2013; Casse et al., 2015). Three rainfall data records have been used in this work (Table 1). All three are spatialized rainfall products, provided on a regular grid and well suited for forcing a distributed hydrological model. Two of the products are
5
based on rain gauge information and one on satellite information. The three products are described below. Their assessment against a dense network of gauges situated in Niamey is presented in the Appendix.
2.4.1 “KRIG”: a research product based on a rich set of operational gauges (available since 1950)
10
This regional product provided by the Laboratoire des Transfert en Hydrologie et Envi-ronnement (LTHE), hereafter named KRIG product, is a gauge based rainfall estimate. This product is based on a data base first built by Le Barbé et al. (2002) and updated by Panthou et al. (2014). KRIG product is based on rain gauge records from different institutes: the Centre Inter-Etats d’Etudes Hydraulique (CIEH), the AGRometeorology,
15
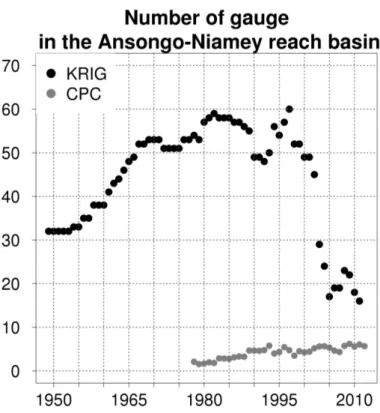
Hydrology, METerology centre (AGRYMET) and the National Weather services from several African countries (DMN in French). The available network density is variable during the period and inside the basin. Over the studied area and after quality control, the available number of stations ranges from 60 to 15 gauges between 1950 and 2012, and since 2006 the network is sparser, with less than 30 gauges (Fig. 3). As in Vischel
20
et al. (2011), the kriging technique is used to interpolate the daily gauge information and provide a regularly gridded product with a 0.5◦
×0.5◦resolution.
2.4.2 “CPC”: an operational gauge product (available since 1979)
The National Oceanic and Atmospheric Administration (NOAA) Climate Prediction Centre (CPC) provides the CPC Unified Gauge-Based Analysis of Global Daily
Pre-25
HESSD
12, 12039–12087, 2015Model-based study of the role of rainfall in the changes in Niger
Red floods
C. Casse et al.
Title Page
Abstract Introduction
Conclusions References
Tables Figures
◭ ◮
◭ ◮
Back Close
Full Screen / Esc
Printer-friendly Version
Interactive Discussion
Discussion
P
a
per
|
Discussion
P
a
per
|
Discussion
P
a
per
|
Discussion
P
a
per
|
CPC_UNI_PRCP/GAUGE_GLB/ (both data and documentation). This daily–0.5◦
prod-uct, available from 1979 to present, is based on the Gandin (1965) optimal interpolation which according to Chen et al. (2008) provides a robust global precipitation estimate in different condition of climate, season and network density. On the contiguous United States a correlation of 0.5 was found between the referenced network (30 km
station-5
to-station distance) and a synthetic sparse network which mimics tropical Africa situa-tion (400 km stasitua-tion-to-stasitua-tion distance) (Chen et al., 2008). On the Ansongo–Niamey reach basin, the annual mean number of gauges has been increasing over the period and ranges from 1.5 (1980) to 6.2 (2010) (Fig. 3). This density is very low compared to the density provided by the KRIG product above. Casse et al. (2015) however showed
10
that a hydrological model forced with CPC gave satisfactory results over the area for the 2000–2013 period, where the annual mean number of gauges is around 5.2 (±0.66).
2.4.3 “PERSIANN-CDR” a satellite based product (available since 1983)
Based on the PERSIANN algorithm (Sorooshian et al., 2000) a new Climate Data Record called PERSIANN-CDR (Ashouri et al., 2015) with a daily–0.25◦ resolution
15
is currently available from 1983 to present (www.ncdc.noaa.gov/cdr/operationalcdrs. html). PERSIANN-CDR is based on high temporal resolution infrared information from geostationary satellite (GridSat-B1, from the International Satellite Cloud Climatologi-cal Project, ISCCP) and a bias correction based on the Global Precipitation Climatology Project (GPCP) monthly rainfall estimates (Ashouri et al., 2015).
20
2.5 Hydrological model and set up
The hydrological simulation is based on the ISBA-TRIP model, already used in Casse et al. (2015) and Casse and Gosset (2015) to study the Ansongo–Niamey reach of the Niger basin. Casse et al. (2015) tested the model over the 2000–2013 period with a variety of rainfall products. They showed that ISBA-TRIP was able to reproduce the
25
HESSD
12, 12039–12087, 2015Model-based study of the role of rainfall in the changes in Niger
Red floods
C. Casse et al.
Title Page
Abstract Introduction
Conclusions References
Tables Figures
◭ ◮
◭ ◮
Back Close
Full Screen / Esc
Printer-friendly Version
Interactive Discussion
Discussion
P
a
per
|
Discussion
P
a
per
|
Discussion
P
a
per
|
Discussion
P
a
per
model and the rainfall product PERSIANN-CDR to study the 1983–2012 period, also with satisfactory results.
2.5.1 The ISBA-TRIP coupled model
Within the SURFEX modelling platform (developed by Météo France and standing for SURFace Externalisée in French; www.cnrm.meteo.fr/surfex/, Masson et al., 2013),
5
a Land Surface Model (LSM) is coupled to a routing model. ISBA-TRIP is a distributed model based on an explicit representation of the physical processes.
The LSM, called ISBA (Interaction between Soil Biosphere and Atmosphere) com-putes the water (and energy) balance based on the soil/vegetation properties of each grid cell and the atmospheric forcing provided at each time step. Several options are
10
available within ISBA to produce runoff; here the production is based on a parameteri-zation of sub-grid hydrology.
ISBA output feeds the routing model called TRIP (Total RunoffIntegrating Pathway) which turns surface runoff, ground water and floodplain water contributions into dis-charge for each grid cell, and then propagates the surface flows through the river
net-15
work. TRIP reservoirs implemented in the version 6 of SURFEX (used in this study) are: the river, the ground water, the flood plain, and the aquifer. Within these reservoirs, evaporation and infiltration occurs only in flood plains. Distributed parameters (based on physical equation or on fixed values) control the river hydrology: length, slope, width, depth, Manning coefficient of the river, Manning coefficient of flood plain, partitioning
20
coefficient between groundwater and aquifer, return time of groundwater and aquifer to the river.
For more precision on the ISBA-TRIP model physics please refer to Noilhan and Planton (1989, first developers), Boone et al. (1999, for the soil layers physics), Decharme and Douville (2005 and 2007, for the subgrid hydrology), Decharme et.al
25
HESSD
12, 12039–12087, 2015Model-based study of the role of rainfall in the changes in Niger
Red floods
C. Casse et al.
Title Page
Abstract Introduction
Conclusions References
Tables Figures
◭ ◮
◭ ◮
Back Close
Full Screen / Esc
Printer-friendly Version
Interactive Discussion
Discussion
P
a
per
|
Discussion
P
a
per
|
Discussion
P
a
per
|
Discussion
P
a
per
|
The model is implemented on the Ansongo–Niamey reach basin (Fig. 4) with a grid resolution of 0.5◦×0.5◦ and a 3 h time step for the atmospheric forcing. This config-uration is described in details in Casse et al. (2015) and Casse and Gosset (2015). The value of the daily discharge at the head of the reach (Ansongo pixel) is needed as input. The observed discharge data at the Ansongo station provided by the ABN is
5
used for this purpose.
2.5.2 Atmospheric forcing
ISBA needs a classical atmospheric forcing (precipitation, temperature, pressure, hu-midity, radiance and wind) to compute the water balance for each grid cell. Here the atmospheric forcing, except for rainfall, is provided as a climatological mean value
10
for each day. The daily value was computed from the 2003–2012 period based on the WATCH Forcing Data methodology applied to ERA-Interim data (WFDEI, Weedon et al., 2011), reanalysed by Météo France (B. Decharme, personal communication, 2013). Sensitivity tests have been run to verify the sensitivity of the model output to the atmospheric forcing. The tests showed that using a climatological mean does not
15
impact the simulated discharge during the high flow and does not change the charac-teristic of the simulated Red flood. The focus here being on the Red flood simulation, the sensitivity to rainfall is the dominant factor in the atmospheric forcing.
The rain forcing is provided by the three rainfall data sets described in Sect. 2.4, PERSIANN-CDR, CPC and KRIG. Since the model is not calibrated for each product,
20
the differences between the 3 simulations are due to differences between the rain prod-ucts (Appendix). Using 3 independent rainfall dataset will consolidate the conclusions concerning the role of rainfall changes on hydrology.
2.5.3 Vegetation map
The parameters needed for ISBA to compute energy and water balance, are based
25
HESSD
12, 12039–12087, 2015Model-based study of the role of rainfall in the changes in Niger
Red floods
C. Casse et al.
Title Page
Abstract Introduction
Conclusions References
Tables Figures
◭ ◮
◭ ◮
Back Close
Full Screen / Esc
Printer-friendly Version
Interactive Discussion
Discussion
P
a
per
|
Discussion
P
a
per
|
Discussion
P
a
per
|
Discussion
P
a
per
map (vegetation type and fraction, Fig. 4) is based on the Ecoclimap data (Masson et al. (2003), which cover the 2002–2006 period) and the soil texture (sand, silt propor-tion) is based on FAO data. These data sets are considered as representative of the current situation in the area. The bare sol proportion on the basin ranges from 20 to 100 % and follows the rainfall latitudinal gradient with less vegetation in the north than
5
in the south. Within ISBA, the vegetation cover of the Ansongo–Niamey reach basin is composed mainly of Sahelian savannah and bush Sahelian savannah, which present low coverage (LAI<2 and at least 20 % of bare soil). Contrary to landscape description found in the literature (Amogu et al., 2010; Descroix et al., 2012), Ecoclimap data does not consider any croplands in the study area. However sensitivity studies (not shown)
10
have shown that the model is sensitive to the vegetation cover fraction (LAI and pro-portion of bare soil) rather than to the vegetation type (crop vs. no crop). Thus LULC changes impact on hydrology is explored by changing the vegetation cover fraction.
The simulations over the whole 1953–2012 period are first run with the current soil/vegetation characteristics, with the objective to analyse only the impact of
rain-15
fall regime changes. In a second step the vegetation cover fraction is changed to be more representative of the beginning of the period, with less area covered by bare soil and more wood.
3 Observed rainfall and hydrological changes since 1950s
This section summarizes the hydrological and climatic changes observed over the
20
study area since the 1950s. The variability of the discharge in Niamey is analysed in the light of the variability of its two components: (i) the Guinean flow arriving through Ansongo and (ii) the runoffgenerated over the Ansongo–Niamey sub-basin. The anal-ysis is based on the inter-annual series of the normalized rainfall index and similar indexes computed from the discharge data. The normalized rainfall index, for a series
25
HESSD
12, 12039–12087, 2015Model-based study of the role of rainfall in the changes in Niger
Red floods
C. Casse et al.
Title Page
Abstract Introduction
Conclusions References
Tables Figures
◭ ◮
◭ ◮
Back Close
Full Screen / Esc
Printer-friendly Version
Interactive Discussion
Discussion
P
a
per
|
Discussion
P
a
per
|
Discussion
P
a
per
|
Discussion
P
a
per
|
Ii =Ri−R¯
σR (1)
where ¯R and σR are the mean and the standard deviation of the Ri series. Similar indexes have been computed from the discharges data during the Red flood period based on the following yearly mean variables:
– the mean discharge in Ansongo (in m3s−1);
5
– the mean discharge in Niamey (in m3s−1);
– the mean differential discharge computed as the difference between the Niamey and the morphed Ansongo discharges;
– the mean of the sum of the discharges from the 3 tributaries (Dargol, Sirba and Gorouol).
10
As discussed in Sect. 2.3 the two last variables are proxies to the local runoff contri-bution to Niger discharge. All the variables above are calculated during the Red flood period. This period is calculated each year based on the rainfall time series as detailed in Sect. 2.3.
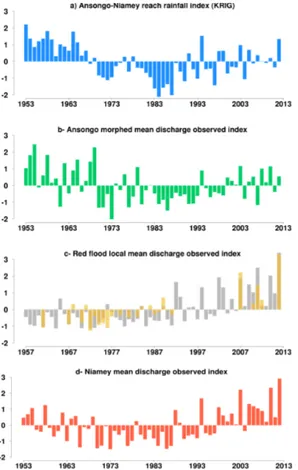
Figure 5 illustrates the rainfall and hydrological changes in the Ansongo–Niamey
15
reach basin through 6 decades, from 1953 to 2012.
The rainfall index (or anomaly) (Fig. 5a) is based on the KRIG rainfall estimates (the only product available over the entire period). The 1950s and 1960s are the wettest decades of the studied period (all years present a positive index), followed by two decades with rainfall deficit in the 1970s and 1980s (starting in 1968). Since the 1990s
20
HESSD
12, 12039–12087, 2015Model-based study of the role of rainfall in the changes in Niger
Red floods
C. Casse et al.
Title Page
Abstract Introduction
Conclusions References
Tables Figures
◭ ◮
◭ ◮
Back Close
Full Screen / Esc
Printer-friendly Version
Interactive Discussion
Discussion
P
a
per
|
Discussion
P
a
per
|
Discussion
P
a
per
|
Discussion
P
a
per
(Lamb, 1982; Le Barbé and Lebel, 1997; Nicholson et al., 2000; Camberlin et al., 2002; Le Barbé et al., 2002; L’Hôte et al., 2002; Dai et al., 2004; Lebel and Ali, 2009; Panthou et al., 2014). Both wet and dry decades were observed and the heterogenous rainfall recovery highlighted by several authors (Nicholson et al., 2000; L’Hôte et al., 2002; Dia et al., 2004; Lebel and Ali, 2009; Panthou et al., 2014) is confirmed over the studied
5
area.
Figure 5b–d illustrate the inter-annual variability of respectively, the mean discharge in Niamey during the Red flood period (Fig. 5d), and its two contributors: the Guinean flow as recorded in Ansongo (Fig. 5b) and the local runoff (Fig. 5c). In Fig. 5c the two proxies used to quantify local runoffcontribution to the discharge (Sect. 2.3) are
10
displayed. The grey shade is for the index computed from the differential discharge between Ansongo and Niamey; the yellow colour is for the index based on the sums of the tributaries. The gaps in the latter series are due to missing data.
As expected, the trends in the Ansongo discharge variability are consistent with what is known of rainfall variability in West Africa and Sahel over the last 60 years: the wet
15
decades of the 1950s and 1960s are associated with the highest discharge index, the long period with negative index during the 1970s and 1980s highlights the decrease in discharge during the drought in the upper Niger basin. From the 1990s the discharge index have increased again but are still lower than in the 1950s–1960s wet conditions and shows an enhanced inter-annual variability.
20
In contrast with the relatively similar trends displayed by rainfall (Fig. 5a) and the Ansongo discharge (Fig. 5b) the index for the local runoffcontribution (Fig. 5c) shows a very different evolution over the 6 decades. The salient feature is an increase over the period with mostly negative values until the mid 1980s and increasing positive values afterwards. Given the many sources of uncertainty in deriving the two proxies
25
para-HESSD
12, 12039–12087, 2015Model-based study of the role of rainfall in the changes in Niger
Red floods
C. Casse et al.
Title Page
Abstract Introduction
Conclusions References
Tables Figures
◭ ◮
◭ ◮
Back Close
Full Screen / Esc
Printer-friendly Version
Interactive Discussion
Discussion
P
a
per
|
Discussion
P
a
per
|
Discussion
P
a
per
|
Discussion
P
a
per
|
doxical behaviour of Sahelian basins described by several authors (Albergel, 1987; Amani and Nguetora, 2002; Mahé et al., 2003, 2005; Mahé and Paturel, 2009; De-scroix et al., 2009, 2012; Sighomnou et al., 2013). Previous studies have attributed the changes in runoffcoefficient to the effect of LULC changes (Seguis et al., 2004; Leblanc et al., 2008; Descroix et al., 2009, 2012). The reason for the sharp increase
5
in runoffsince the 1990s and the possible role of rainfall intensification is debated in the community. Analysis at the yearly scale, as presented above does not allow to conclude. The model based simulations in the next section shine some light on these questions.
As expected, Niamey Red flood (Fig. 5d) changes over 1953–2012 reflect the
influ-10
ence of the flow coming from the upper basin (Fig. 5b) and local contributions (Fig. 5c). In the 1950s and 1960s when the upper flow is high but local runoffis small, the mean discharge index is average, with a succession of positive and negative years. During the 1970s and 1980s drought it reaches the lowest values. In the recent period when the index for the upper basin flow is average but local runoffis increasing sharply, the
15
Red flood levels increase drastically and reach their highest values.
4 Model based analysis, sensitivity tests and attribution of the changes
This section presents the modelling results and their ability to reproduce the hydro-logical changes discussed in the previous section. First for the entire simulated period (1953–2012) the soil/vegetation parameters in ISBA-TRIP are held constant from year
20
to year and the only source of variability in the hydrological response is the discharge in Ansongo and the rainfall forcing. The drainage area and vegetation maps are those of Fig. 4, and are representative of present conditions. If this simulation is able to re-produce the observed changes, then rainfall variability can be considered the main driver for the hydrological changes. If not, other sources of change in the
hydrologi-25
pe-HESSD
12, 12039–12087, 2015Model-based study of the role of rainfall in the changes in Niger
Red floods
C. Casse et al.
Title Page
Abstract Introduction
Conclusions References
Tables Figures
◭ ◮
◭ ◮
Back Close
Full Screen / Esc
Printer-friendly Version
Interactive Discussion
Discussion
P
a
per
|
Discussion
P
a
per
|
Discussion
P
a
per
|
Discussion
P
a
per
riod when the sharpest increase in the runoffhas been observed (Fig. 5c) and record Red floods occurred. This is also the period when the Niger’s hydrograph has gradually transformed into a two peak shape. Can the simulation reproduce these changes? Can they be explained by the rainfall “recovery” from the 1990s? The simulations since 1953 are then presented to verify if the paradoxical behaviour illustrated by Fig. 5a and d (wet
5
years and average Red flood in the 1950–1960 period, average rainfall and extreme floods in the 1990–2012 period) can be reproduced. The sensitivity to the vegetation cover and to the drainage area is explored.
4.1 1983–2012 period
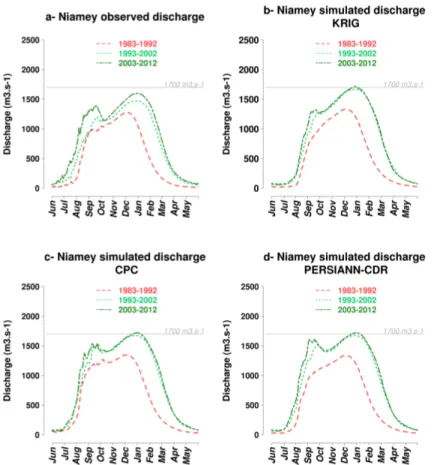
4.1.1 Mean decadal hydrograph
10
The mean decadal hydrograph is a good synthetic indicator of the salient changes in the hydrological regime between the decades. The observed and simulated decadal hydrograph for the last 3 decades (1983–1992, 1993–2002 and 2003–2012) are pre-sented in Fig. 6. According to Fig. 6a the observed discharge has globally increased through the 3 decades, both in term of flood length and intensity. The increase in the
15
Guinean flood (November to May) is consistent with the increase in the Ansongo dis-charge already discussed (Fig. 5b). The progressive apparition of the Red flood, clearly separating from the Guinean flood in the last decade (2003–2012) is visible in Fig. 6a. The decadal mean of the total water volume during the Red flood (integration of Ni-amey discharge during the Red flood), raised from 5.1 to 8.9 km3during the 3 observed
20
decades (Table 2). The enhancement of the Red flood due to the combined effect of an increase in the upper basin flow (Fig. 5b) and local runoff(Fig. 5c) is visible on the decadal hydrographs.
The simulated decadal mean hydrographs, based on the 3 rainfall forcing – KRIG, CPC and PERSIANN-CDR – are able to reproduce the main features of the observed
25
HESSD
12, 12039–12087, 2015Model-based study of the role of rainfall in the changes in Niger
Red floods
C. Casse et al.
Title Page
Abstract Introduction
Conclusions References
Tables Figures
◭ ◮
◭ ◮
Back Close
Full Screen / Esc
Printer-friendly Version
Interactive Discussion
Discussion
P
a
per
|
Discussion
P
a
per
|
Discussion
P
a
per
|
Discussion
P
a
per
|
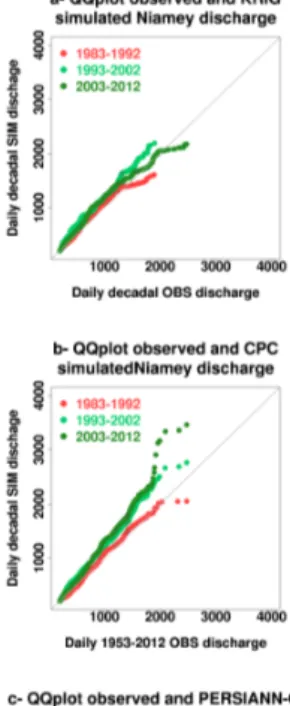
4.1.2 Quantile-quantile analysis
The frequency distribution of the daily discharge during the Red flood, for each decade are analysed. The simulated and observed distributions are compared in two ways: (i) first the observations and simulations are compared decade by decade (Fig. 7), in order to verify the ability of the model to reproduce realistic distributions of the daily
5
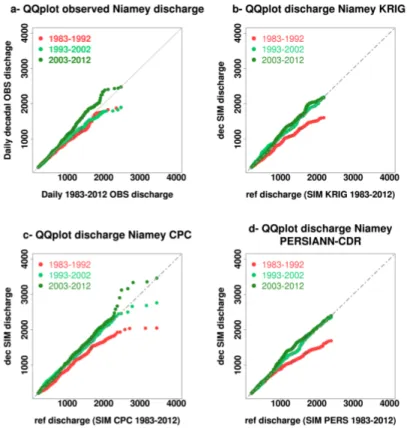
discharge, (ii) then the relative changes in the distributions, between decades, are analysed both for observations (Fig. 8a) and for simulations (Fig. 8b–d).
The distribution comparison between simulated and observed daily Red flood dis-charge (Fig. 7) for the 3 decades, highlights that the simulations tend to overestimate the observed discharge. This is true for CPC and PERSIANN-CDR for the 3 decades.
10
The KRIG based simulations tend to underestimate the highest discharge values. This is confirmed in Table 2 with the values of the mean decadal volume of the Red flood. This systematic overestimation is mainly due to the observed deficit between Ansongo and Niamey (Sect. 2.2), which is not simulated by the current modelling. The diff er-ences among the 3 simulations are due to differences in rainfall distribution among the
15
3 rain products (Appendix).
Despite the overall positive bias, the simulations reproduce the observed relative changes between the driest (1983–1992) and the most recent decade (2003–2012) (Fig. 8): an overall increase of the discharge. For the 1993–2002 decade, simulations are too close to the 2003–2012 distribution while in the observations the 1993–2012
20
distribution is closer to the driest decade 1983–1993. Because of missing data in the Ansongo discharge data during the 1990s, part of the series was reconstructed by interpolation. As the Ansongo data is used as an input to the hydrological model (Sect. 2.4), these errors in the discharge may explain some of the discrepancies in the 1993–2002 simulations.
25
HESSD
12, 12039–12087, 2015Model-based study of the role of rainfall in the changes in Niger
Red floods
C. Casse et al.
Title Page
Abstract Introduction
Conclusions References
Tables Figures
◭ ◮
◭ ◮
Back Close
Full Screen / Esc
Printer-friendly Version
Interactive Discussion
Discussion
P
a
per
|
Discussion
P
a
per
|
Discussion
P
a
per
|
Discussion
P
a
per
well simulated. Interannual rainfall variability can thus be considered as the main driver for the hydrological changes during 1983–2012 period, as already found in Casse and Gosset (2015). Here, the use of 3 different rainfall products, based on independent data sets, methods, and with different characteristics over the domain (Appendix), reinforce the previous results.
5
4.2 1953–2012 period
Over the 1953–2012 period, the observed mean decadal hydrograph (Fig. 9a) varies according to the 3 climatic periods observed in Fig. 5a: (i) the highest discharge and longest high water level season are observed during the wettest decades (1953–1962 and 1963–1972), (ii) discharge decreases during the first dry decade (1973–1982) and
10
reaches its lower level during the driest decade (1983–1992), (iii) before rising up over the two last decades (1993–2002 and 2003–2012), but without reaching the 1950s– 1960s levels. From 1953 to 1982, the decadal hydrograph is unimodal. A few individual years present a bi-modal shape (1964, Fig. 12), but these are too few to influence the decadal mean. In any case the Red flood level never exceeds the Guinean flood
15
in these early decades. The last decade (2003–2012) bi-modal hydrograph shape re-flects the increase in intensity and frequency of the annual bi-modal regime and the occurrence of the Red flood overpassing the Guinean flood (2012, Fig. 2b). Based on the total water volume of the Red flood two major periods appear, consistent with the annual mean Niamey Red flood discharge index (Fig. 5d): (i) 1953 to 1993
char-20
acterised by a decrease of the decadal mean volume during the rainy season (from 7.3 km3 in 1953–1962 to 5.1 km3 in 1983–1992) and (ii) 1993 to 2012 characterised by a steady increase towards the highest values of the whole period (from 7 km3 in 1993–2002 decade to 8.9 km3in 2003–2012). As previously highlighted in Fig. 5d, the recent Red flood (since the 1990s) is higher than during the wettest decades.
25
HESSD
12, 12039–12087, 2015Model-based study of the role of rainfall in the changes in Niger
Red floods
C. Casse et al.
Title Page
Abstract Introduction
Conclusions References
Tables Figures
◭ ◮
◭ ◮
Back Close
Full Screen / Esc
Printer-friendly Version
Interactive Discussion
Discussion
P
a
per
|
Discussion
P
a
per
|
Discussion
P
a
per
|
Discussion
P
a
per
|
compared to the observations. In Fig. 11a for observations, the 1983–1992 discharge exceeds 1973–1982 discharge, while it is the opposite for the simulations (Fig. 11b).
The most striking feature in Figs. 9–11 is the overestimation of the discharge for the wettest and early decades 1953–1962 and 1963–1972, where the simulations produce too much runoff. For these wet decades, the discharge overestimation leads to an
5
increase of the Red flood and a reinforcement of the bi-modal shape of the decadal hydrograph (Fig. 9b), contrary to observations. The high rain rates over the area during the wet decades leads to enhanced runoffand high discharge during the Red flood, whereas in the observations the Red flood values are low during these decades. The Red flood decadal mean volume values confirm the strong over estimation for the early
10
decades (Table 2).
The present surface conditions (low vegetation cover and high proportion of bare soil) and drainage area, lead to high runoff and local contribution. With these condi-tions simulacondi-tions agree with the observed trends in Red flood occurrence and inten-sity between the 1970s–1980s decades and the present period. For earlier decades
15
(1950s and 1960s) the Red flood is highly overestimated; changes other than the rain-fall regime need to be investigated to understand this runoffexcess and reduce it in the simulations.
4.3 Sensitivity to LULC and drainage area changes
Several authors have reported that the LULC and the drainage network have changed
20
in the study area since the 20th century (Leblanc et al., 2008; Amogu et al., 2010; Ma-madou et al., 2015). In this section we investigate the sensitivity of the simulated Red flood discharge to the vegetation cover and to the drainage area to assess their po-tential role in the observed hydrological changes in Niamey. The year 1964 illustrates well the overestimation of Red flood during the wet decades. Figure 12a presents the
25
Ni-HESSD
12, 12039–12087, 2015Model-based study of the role of rainfall in the changes in Niger
Red floods
C. Casse et al.
Title Page
Abstract Introduction
Conclusions References
Tables Figures
◭ ◮
◭ ◮
Back Close
Full Screen / Esc
Printer-friendly Version
Interactive Discussion
Discussion
P
a
per
|
Discussion
P
a
per
|
Discussion
P
a
per
|
Discussion
P
a
per
amey which is not reproduced by the model. But during the Red flood the positive bias in the simulated discharge in Niamey clearly exceeds this deficit. The model response to the highest rainfall rates is too strong, leading to an overestimation of the peak by 1000 m3s−1. Figure 12 displays the observed discharge in Niamey and the simulated discharge with 3 different model configurations: (i) standard set up with present
con-5
dition (SC), (ii) maximum vegetalized condition (VC) with wooded Sahelian savannah covering the entire Ansongo–Niamey reach basin, and (iii) maximum vegetalized con-dition with a reduce drainage area (VCRD) without the left bank and the northern part of the Gorouol tributary. VC simulation reduces the mean Red flood discharge by about 16 %, and VCRD by about 20.2 %, which is an improvement compared to the reference
10
simulation but the discharge is still overestimated. The same behaviour is found for the overall 1953–1962 and 1963–1972 decades (Fig. 13). Changing the LULC and drainage area improves the daily distribution of the discharge and its relative position compared to the 1983–2012 period. However, unlike for observations (Fig. 11a) the Red floods simulated in the 1950s–1960s are still exceeding the Red floods of recent
15
decades (Fig. 13c).
Some of the remaining positive bias in the VCRD simulation is due to the limits of the ISBA-TRIP model, which is not able to reproduce the loss between Ansongo and Niamey. The coarse resolution of the model and its simple representation of the vege-tation cover and the drainage systems are also limivege-tations. Crops or specific Sahelian
20
ecosystems (as in tiger bush, Seghieri et al., 1994; Galle et al., 1999) are not rep-resented explicitely in the present configuration. The complex hydrological behaviour of the temporary tributaries (koris) and their evolution within the season, when heavy rainfall may create new water path-ways is not reproduced with a global model as ISBA-TRIP. More work will be done in the future to improve the model realism.
HESSD
12, 12039–12087, 2015Model-based study of the role of rainfall in the changes in Niger
Red floods
C. Casse et al.
Title Page
Abstract Introduction
Conclusions References
Tables Figures
◭ ◮
◭ ◮
Back Close
Full Screen / Esc
Printer-friendly Version
Interactive Discussion
Discussion
P
a
per
|
Discussion
P
a
per
|
Discussion
P
a
per
|
Discussion
P
a
per
|
5 Conclusions
This paper analyses hydrological changes in the Sahel region since the 1950s with a focus on the middle Niger river in the vicinity of Niamey where floods have increased drastically. The study focuses on the Ansongo–Niamey reach basin where the Red flood, that caused many damages in the last decade, is generated. The rainfall over
5
the studied area has followed the general trend that Sahel has overcome between 1953 and 2012: a wet period during 1950s and 1960s, a long drought during 1970s and 1980s, and a recent partial recovery of annual rainfall. The intensity of the Red flood in Niamey is influenced by the upper Niger flow arriving in Ansongo and by “local” runoffproduced in the sub-basin between Ansongo and Niamey. Changes in the Red
10
flood signal over the last 60 years are explained by the changes in both components which have been analysed based on standard indexes. The upper Niger contribution has followed the climatic trend. The corresponding index is positive during the 1950s– 1960s negative during the droughts of the 1970s–1980s, and varies around 0 since the 1990s. The local runoffcontribution has been continuously increasing over the 1953–
15
2012 period, which is paradoxical given the rainfall signal. This double influence results in a progressive increase of the Red flood since the 1980s, and paradoxically the Red flood has been higher in the last decade than in the wettest decades of the series.
This study provides a better understanding of the roles of rainfall and surface condi-tions (LULC and drainage area) in these observed changes, thanks to hydrological
sim-20
ulations. The simulations based on the current surface conditions are able to reproduce the observed trend in Red flood occurrence and intensity since the 1980s. This has been verified with three independent rainfall data sets, which provide similar monthly rainfall accumulations over the domain but with marked differences at smaller scales. This result implies that rainfall inter annual variability is the main driver for the changes
25
HESSD
12, 12039–12087, 2015Model-based study of the role of rainfall in the changes in Niger
Red floods
C. Casse et al.
Title Page
Abstract Introduction
Conclusions References
Tables Figures
◭ ◮
◭ ◮
Back Close
Full Screen / Esc
Printer-friendly Version
Interactive Discussion
Discussion
P
a
per
|
Discussion
P
a
per
|
Discussion
P
a
per
|
Discussion
P
a
per
The simulation based on current surface conditions reproduces the main hydrological changes since the 1970s, but overestimates the discharge during the 1950s and 1960s. Increasing the vegetation cover and reducing the drainage area decreases the runoff
production in the model and simulates discharges closer to the observations 1950s and 1960s. This result implies that changes in the environmental conditions are responsible
5
for the change in hydrological behaviour between the 1950s–1960s decades and the 1970s to present period. The scenario which emerges from these results is the follow-ing: in 1950s and 1960s surface conditions, with more woody area and less crop and bare soil than in the present days, limited the runoffand thus the local contribution to the Red flood despite the high rainfall amounts. Changes in surface conditions (because of
10
climatic variations and anthropic pressure) during 1970s and 1980s have increased the runoffcoefficient as already suggested by many authors (Amani and Nguetora, 2002; Mahé et al., 2003; Amogu et al., 2010; Descroix et al., 2013; Aich et al., 2015). This led to an increased local contribution to the Red flood in spite of the rainfall deficit. This new surface conditions result in an enhanced sensitivity of the hydrological response
15
to rainfall variability, because runoffhas increased and surface water propagates rela-tively fast on bare or poorly vegetated soils. Accordingly, since the 1990s, the rainfall “recovery” is enhancing the local runoffproduction and conducts to a dramatic increase of the Red flood. The Red flood is also well separated in time from the Guinean flood, exceeds it, and has reached the highest level ever recorded. Climate variability with its
20
consequences on the rainfall regime, and LULC changes have both played a role, in turn, in the recent flood risk increase in Niamey. Whether climate/rainfall variability or LULC is the dominant factor depends on the period considered.
More work could be done to analyse the exact timing of the changes. The model used here is relatively coarse in resolution, the physics is simplified and does not
rep-25
(in-HESSD
12, 12039–12087, 2015Model-based study of the role of rainfall in the changes in Niger
Red floods
C. Casse et al.
Title Page
Abstract Introduction
Conclusions References
Tables Figures
◭ ◮
◭ ◮
Back Close
Full Screen / Esc
Printer-friendly Version
Interactive Discussion
Discussion
P
a
per
|
Discussion
P
a
per
|
Discussion
P
a
per
|
Discussion
P
a
per
|
crease in the frequency or intensity of extreme events, changes in the dry/wet spells, etc.)? High-resolution rainfall products, models and LULC changes maps are needed to investigate these questions at the relevant scales. Effort should also be done to bet-ter understand the drainage area changes and integrate a more realistic representation of the temporary rivers (Koris) and of the endoreic areas, in the hydrological modelling.
5
Appendix: Rainfall products analysis
The three long term rainfall data set used in the present study have been evaluated against a dense network of gauges. The network is one of the 3 instrumented site of the AMMA-CATCH observatory system (African Monsoon Multidisciplinary Analysis – CATCH standing for Couplage de l’Atmosphère Tropicale et du Cycle Hydrologique in
10
French, Lebel et al., 2010). It is located in the region of Niamey. The site covers an area of 1◦×1◦(centred at 2.5◦E and 13.5◦N) and monitors the rainfall since 1990 with a dense gauge network (between 40 and 50 gauges). This high resolution network was already used as a reference to compare and validate satellite rainfall products (Roca et al., 2010; Gosset et al., 2013; Kirstetter et al., 2012) The rain gauges produce
15
5 min punctual rainfall series which are interpolated to a 0.25◦−3 h grid by Langrangian kriging (Vischel et al., 2011). This ground reference is refered to as “KRIG DENSE” hereafter.
Figure A1 compares the 3 rainfall estimates and the ground reference KRIG DENSE. The comparison is carried out on four pixels of 0.5◦ at a daily time step between 1990
20
and 2012 for the rainiest months (June, July, August and September). The interannual series of rainfall accumulation is satisfactory for all 3 products, but KRIG is closer to the reference (r2=0.85) than PERSIANN-CDR (r2=0.7) and CPC (r2=0.68). KRIG and PERSIANN-CDR tend to smooth the rainfall fields in time, with a low daily conditional mean rainfall (Fig. A1b) and a lot of rainy days (Fig. A1c). Both KRIG and
PERSIANN-25
HESSD
12, 12039–12087, 2015Model-based study of the role of rainfall in the changes in Niger
Red floods
C. Casse et al.
Title Page
Abstract Introduction
Conclusions References
Tables Figures
◭ ◮
◭ ◮
Back Close
Full Screen / Esc
Printer-friendly Version
Interactive Discussion
Discussion
P
a
per
|
Discussion
P
a
per
|
Discussion
P
a
per
|
Discussion
P
a
per
to the reduce number of gauges in the network). CPC follows the tendency observed with the reference but has the greatest interannual variability and tends to underesti-mate the rainfall events extension. As highlighted in several studies (Roca et al., 2010; Gosset et al., 2013; Casse et al., 2015), rainfall products with similar annual rainfall accumulation, may exhibit large differences in the spatial, temporal and intensity
dis-5
tribution of rainfall. These difference may impact the hydrological simulations (Casse et al., 2015).
Acknowledgements. We warmly thank the Niger Basin Authority (ABN), for providing the Niger River discharge data and for their collaboration. We would like also to thank all the teams that provided the various rainfall data sets online. We also are grateful to L. Gal for her precious
10
help and advice for the maps. This work has been co-funded by the French Centre National d’Etudes spatiales (CNES) and the Midi-Pyrénées region. It was also partly supported by the French national programme EC2CO-LEFE “Evolution récente de l’aléa hydro-climatique au Sahel: détection et éléments d’attribution”.
References
15
Aich, V., Liersch, S., Vetter, T., Andersson, J., Müller, E., and Hattermann, F.: Climate or land use? – Attribution of changes in river flooding in the Sahel Zone, Water, 7, 2796–2820, doi:10.3390/w7062796, 2015.
Albergel, J.: Sécheresse, désertification et ressources en eau de surface – application aux petits bassins du Burkina Faso, in: The Influence of Climate Change and Climatic Variability
20
on the Hydrologic Regime and Water Resources, vol. 168, IAHS PUBLICATION, Vancouver, 355–365, 1987.
Amani, A. and Nguetora, M.: Evidence d’une modification du régime hydrologique du fleuve Niger à Niamey, in: 4th FRIEND 2002 – Regional Hydrology?: Bridging the Gap between Research and Practice, vol. 274, IAHS PUBLICATION, Cape Town, South Africa, 449–456,
25
2002.
HESSD
12, 12039–12087, 2015Model-based study of the role of rainfall in the changes in Niger
Red floods
C. Casse et al.
Title Page
Abstract Introduction
Conclusions References
Tables Figures
◭ ◮
◭ ◮
Back Close
Full Screen / Esc
Printer-friendly Version
Interactive Discussion
Discussion
P
a
per
|
Discussion
P
a
per
|
Discussion
P
a
per
|
Discussion
P
a
per
|
Ashouri, H., Hsu, K.-L., Sorooshian, S., Braithwaite, D. K., Knapp, K. R., Cecil, L. D., Nel-son, B. R., and Prat, O. P.: PERSIANN-CDR: daily precipitation climate data record from multisatellite observations for hydrological and climate studies, B. Am. Meteorol. Soc., 96, 69–83, doi:10.1175/BAMS-D-13-00068.1, 2015.
Boone, A., Calvet, J.-C., and Noilhan, J.: Inclusion of a third soil layer in a land surface scheme
5
using the force-restore method, J. Appl. Meteorol., 38, 1611–1630, 1999.
Briquet, J. P., Mahé, G., Bamba, F., and Olivry, J. C.: Changements climatiques recents et mod-ification du regime hydrologique du fleuve Niger Koulikoro (Mali), in: L’hydrologie Tropicale?: Géoscience et Outil pour le Développement, vol. 238, IAHS Publication, Paris, 157–166, 1996.
10
Camberlin, P., Beltrando, G., Fontaine, B., and Richard, Y.: Pluviométrie et crises climatiques en Afrique Tropicale: changements durables ou fluctuations interannuelles?, Histoire et Géo-graphes, 379, 263–273, 2002.
Casenave, A. and Valentin, C.: A runoffcapability classification system based on surface fea-tures criteria in semi-arid areas of West Africa, J. Hydrol., 130, 231–249, 1992.
15
Casse, C. and Gosset, M.: Analysis of hydrological changes and flood increase in Niamey based on the PERSIANN-CDR satellite rainfall estimate and hydrological simulations over the 1983–2013 period, Proceedings of the International Association of Hydrological Sci-ences, 370, 117–123, doi:10.5194/piahs-370-117-2015, 2015.
Casse, C., Gosset, M., Peugeot, C., Pedinotti, V., Boone, A., Tanimoun, B. A., and
20
Decharme, B.: Potential of satellite rainfall products to predict Niger River flood events in Niamey, Atmos. Res., 163, 162–176, doi:10.1016/j.atmosres.2015.01.010, 2015.
Chen, M., Shi, W., Xie, P., Silva, V. B. S., Kousky, V. E., Wayne Higgins, R., and Janowiak, J. E.: Assessing objective techniques for gauge-based analyses of global daily precipitation, J. Geophys. Res., 113, D04110, doi:10.1029/2007JD009132, 2008.
25
Collinet, J. and Valentin, C.: Analyse des Différents Facteurs Intervenant sur l’hydrodynamique Superficielle, Nouvelle Perspectives – Applications Agronomiques, ORSTOM, Centre d’Adiopodoume, Abidjan, Côte d’Ivoire, 1979.
Dai, A., Lamb, P. J., Trenberth, K. E., Hulme, M., Jones, P. D., and Xie, P.: The recent Sahel drought is real, Int. J. Climatol., 24, 1323–1331, doi:10.1002/joc.1083, 2004.
30