Working Memory Encoding in Schizophrenia: An ICA
Based Analysis
Shashwath A. Meda1*, Michael C. Stevens1, Bradley S. Folley1,5, Vince D. Calhoun1,2,3,4, Godfrey D. Pearlson1,2,3
1Olin Neuropsychiatry Research Center, Institute of Living at Hartford Hospital, Hartford, Connecticut, United States of America,2Department of Psychiatry, Yale University School of Medicine, New Haven, Connecticut, United States of America,3Department of Psychiatry, Johns Hopkins University, Baltimore, Maryland, United States of America,4The MIND Institute, Albuquerque, New Mexico, United States of America,5Vanderbilt University, Kennedy Center and Department of Psychiatry, Nashville, Tennessee, United States of America
Abstract
Background: Numerous neuroimaging studies report abnormal regional brain activity during working memory
performance in schizophrenia, but few have examined brain network integration as determined by ‘‘functional connectivity’’ analyses.
Methodology/Principal Findings: We used independent component analysis (ICA) to identify and characterize
dysfunctional spatiotemporal networks in schizophrenia engaged during the different stages (encoding and recognition) of a Sternberg working memory fMRI paradigm. 37 chronic schizophrenia and 54 healthy age/gender-matched participants performed a modified Sternberg Item Recognition fMRI task. Time series images preprocessed with SPM2 were analyzed using ICA. Schizophrenia patients showed relatively less engagement of several distinct ‘‘normal’’ encoding-related working memory networks compared to controls. These encoding networks comprised 1) left posterior parietal-left dorsal/ ventrolateral prefrontal cortex, cingulate, basal ganglia, 2) right posterior parietal, right dorsolateral prefrontal cortex and 3) default mode network. In addition, the left fronto-parietal network demonstrated a load-dependent functional response during encoding. Network engagement that differed between groups during recognition comprised the posterior cingulate, cuneus and hippocampus/parahippocampus. As expected, working memory task accuracy differed between
groups (p,0.0001) and was associated with degree of network engagement. Functional connectivity within all three
encoding-associated functional networks correlated significantly with task accuracy, which further underscores the relevance of abnormal network integration to well-described schizophrenia working memory impairment. No network was significantly associated with task accuracy during the recognition phase.
Conclusions/Significance: This study extends the results of numerous previous schizophrenia studies that identified
isolated dysfunctional brain regions by providing evidence of disrupted schizophrenia functional connectivity using ICA within widely-distributed neural networks engaged for working memory cognition.
Citation:Meda SA, Stevens MC, Folley BS, Calhoun VD, Pearlson GD (2009) Evidence for Anomalous Network Connectivity during Working Memory Encoding in Schizophrenia: An ICA Based Analysis. PLoS ONE 4(11): e7911. doi:10.1371/journal.pone.0007911
Editor:Michael H. Herzog, Ecole Polytechnique Federale de Lausanne, Switzerland
ReceivedOctober 16, 2009;AcceptedOctober 27, 2009;PublishedNovember 19, 2009
Copyright:ß2009 Meda et al. This is an open-access article distributed under the terms of the Creative Commons Attribution License, which permits unrestricted use, distribution, and reproduction in any medium, provided the original author and source are credited.
Funding:This research was supported by the following NIH grants: MH43775, MH52886 and MH60504 (to GDP) and 1R01EB000840 (to VDC). Funders had no role in study design, data collection and analysis, decision to publish, or preparation of the manuscript.
Competing Interests:The authors have declared that no competing interests exist. * E-mail: [email protected]
Introduction
Working memory refers to the temporary retention of information to solve problems or guide behavior. Neuroimaging studies [1], direct intracellular recordings [2], and lesion studies support neurobiological models that [1,3] emphasize the impor-tance of activity in prefrontal cortex and parietal brain regions [4] within a complex architecture of different anatomical regions associated with temporally distinct phases of working memory (e.g., encoding, rehearsal, and retrieval). Working memory dysfunction in schizophrenia is a prominent neuropsychological deficit and is considered to be a promising endophenotypic marker to better understand the pathology and risk for the disorder
recognition/retrieval often overlap with stimulus encoding [15,17]. This might suggest that despite conceptual differences between encoding and recognition, the same networks/regions that behave abnormally during encoding in schizophrenia probably are also affected during recognition.
Because successful working memory involves the recruitment of multiple task-specific regions to mediate cognitive demands, it is plausible that working memory abnormalities in schizophrenia are associated with improper functional integration between these various task related networks, rather than by failure of a single region [‘‘disconnection hypothesis’’; [18,19]]. Such functional disconnection abnormalities are best demonstrated using specialized analytic approaches such as independent component analysis (ICA) [20] that reveal profiles of integrated neural circuitry instead of simple identification of brain activity seen in conventional fMRI analyses. The patterns of functional integration underlying working memory have become fairly well-characterized in several fMRI functional connectivity studies that found that brain regions identified by conventional fMRI are functionally integrated during working memory performance [7,21,22,23,24]. Gruber et al. [7], using a psychopysiological interaction (PPI) approach, found a neural circuit comprised of ventrolateral prefrontal cortex (i.e., Broca’s Area) and ventral premotor cortex that was engaged during the encoding phase of a verbal working memory task and a posterior parietal-prefrontal network that was recruited during information maintenance. Woodward et al. [23] used a novel constrained-Principal Component Analysis approach to identify how functional networks were differentially engaged by temporally distinct phases of a working memory task. They reported that a bilateral dorsolateral prefrontal (DLPFC)-bilateral superior parietal-anterior cingulate-occipital circuit engaged during encoding was load-dependent (increased condition-specific regression weights with increased loads). In addition, a predominantly left-hemisphere lateralized circuit of prefrontal-posterior -dorsal cingulate regions was engaged during active manipulation of information. Babiloni and colleagues [21] used an EEG coherence analysis to determine working memory network relationships and found increased fronto-parietal connection during short term memory processes compared to baseline condition. Collectively, these studies consistently implicate a functionally integrated circuit consisting of cingulate-dorso/ventro-lateral PFC-posterior parietal-occipital regions to be actively engaged during encoding [7,23,24,25]. Only one study so far examined functional connectivity during working memory recognition/retrieval, which found load-dependent functional integration of an inferior parietal- anterior cingulate-middle occipital – pre-frontal cortex circuit [25].
There have been a handful of functional connectivity studies of schizophrenia [26,27,28], but none have specifically examined working memory. Stephan et al [26] showed that olanzapine improved impaired cerebellar-prefrontal-mediodorsal thalamus connectivity in schizophrenia. Other studies found schizophre-nia-related disconnection among PFC and other regions. For instance, Das et al [27] examined fear processing in schizophrenia and found a reversal of the normal connectivity patterns between the amygdala, anterior cingulate and the dorsal and ventral divisions of the medial prefrontal cortex. Zhou et al [28] found reduced functional connectivity in first-episode schizophrenia between DLPFC-posterior cingulate-parietal lobe-basal ganglia circuit using passive ‘‘resting state’’ data. Another novel feature of our study is the use of ICA, a powerful data-driven technique that utilizes higher order statistics to discover hidden factors underlying sets of random variables and signals to examine working memory abnormalities in schizophrenia. ICA is primarily a blind-source separation methodology and relies minimally on any a priori
temporal information of the task itself [20]. This method is significantly different from a conventional fMRI analyses or seed voxel correlation analyses that rely upon strong assumptions of either spatial or temporal properties of the signal. ICA is a powerful tool to examine functional connectivity as the extracted signals for each component/network are by definition temporally correlated. The signals derived from ICA (component or network maps) represent functionally-integrated neural networks with unique profiles of blood oxygen level dependent (BOLD) response signal change across the fMRI timeseries. Therefore, the term ‘‘network’’ mentioned here refers to specific handfuls brain regions that share a similar timecourse as identified by ICA.
A modified fMRI version of the Sternberg item recognition paradigm [10,29] was used to examine working memory functional connectivity differences between schizophrenia patients and healthy controls and to further characterize specific connectivity abnormalities during the distinct encoding and recognition phases of the experiment. We expected integrated functional networks to comprise the brain regions that we found active in our previous fMRI report using this task [10] – dorso/ ventrolateral PFC, hippocampus, inferior/superior parietal lobule and anterior cingulate. We further hypothesized that we would find abnormal connectivity WM-engaged networks in schizo-phrenic participants, localized particularly to dorso/ventrolateral PFC and parietal regions. A secondary hypothesis was that increasing task difficulty (i.e., number of stimuli to encode) would alter both hemodynamic response amplitude [10,23] and inter-regional functional connectivity in both groups. According to our theory of schizophrenia disconnection, such parametric task-difficulty effects should also reveal additional, specific schizophre-nia related connectivity deficits. We predicted that schizophreschizophre-nia patients would more greatly engage atypical brain regions to mediate higher task loads. A final aim of our study was to identify networks possibly contributing to schizophrenia abnormalities differences during probe recognition, which has been relatively understudied. Specifically, because we used a probe recognition type paradigm which is known to be somewhat easier than tasks with ‘‘free recall’’ demands, we expected that group differences in functional connectivity for the recognition phase of the task would be minimal. However, because such differences could still indicate pathophsyiology important to schizophrenia, we planned analyses to examine abnormality in recognition networks as well.
Methods
Participants
antipsychot-ics (risperidone (5), olanzapine (2), aripiprazde (4), quetiapine (6), clozapine (1), ziprasidone (5)). Three patients were on no antipsy-chotics. Medication information was unavailable for eleven patients who participated in the study. Participants gave written informed consent using procedures approved by the Yale and Harford Hospital institutional review boards.
fMRI Task
Our task was a modified Sternberg Item Recognition Paradigm that required subjects to memorize a list of alphabetic letters (consonants only), maintain them in memory for several seconds, and then recognize whether probe letters were members of this list. During each encoding phase, subjects saw a list of consonants, displayed sequentially for 1.5 sec each with a 1 sec interstimulus interval (ISI). After a 9-sec maintenance period (during which they were asked to silently rehearse the consonant set presented), in the retrieval phase, subjects saw a sequential series of probe letters (onscreen for 2.5 sec with a 500 msec ISI) and were instructed to press one button with their dominant-hand index fingers for letters in the list (targets) and another button with the middle finger of the same hand for other letters (foils). An additional practice condition contained blocks of all possible memory loads. Each task condition lasted approximately 7 min. The task was implemented on standard desktop PCs running custom presentation software (VAPP, http://nilab.psychiatry.ubc.ca/vapp).
Before entering the scanner, all subjects were given complete task instructions and the practice condition. Practice and instructions were repeated if necessary until subjects achieved a high rate of correct responses. In the scanner, stimulus display was achieved with a rear-projection screen and a mirror mounted on the head coil; subjects made their responses with a fiber-optic response box (Photon Control, Burnaby, Canada).
Table 2 details the distribution of memory loads in the various task conditions. The above load size used in this study is optimal to investigate group differences as it aims to prevent floor ceiling effects at easier loads or heavier loads in patients or controls.
Data Acquisition
Functional MR images were collected at the Olin Neuropsy-chiatry Research Center in the Institute of Living/Hartford Hospital, using a Siemens Allegra 3T scanner (Siemens, Erlangen, Germany). A custom head cushion was used for head stabilization. T2*-weighted images were acquired with a gradient-echo planar sequence (TR = 1.86s, TE = 27ms, flip = 70u). The images con-sisted of whole-brain volumes of 36 sequentially acquired 4 mm slices parallel to the anterior commissure-posterior commissure line (voxel size 3.4463.4464 mm with a 1 mm slice gap). Behavioral data were acquired using the visual and audio presentation package (http://nrc-iol.org/vapp/).
Data Analysis
Functional images were preprocessed with SPM2 (http://www.fil. ion.ucl.ac.uk/spm/software/spm2/). The first five images of each time series were removed to avoid T1saturation effects. Data were realigned using the INRIAlign [31] toolbox. Motion parameters were visually inspected to only include data with translation motion less than 3 mm and rotational movement less than 1.5 degree in any direction. Realigned images were then spatially normalized to MNI standardized space using the EPI template image and spatially smoothed with a 12 mm isotropic kernel.
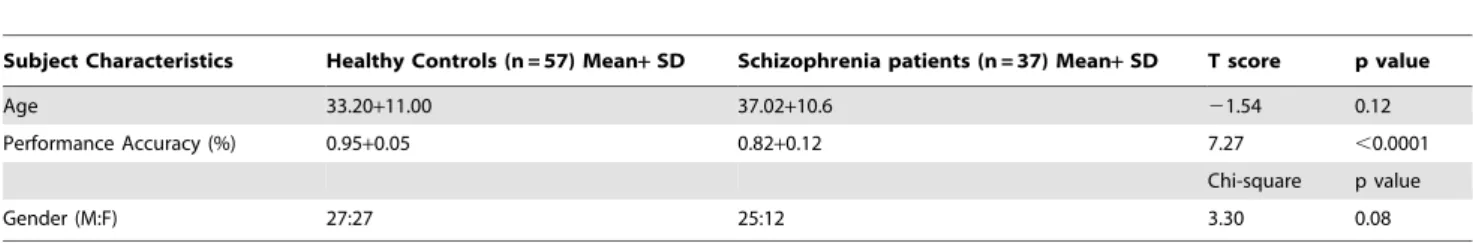
Time series were analyzed using a group ICA algorithm (GIFT v1.3c; http://icatb.sourceforge.com) [20,32] to identify spatially independent and temporally coherent networks. The approach involved a standard method of pooling data from all participants into a single ICA analysis. Following this data reduction was carried out through two principal component analysis (PCA) stages which enables analysis of large data sets [20]. Data from all subjects was used to decompose and estimate twenty one mutually independent components using the Infomax approach [33]. The number of components was determined using the minimum length description (MDL) criteria adjusted to account for correlated samples [34]. This method produces for each component a spatial map (representing which brain regions comprise the network) and a timecourse of the BOLD signal change across the timecourse based on the overall group characteristics. Time courses and spatial maps were then back reconstructed for each participant. This back-reconstruction for each participant produced a series of spatial maps and component timecourses that captured individual differences in the expression of the ICA-derived component. This permitted standard random-effects hypothesis testing of group differences, condition differences, etc. Group analyses of spatial maps determined differences in degree of regional functional connectivity, while analyses of timecourse information allowed us to determine whether or not study groups differentially engaged the network during key phases of the fMRI working memory task. To identify and display the significant network brain regions, individual back-reconstructed subject components (pooled across patients and controls) were examined with random effects analysis (SPM2 one-sample t test) and overlaid on structural images Table 1.Demographic and behavioral characteristics of healthy controls and schizophrenia patients.
Subject Characteristics Healthy Controls (n = 57) Mean+SD Schizophrenia patients (n = 37) Mean+SD T score p value
Age 33.20+11.00 37.02+10.6 21.54 0.12
Performance Accuracy (%) 0.95+0.05 0.82+0.12 7.27 ,0.0001
Chi-square p value
Gender (M:F) 27:27 25:12 3.30 0.08
doi:10.1371/journal.pone.0007911.t001
Table 2.Distribution of working memory loads in task conditions.
Load (Letters in Memory Set)
Total Probes*
Targets per Probe Set
Occurrences of Load per Condition
4 4 2 3
5 4 2 4
6 5 2 or 3 3
*The number of probes was varied across WM loads to achieve rough equality between the number of functional images acquired during the encoding and recognition. This was aimed to gain equal power to detection activation in both epochs with a fairly limited number of trials per subject.
(p,0.05 FWE, corrected for searching the whole brain). To examine network task engagement, component time courses were parameterized using multiple regression to provide association estimates (beta weights) between time courses and the phases of the fMRI paradigm (i.e., encoding vs. recognition). These beta weights represented the degree of synchrony between component time courses and the canonical hemodynamic response model, indicating whether or not the network represented in the component was engaged during that task phase. In addition to calculating beta weight coefficients for the overall encoding condition (collapsed over loads 4, 5 and 6), estimates were also derived for separate loads to investigate the effects of the same on encoding related neural systems. Initially, a one sample t-test was computed on the beta weights (pooled across both controls and schizophrenia from all components to find networks that significantly associated with each condition of the task. Next, t tests and correlation analyses were used to test study hypotheses.
Group differences in regional functional connectivity strength were identified through SPM2 random effects tests on the back-reconstructed spatial component maps. To test study hypotheses regarding differences in strength of regional functional connectiv-ity between groups, a one-way analysis of variance was conducted on the association estimates to test for any significant group differences in the encoding and the recognition phases separately. For reporting purposes, images were converted from MNI to Talairach space using an available set of transformation scripts (http://imaging-mrc-cbu.cam.ac/uk/imaging/MniTalairach).
To test whether networks were differentially engaged during working memory task phases between the study groups, analysis of variance (ANOVA) compared the beta weights (dependent variable) between schizophrenia and controls (independent variable) in SPSS v15 (http://www.spss.com/spss/). To ensure that any group differences in network engagement were not unduly related to task performance issues, the results were confirmed using an analysis of covariance (ANCOVA) model controlling for task accuracy data. The above models tested whether the degree to which any component was engaged, differed between schizophrenia and control participants for either encoding or recognition. The above results were computed with a false discovery rate threshold that corrects for multiple comparisons.
The parametric nature of the Sternberg task also allowed us to interrogate task load dependencies in encoding-related networks for each group to determine the effect of memory load (4, 5, or 6 letters) on network response amplitude. To best depict meaningful group differences, we conducted a series of within-group SPM2 voxelwise correlation analyses separately for control and schizo-phrenia patients that assessed the association between individual back-constructed spatial component maps (representing regional strength of functional connectivity) and beta weights (representing the degree of encoding load-related task association). This analysis identified the subset of brain regions observed in the component spatial map that were more associated with the overall component timecourse when that timecourse more closely matched the canonical model of hemodynamic response expected during encoding at different loads. In other words, this supplemental analysis enabled us to identify and visualize which brain regions became more functionally connected in the presence of greater working memory loads for each group.
Additionally we also performed a 262 repeated measures analysis of variance on the association estimates to test for any significant interactions between condition (encoding, recognition) and diagnosis group.
Working memory task performance for each participant was assessed by computing the average percentage of correct responses
during fMRI scans. A significant group difference in performance accuracy was determined using a two-samplettest. After the analyses described above identified which ICA components significantly discriminated the study groups, supplemental Pearson correlation analyses explored possible relationships between performance accu-racy scores and ICA component beta weights (using the entire range of data across both groups). These latter analyses identified whether network engagement was related to overall task performance.
Results
A systematic process was used to inspect and select the components of interest from the 21 estimated components. First, the association of each component’s spatial map with a priori probabilistic maps of gray matter, white matter, and cerebral spinal fluid within standardized brain space (MNI templates provided in SPM2) helped to identify those components whose patterns of correlated signal change were largely consisted of gray matter versus non-gray matter. Components with high correlation to a priori localized CSF or white matter, or with low correlation to gray matter, suggested that they may be artifactual rather than representing hemodynamic change. As a result, five ICA compo-nents were discarded as representing signal artifacts (due to head motion, eye movement, ventricular pulsations, etc.) and 16 out of the 21 components were examined further.
As initially estimated using a one sample t-test, 13 of 16 components were associated with task activity during the encoding stage and 10 of 16 components correlated with the recognition phase of the task. However, as the main purpose of the paper was to investigate group differences in task associated network activity between controls and schizophrenia subjects, we do not elaborate on all components that were significantly associated with each task phase.
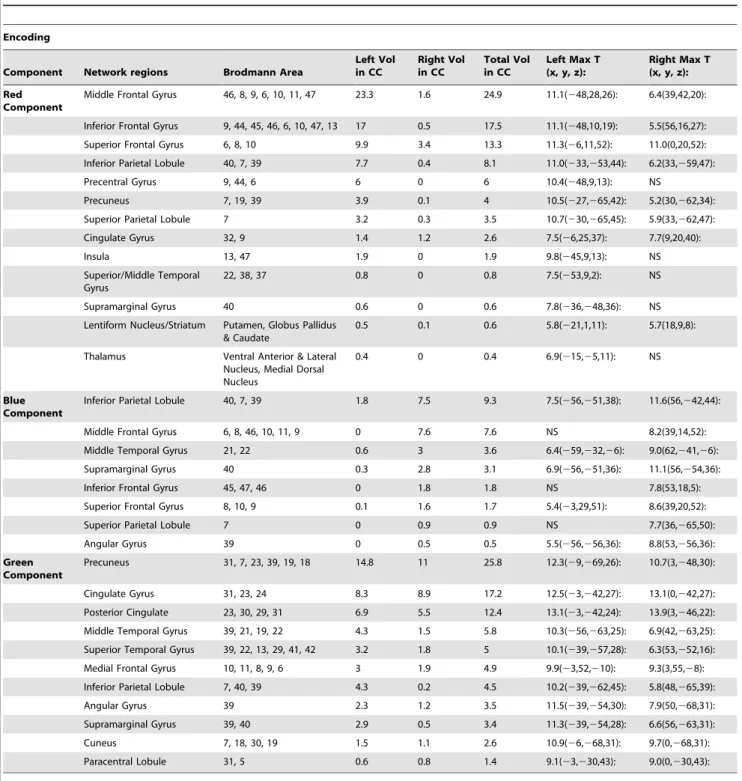
Group Differences in Encoding Network Engagement Out of the above thirteen encoding related networks, ANOVA revealed three circuits to be significantly different between groups during the encoding stage of the experimental task (Figure 1). These included: 1) left dorso/ventro-lateral pre-frontal cortex, left superior/ inferior parietal, cingulate, basal ganglia component (shown in Red; p = 0.004), 2) right dorsolateral PFC, right superior/inferior parietal, right middle temporal network (Blue; p = 0.023) and 3) a component resembling the ‘‘default mode’’ or resting state network that comprised of posterior cingulate, anterior cingulate, medial frontal gyrus, lateral temporal cortex and inferior parietal regions (Green; p = 0.007). When a supplemental ANCOVA examined group differences using task performance accuracy as a covariate, the results were slightly different; but all three of the networks described above remained significantly different between groups. The signifi-cance values were as follows: Red – p = 0.001; Blue – p = 0.05 and Green – p = 0.009. On applying a false discovery rate (FDR) correction for multiple comparisons to the supplemental ANCOVA results, only the red and green networks remained significantly different. Figure 1 shows the associated event-averaged time courses (across controls and schizophrenia) for the Red-, Blue- and Green-labeled networks. Significant regions encompassed by the above networks are listed in Table 3. The time courses of all the above networks were positively correlated with the task regressor represent-ing the encodrepresent-ing phase of the experiment (except the default mode which was negatively correlated).
Group Differences in Regional Functional Connectivity during Encoding
detected primarily in the left middle frontal gyrus (x, y, z:245, 18, 36;t= 2.93), left inferior frontal gyrus (x, y, z:243.3, 34.4,24.8; t= 3.85) and left superior parietal (x, y, z:230,260, 54;t= 3.62). For component 2 (Blue), spatial differences were more subtle and found to be mainly in the right middle temporal gyrus (x, y, z: 63, 227,212;t= 3.98) and inferior parietal lobe (x, y, z: 48,254, 45; t= 2.71). Similarly within component 3 (Green), regions including the anterior cingulate (x, y, z: 3, 54, 3;t= 3.8), medial frontal gyrus (x, y, z: 6, 54, 3;t= 3.69) and precuneus/posterior cingulate (x, y, z:23,251, 30;t= 4.02) predominantly differed between groups. Compared to controls all the above network regions showed less strength of functional connectivity in the schizophrenia group.
Recognition Phase Group Differences
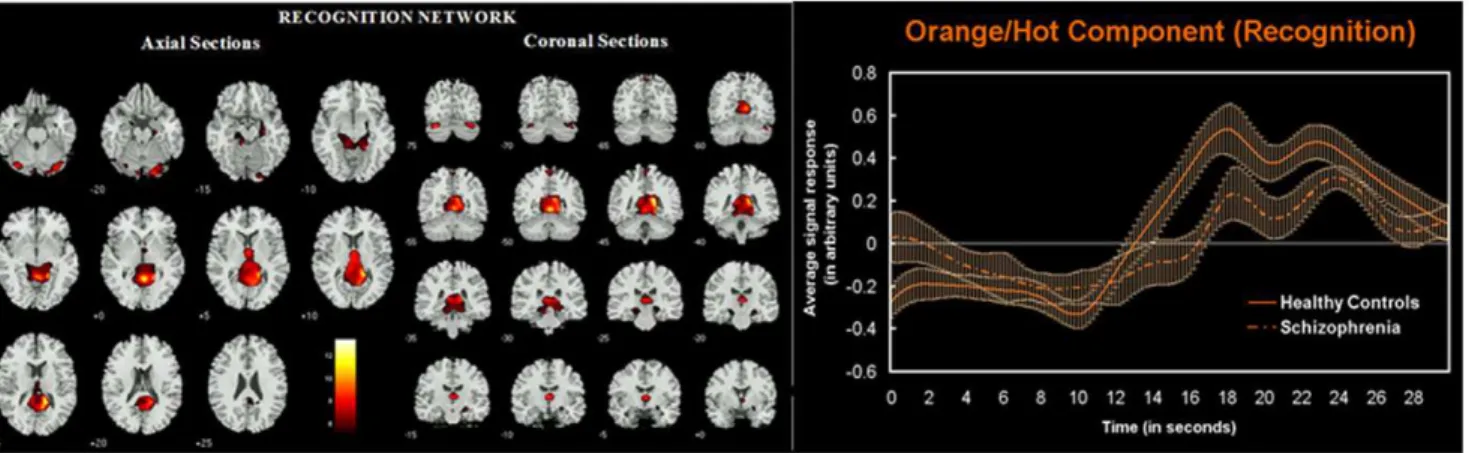
During the recognition phase of the experimental task one network was found to be engaged differently (p = 0.038) by the study groups: 4) posterior cingulate, cuneus, hippocampus/ parahippocampus (shown in orange/hot in figure 2 along with event averaged hemodynamic responses for the two groups).
However, upon accounting for task accuracy in an ANCOVA this network was no longer significant. Description of regions encompassed within this circuit is provided in Table 4. Spatial group differences in regional functional connectivity within the recognition circuit were noted in the left posterior cingulate (x, y, z:23,254, 21;t= 3.08) and bilateral cerebellum (x, y, z:2/+28, 272,225;t= 3.03).
Working Memory Encoding Load Effects
As shown in Table 5, the Red component was the only network that demonstrated significant (p,0.05 corrected or strong trends (p,= 0.07) in group differences across all three loads when examined separately. Hence the results of load effects presented in this paper primarily focus on this network. Figure 3 shows the event averaged time course across each load size (4, 5, 6) for both controls and schizophrenia patients for the fronto-parietal (Red) component 1. Figure 3 (top) shows that both controls and schizophrenic patients demonstrate a non-linear load dependent response of hemodynamic signal change for this neural system Figure 1. Spatial representation of networks that significantly differed between groups during encoding.3D rendering of three distinct component networks that were significantly less engaged in schizophrenia during the encoding phase of the Sternberg working memory paradigm. The red network comprises of a highly left-lateralized network of DLPFC, VLPFC and Inferior/Superior Parietal regions. The blue network is comprised of a right-lateralized network of DLPFC, inferior frontal, inferior-superior parietal and middle temporal regions. The green network represents the ‘‘default mode’’ network representing the precuneus, anterior/posterior cingulate and the medial frontal gyri. All networks shown were derived by thresholding a random effects map (1-sample t-test): at P,0.05 FWE corrected. Accompanying the spatial maps are corresponding event averaged component responses over the encoding phase of the experiment.
when encoding information. The fMRI response for load 4 was the lowest of all three loads, with response increasing and peaking the most with load 5 and dropping down again for load 6. This pattern was observed in both controls and schizophrenia patients. For all three loads, schizophrenia patients demonstrated lesser average amplitude of hemodynamic response than controls. Figure 3 (bottom) depicts SPM2 renderings of brain regions where regional strength of functional connectivity was associated with how strongly each spatial region within this network was engaged by encoding either 4, 5, or 6 stimuli (using the above
described ‘‘third level’’ regression analysis). In general, both groups recruited ventrolateral PFC in addition to DLFPC and posterior parietal for higher cognitive loads. However, schizo-phrenia patients recruited right prefrontal areas more during lower loads than controls. In addition, we observed that the parietal regions were functionally disconnected in schizophrenia patients during lower loads (4 and 5) at the liberal statistical threshold examined (p,0.01 uncorrected). Table 5 shows corresponding mean beta weights for both groups and all 3 encoding and the single recognition network(s) across all loads.
Table 3.Significant regions for the red, blue and green components (in figure 1) that were associated with working memory
encoding along with their Talairach coordinates and suprathreshold volume in cm3.
Encoding
Component Network regions Brodmann Area
Left Vol in CC
Right Vol in CC
Total Vol in CC
Left Max T (x, y, z):
Right Max T (x, y, z):
Red Component
Middle Frontal Gyrus 46, 8, 9, 6, 10, 11, 47 23.3 1.6 24.9 11.1(248,28,26): 6.4(39,42,20):
Inferior Frontal Gyrus 9, 44, 45, 46, 6, 10, 47, 13 17 0.5 17.5 11.1(248,10,19): 5.5(56,16,27): Superior Frontal Gyrus 6, 8, 10 9.9 3.4 13.3 11.3(26,11,52): 11.0(0,20,52): Inferior Parietal Lobule 40, 7, 39 7.7 0.4 8.1 11.0(233,253,44): 6.2(33,259,47):
Precentral Gyrus 9, 44, 6 6 0 6 10.4(248,9,13): NS
Precuneus 7, 19, 39 3.9 0.1 4 10.5(227,265,42): 5.2(30,262,34):
Superior Parietal Lobule 7 3.2 0.3 3.5 10.7(230,265,45): 5.9(33,262,47):
Cingulate Gyrus 32, 9 1.4 1.2 2.6 7.5(26,25,37): 7.7(9,20,40):
Insula 13, 47 1.9 0 1.9 9.8(245,9,13): NS
Superior/Middle Temporal Gyrus
22, 38, 37 0.8 0 0.8 7.5(253,9,2): NS
Supramarginal Gyrus 40 0.6 0 0.6 7.8(236,248,36): NS
Lentiform Nucleus/Striatum Putamen, Globus Pallidus & Caudate
0.5 0.1 0.6 5.8(221,1,11): 5.7(18,9,8):
Thalamus Ventral Anterior & Lateral Nucleus, Medial Dorsal Nucleus
0.4 0 0.4 6.9(215,25,11): NS
Blue Component
Inferior Parietal Lobule 40, 7, 39 1.8 7.5 9.3 7.5(256,251,38): 11.6(56,242,44):
Middle Frontal Gyrus 6, 8, 46, 10, 11, 9 0 7.6 7.6 NS 8.2(39,14,52):
Middle Temporal Gyrus 21, 22 0.6 3 3.6 6.4(259,232,26): 9.0(62,241,26):
Supramarginal Gyrus 40 0.3 2.8 3.1 6.9(256,251,36): 11.1(56,254,36):
Inferior Frontal Gyrus 45, 47, 46 0 1.8 1.8 NS 7.8(53,18,5):
Superior Frontal Gyrus 8, 10, 9 0.1 1.6 1.7 5.4(23,29,51): 8.6(39,20,52):
Superior Parietal Lobule 7 0 0.9 0.9 NS 7.7(36,265,50):
Angular Gyrus 39 0 0.5 0.5 5.5(256,256,36): 8.8(53,256,36):
Green Component
Precuneus 31, 7, 23, 39, 19, 18 14.8 11 25.8 12.3(29,269,26): 10.7(3,248,30):
Cingulate Gyrus 31, 23, 24 8.3 8.9 17.2 12.5(23,242,27): 13.1(0,242,27):
Posterior Cingulate 23, 30, 29, 31 6.9 5.5 12.4 13.1(23,242,24): 13.9(3,246,22): Middle Temporal Gyrus 39, 21, 19, 22 4.3 1.5 5.8 10.3(256,263,25): 6.9(42,263,25): Superior Temporal Gyrus 39, 22, 13, 29, 41, 42 3.2 1.8 5 10.1(239,257,28): 6.3(53,252,16): Medial Frontal Gyrus 10, 11, 8, 9, 6 3 1.9 4.9 9.9(23,52,210): 9.3(3,55,28): Inferior Parietal Lobule 7, 40, 39 4.3 0.2 4.5 10.2(239,262,45): 5.8(48,265,39):
Angular Gyrus 39 2.3 1.2 3.5 11.5(239,254,30): 7.9(50,268,31):
Supramarginal Gyrus 39, 40 2.9 0.5 3.4 11.3(239,254,28): 6.6(56,263,31):
Cuneus 7, 18, 30, 19 1.5 1.1 2.6 10.9(26,268,31): 9.7(0,268,31):
Paracentral Lobule 31, 5 0.6 0.8 1.4 9.1(23,230,43): 9.0(0,230,43):
Group by Condition Interaction
Overall, analysis of beta weights found that two networks demonstrated a significant group (Controls vs. Schizophrenia) by condition (encoding vs. recognition) interaction. These were the 1) left dorso-/ventrolateral PFC-left posterior parietal-cingulate (Red) (p = 0.002) and the 3) default mode (Green) networks (p = 0.002). In schizophrenia, the former network demonstrated decreased engagement compared to controls during the encoding phase of the experiment and increased engagement during recognition. An opposite effect was observed in the latter network with schizophrenia participants showing increased functional synchro-ny during the encoding phase and vice versa for recognition relative to control participants.
Behavioral Performance
Mean Sternberg task accuracy was significantly lower (p,0.0001) for the schizophrenia group (mean accuracy6SD = 0.8260.12) compared to controls (0.9560.05) assessed using a two-sample t-test. None of the subjects were performing near or below chance level (i.e. 50% accuracy). Further, Pearson
correlations indicated that during encoding both the Red and Blue networks shown in Figure 1 correlated positively (r= 0.37; p,0.0001 and r= 0.20, p,0.05 respectively) with accuracy measures. The default mode/resting state network (Green) showed a negative association with accuracy (r=20.30; p,0.004). The recognition-associated network did not significantly correlate with task accuracy.
Discussion
The purpose of this study was to test for disconnection among prefrontal and parietal brain regions engaged for successful working memory performance in patients diagnosed with schizophrenia. We performed a single group ICA on all data followed by back-reconstruction to produce subject spatial maps and timecourses for each individual [20]. Performing a group ICA (i.e. collapsing over both groups) allowed us to identify functionally connected networks found in the entire sample, while preserving the individual participant/group changes [35]. Group ICA circumvents the problems such as noisy data, matching identical Figure 2. Spatial representation of the recognition network. Axial and coronal slices of network regions that behaved abnormally in schizophrenia during the probe recognition phase of the working memory task. Regions shown are thresholded at P,0.05 FWE corrected derived from a random effects analysis of the relevant component across all participants. Averaged fMRI response (with SEM): is shown on the right for the recognition phase of the task. Note the increased activity of this network during the recognition phase (albeit to a lesser extent in the schizophrenia group).
doi:10.1371/journal.pone.0007911.g002
Table 4.Significant regions and their corresponding Talairach coordinates for the network (shown in figure 2) dysfunctional in schizophrenia during working memory probe recognition.
Recognition
Network regions Brodmann Area
Left Vol in CC
Right Vol in CC
Total Vol in CC
Left Max T (x, y, z):
Right Max T (x, y, z):
Posterior Cingulate 30, 23, 29, 31 3.6 4.6 8.2 8.1(23,251,19): 11.3(9,249,19):
Parahippocampal Gyrus 19, 30, 28, Hippocampus, Amygdala, 27, 36, 37, 35, 34
2.1 4 6.1 6.9(29,246,5): 11.5(18,247,23):
Thalamus Pulvinar, Medial Dorsal, Anterior & Ventral Lateral Nucleus
1.4 2.5 3.9 9.6(26,211,9): 9.8(9,223,9):
Lingual Gyrus 19, 18, 17 0.9 2.1 3 8.1(29,285,213): 11.1(18,247,0):
Fusiform Gyrus 18, 19 0.2 1.2 1.4 7.6(230,274,214): 9.2(24,285,216):
Inferior Occipital Gyrus 18, 17 0 0.7 0.7 NS 9.5(24,288,213):
Precuneus 7, 23 0.2 0.4 0.6 5.5(23,258,61): 6.6(3,258,61):
Cuneus 30, 17 0.1 0.4 0.5 6.1(26,261,6): 10.0(9,258,8):
components across groups/subjects etc that are usually encoun-tered by running separate ICA’s. The initial idea of collapsing data over all loads was to investigate a main effect of task. In doing so, we were able to identify several task-related networks that were engaged to a lesser extent in schizophrenia patients, then extended these findings with supplemental analysis of load effects on functional connectivity for relevant networks.
Red Network
The decreased functionality and anomalous behavior of the left fronto-cingulate-parietal-basal ganglia neurocognitive network observed in schizophrenia in our study is consistent with prior studies that have examined working memory-related BOLD activation [13,21,22,36]. This network likely plays a crucial role in attention and executive control during working memory [37,38]. Consistent with our results, previous studies have shown the importance of fronto-subcortical connections (that closely resemble the Red circuit from our study) during working memory in healthy adults and also have implicated abnormal connectivity of multiple regions within this network in various psychiatric disorders including schizophrenia [11,12,25]. In addition to group differences in hemodynamic response amplitude in this network, we also observed a slight lag in peak response for schizophrenia patients. This network also exhibited a load-dependent pattern of hemodynamic response amplitude; however, this dependency was non-linear in both the groups partly resembling an inverted ‘‘U’’ shape response in peakedness and latency. Overall, the network was less engaged in both spatial extent and amplitude in schizophrenia across all three task loads. A novel voxelwise regression analysis that analyzed spatial load patterns within this network captured individual spatial regions within this network that were associated or recruited during each load condition. This analysis suggested two striking dissimilarities between study groups. First, the increased recruitment of right prefrontal regions of during lower loads in schizophrenia raises the possibility that its elevated function represents a compensatory mechanism for deficits in their left prefrontal encoding network. Second, schizophrenia subjects failed to recruit parietal regions during lower loads. It is important to note that this novel analysis depicts differences in the degree of task modulation for each load-size condition rather than a strict measure of direct connectivity between regions as explored by previous studies. Together, these results illustrate differences in inter-regional connectivity and a distinct spatial pattern of network recruitment in schizophrenia within this key frontal-parietal working memory network, thereby providing further evidence for a ‘‘disconnection hypothesis’’ [18] of schizophrenia.
Blue Network
Green Network
The third significant encoding-related network that was abnormal in schizophrenia consisted of brain regions including the anterior/posterior cingulate, medial frontal gyrus and inferior parietal regions. Together, these have been proposed to represent the default mode, or ‘‘idling state’’ of the brain. Previous studies have shown that these regions decrease activity with increasing cognitive load and might be involved with self-reflection processes, mental imagery and episodic memory retrieval [28,39,40,41]. Consistent with prior studies [35,41,42], we found this circuit to act abnormally in schizophrenia in that it was significantly less engaged (negatively modulated) during encoding, had abnormal load-dependent modulation during both encoding and recogni-tion, and was also negatively correlated to performance accuracy
(for schizophrenic patients who performed more poorly overall, with lower accuracy scores).
Orange Network (Probe Recognition)
this component suggest that it is evenly active almost throughout the recognition phase (again lesser amplitude and slightly lagged in peak response for schizophrenia). Because our task involved recognition of probe items rather than a more challenging free recall demand, it is reasonable to expect fewer executive networks to behave abnormally as the demands on cognitive processing during this phase are relatively low. However, given that this network was no longer significant when ANCOVA statistically adjusted for differences in performance accuracy, these results should be interpreted with caution.
This study in general provides further support for the ‘‘disconnection syndrome’’ hypothesis. The novelty of our study lies in the fact that we utilize ICA to identify which functional networks engage abnormally in schizophrenia specifically during working memory and to characterize various types abnormal activity dynamics in distinctly different networks which ultimately might point towards specific pathophysiological mechanisms. It is important to note that some of the networks described above are known to be engaged during several cognitive tasks and may not just be limited to the present working memory paradigm. For example, a number of these circuits are identified during performance of various tasks when analyzed using ICA [35,39,40,44]. Others (e.g., the ‘‘default mode’’) appear to be near-ubiquitously engaged across different task contexts). One potential limitation of our study was our inability to investigate the maintenance condition of the working memory task due to our fMRI task design. However, even though our task design did not allow us to do this we would like to emphasize that brain regions engaged for encoding information into working memory largely overlap with regions involved with active maintenance or manipulation of that information [1]. Another study limitation is that we were not able to disambiguate possible medication effects in patients (due in part to lack of complete pertinent data) that might have influenced schizophrenia network abnormalities. In addition, given the nature of the sample collected and their
behavioral performance we are unable to address a perennial problem in fMRI research of schizophrenia which is how brain network differences attributed to disease can be disentangled from that due to poor performance. However, our supplemental performance-based ANCOVA results lend confidence in the robustness of the group differences detected.
In summary, we demonstrate a significant impairment of the engagement of a distributed working memory neural network comprising bilateral PFC, anterior cingulate, medial temporal, basal ganglia, inferior frontal and bilateral posterior parietal regions primarily occurring during stimulus encoding. We also provide support for the disconnection hypothesis in schizophrenia by showing that the left prefrontal-parietal network demonstrates an abnormal load dependent neural pattern both in terms of regional connectivity and hemodynamic response (i.e., different network dynamics). These results indicate that impaired working memory ability in schizophrenia is related to abnormal functional integration of several distinct, but potentially interacting networks of brain regions. While some of what is demonstrated here has been previously suspected or could be inferred from similar prior research, one clear value in the current study is precise delineation of specific of network connectivity disruption during working memory. This is an important step towards future studies that will focus further on further characterizing how these networks fail to engage, the clinical or cognitive significance of specific patterns of disrupted connectivity in various abnormal networks through associations with symptomatology or neurocogntive data, and assessment of the relationship between functional disconnection markers and schizophrenia risk genotypes.
Author Contributions
Conceived and designed the experiments: MCS GP. Analyzed the data: SM BF. Contributed reagents/materials/analysis tools: SM MCS VDC GP. Wrote the paper: SM MCS GP.
References
1. Wager TD, Smith EE (2003) Neuroimaging studies of working memory: a meta-analysis. Cogn Affect Behav Neurosci 3: 255–274.
2. Scheibel RS, Levin HS (2004) Working memory and the functional anatomy of the frontal lobes. Cortex 40: 218–219.
3. D’Esposito M, Detre JA, Alsop DC, Shin RK, Atlas S, et al. (1995) The neural basis of the central executive system of working memory. Nature 378: 279–281.
4. Quintana J, Wong T, Ortiz-Portillo E, Kovalik E, Davidson T, et al. (2003) Prefrontal-posterior parietal networks in schizophrenia: primary dysfunctions and secondary compensations. Biol Psychiatry 53: 12–24.
5. Conklin HM, Curtis CE, Katsanis J, Iacono WG (2000) Verbal working memory impairment in schizophrenia patients and their first-degree relatives: evidence from the digit span task. Am J Psychiatry 157: 275–277.
6. Glahn DC, Therman S, Manninen M, Huttunen M, Kaprio J, et al. (2003) Spatial working memory as an endophenotype for schizophrenia. Biol Psychiatry 53: 624–626.
7. Gruber O, Gruber E, Falkai P (2006) Articulatory rehearsal in verbal working memory: a possible neurocognitive endophenotype that differentiates between schizophrenia and schizoaffective disorder. Neurosci Lett 405: 24–28. 8. Cohen JD, Barch DM, Carter C, Servan-Schreiber D (1999) Context-processing
deficits in schizophrenia: converging evidence from three theoretically motivated cognitive tasks. J Abnorm Psychol 108: 120–133.
9. Wexler BE, Stevens AA, Bowers AA, Sernyak MJ, Goldman-Rakic PS (1998) Word and tone working memory deficits in schizophrenia. Arch Gen Psychiatry 55: 1093–1096.
10. Johnson MR, Morris NA, Astur RS, Calhoun VD, Mathalon DH, et al. (2006) A functional magnetic resonance imaging study of working memory abnormalities in schizophrenia. Biol Psychiatry 60: 11–21.
11. Manoach DS, Gollub RL, Benson ES, Searl MM, Goff DC, et al. (2000) Schizophrenic subjects show aberrant fMRI activation of dorsolateral prefrontal cortex and basal ganglia during working memory performance. Biol Psychiatry 48: 99–109.
12. Tekin S, Cummings JL (2002) Frontal-subcortical neuronal circuits and clinical neuropsychiatry: an update. J Psychosom Res 53: 647–654.
13. Pomarol-Clotet E, Salvador R, Sarro S, Gomar J, Vila F, et al. (2008) Failure to deactivate in the prefrontal cortex in schizophrenia: dysfunction of the default mode network? Psychol Med 38: 1185–1193.
14. Ragland JD, Gur RC, Raz J, Schroeder L, Kohler CG, et al. (2001) Effect of schizophrenia on frontotemporal activity during word encoding and recognition: a PET cerebral blood flow study. Am J Psychiatry 158: 1114–1125. 15. Jessen F, Scheef L, Germeshausen L, Tawo Y, Kockler M, et al. (2003) Reduced
hippocampal activation during encoding and recognition of words in schizophrenia patients. Am J Psychiatry 160: 1305–1312.
16. Tan HY, Choo WC, Fones CS, Chee MW (2005) fMRI study of maintenance and manipulation processes within working memory in first-episode schizophre-nia. Am J Psychiatry 162: 1849–1858.
17. Heckers S, Rauch SL, Goff D, Savage CR, Schacter DL, et al. (1998) Impaired recruitment of the hippocampus during conscious recollection in schizophrenia. Nat Neurosci 1: 318–323.
18. Friston KJ, Frith CD (1995) Schizophrenia: a disconnection syndrome? Clin Neurosci 3: 89–97.
19. Meyer-Lindenberg A, Poline JB, Kohn PD, Holt JL, Egan MF, et al. (2001) Evidence for abnormal cortical functional connectivity during working memory in schizophrenia. Am J Psychiatry 158: 1809–1817.
20. Calhoun VD, Adali T, Pearlson GD, Pekar JJ (2001) A method for making group inferences from functional MRI data using independent component analysis. Hum Brain Mapp 14: 140–151.
21. Babiloni C, Babiloni F, Carducci F, Cincotti F, Vecchio F, et al. (2004) Functional frontoparietal connectivity during short-term memory as revealed by high-resolution EEG coherence analysis. Behav Neurosci 118: 687–697. 22. Kondo H, Morishita M, Osaka N, Osaka M, Fukuyama H, et al. (2004)
Functional roles of the cingulo-frontal network in performance on working memory. Neuroimage 21: 2–14.
23. Woodward TS, Cairo TA, Ruff CC, Takane Y, Hunter MA, et al. (2006) Functional connectivity reveals load dependent neural systems underlying encoding and maintenance in verbal working memory. Neuroscience 139: 317–325. 24. Abe M, Hanakawa T, Takayama Y, Kuroki C, Ogawa S, et al. (2007)
25. Chang C, Crottaz-Herbette S, Menon V (2007) Temporal dynamics of basal ganglia response and connectivity during verbal working memory. Neuroimage 34: 1253–1269.
26. Stephan KE, Magnotta VA, White T, Arndt S, Flaum M, et al. (2001) Effects of olanzapine on cerebellar functional connectivity in schizophrenia measured by fMRI during a simple motor task. Psychol Med 31: 1065–1078.
27. Das P, Kemp AH, Flynn G, Harris AW, Liddell BJ, et al. (2007) Functional disconnections in the direct and indirect amygdala pathways for fear processing in schizophrenia. Schizophr Res 90: 284–294.
28. Zhou Y, Liang M, Jiang T, Tian L, Liu Y, et al. (2007) Functional dysconnectivity of the dorsolateral prefrontal cortex in first-episode schizophre-nia using resting-state fMRI. Neurosci Lett 417: 297–302.
29. Sternberg S (1966) High-speed scanning in human memory. Science 153: 652–654.
30. First MB (2002) The DSM series and experience with DSM-IV. Psychopathol-ogy 35: 67–71.
31. Freire L, Roche A, Mangin JF (2002) What is the best similarity measure for motion correction in fMRI time series? IEEE Trans Med Imaging 21: 470–484. 32. Calhoun VD, Liu J, Adali T (2008) A review of group ICA for fMRI data and
ICA for joint inference of imaging, genetic, and ERP data. Neuroimage. 33. Bell AJ, Sejnowski TJ (1995) An information-maximization approach to blind
separation and blind deconvolution. Neural Comput 7: 1129–1159. 34. Li YO, Adali T, Calhoun VD (2007) Estimating the number of independent
components for functional magnetic resonance imaging data. Hum Brain Mapp 28: 1251–1266.
35. Calhoun VD, Maciejewski PK, Pearlson GD, Kiehl KA (2007) Temporal lobe and ‘‘default’’ hemodynamic brain modes discriminate between schizophrenia and bipolar disorder. Hum Brain Mapp.
36. Barch DM, Csernansky JG (2007) Abnormal parietal cortex activation during working memory in schizophrenia: verbal phonological coding disturbances versus domain-general executive dysfunction. Am J Psychiatry 164: 1090–1098. 37. Smith EE, Jonides J (1999) Storage and executive processes in the frontal lobes.
Science 283: 1657–1661.
38. Bunge SA, Klingberg T, Jacobsen RB, Gabrieli JD (2000) A resource model of the neural basis of executive working memory. Proc Natl Acad Sci U S A 97: 3573–3578.
39. Beckmann CF, DeLuca M, Devlin JT, Smith SM (2005) Investigations into resting-state connectivity using independent component analysis. Philos Trans R Soc Lond B Biol Sci 360: 1001–1013.
40. Calhoun VD, Kiehl KA, Pearlson GD (2008) Modulation of temporally coherent brain networks estimated using ICA at rest and during cognitive tasks. Hum Brain Mapp.
41. Garrity AG, Pearlson GD, McKiernan K, Lloyd D, Kiehl KA, et al. (2007) Aberrant ‘‘default mode’’ functional connectivity in schizophrenia. Am J Psychiatry 164: 450–457.
42. Whitfield-Gabrieli S, Thermenos HW, Milanovic S, Tsuang MT, Faraone SV, et al. (2009) Hyperactivity and hyperconnectivity of the default network in schizophrenia and in first-degree relatives of persons with schizophrenia. Proc Natl Acad Sci U S A 106: 1279–1284.
43. Haenschel C, Bittner RA, Haertling F, Rotarska-Jagiela A, Maurer K, et al. (2007) Contribution of impaired early-stage visual processing to working memory dysfunction in adolescents with schizophrenia: a study with event-related potentials and functional magnetic resonance imaging. Arch Gen Psychiatry 64: 1229–1240.