Lesion Location-Based Prediction of Visual
Field Improvement after Cerebral Infarction
Bum Joon Kim1☯, Yong-Hwan Kim2☯, Namkug Kim3,4, Sun U. Kwon1, Sang Joon Kim3, Jong S. Kim1, Dong-Wha Kang1,2*
1Department of Neurology, Asan Medical Center, University of Ulsan College of Medicine, Seoul, Seoul Korea,2Vision, Image and Learning Laboratory, Asan Institute for Life Sciences, Asan Medical Center, Seoul, South Korea,3Department of Radiology, Asan Medical Center, University of Ulsan College of Medicine, Seoul, Seoul Korea,4Department of Convergence Medicine, Asan Medical Center, University of Ulsan College of Medicine, Seoul, Seoul Korea
☯These authors contributed equally to this work.
*dwkang@amc.seoul.kr
Abstract
Background
Although the prognosis of ischemic stroke is highly dependent on the lesion location, it has rarely been quantitatively utilized. We investigated the usefulness of regional extent of ischemic lesion (rEIL) predicting the improvement of visual field defect (VFD) in patients with posterior cerebral artery infarction.
Methods
The rEILs were measured in each individual cortex after transforming the lesions to a stan-dard atlas. Significant improvement of VFD was tentatively defined as 20% improvement at 3 months after stroke. The performances of clinical and imaging variables predicting signifi-cant improvement were measured by support vector machine. The maximum performance of variables predicting the significant improvement was compared between subgroups of variables (clinical, baseline severity and lesion volume) and the effect of adding rEIL to those subgroups of variables was evaluated.
Results
A total of 35 patients were enrolled in this study. Left PCA infarct, MR-time from onset, rEILs in the lingual, calcarine, and cuneus cortices were good prognostic indicators of hemi-VFD (performance for predicting the significant improvement: 72.8±11.8%, 66.1±11.2%, respec-tively). A combination of the rEILs of each cortical subregions demonstrated a better predic-tive performance for hemi-VFD (83.8±9.5%) compared to a combination of clinical variables (72.8±11.8; p<0.001), baseline severity (63.0±11.9%; p<0.001), or lesion volume (62.6
±12.7%; p<0.001). Adding a rEIL to other variables improved the prognostic prediction for hemi-VFD (74.4±11.6% to 91.3±7.7%; p<0.001).
a11111
OPEN ACCESS
Citation:Kim BJ, Kim Y-H, Kim N, Kwon SU, Kim SJ, Kim JS, et al. (2015) Lesion Location-Based Prediction of Visual Field Improvement after Cerebral Infarction. PLoS ONE 10(11): e0143882. doi:10.1371/ journal.pone.0143882
Editor:Jean-Claude Baron, INSERM U894, FRANCE
Received:May 30, 2015
Accepted:November 10, 2015
Published:November 25, 2015
Copyright:© 2015 Kim et al. This is an open access article distributed under the terms of theCreative Commons Attribution License, which permits unrestricted use, distribution, and reproduction in any medium, provided the original author and source are credited.
Data Availability Statement:All relevant data are within the paper and its Supporting Information files.
Funding:This study was supported by grants from the National Research Foundation of Korea (NRF) funded by the Korean government (MEST) (NRF-2014R1A2A1A11051280), and the Korea Health Technology R&D Project and Ministry for Healthcare & Welfare, Republic of Korea (HI12C1847 and HI14C1983).
Conclusions
An estimation of rEIL provides useful information regarding the ischemic lesion location. rEIL accurately predicts the significant improvement of VFD and enhances the prediction power when combined with other variables.
Introduction
Understanding the natural course and prognosis helps to guide the management of ischemic stroke. [1] The severity of neurological deficit, patient’s age, comorbid diseases and the mecha-nism of stroke are known to affect functional outcome. [2,3] Approaches to predict post-stroke recovery using these clinical variables may provide a convenient method to assess the progno-sis. However, these factors predict only less than 50% of variance in stroke recovery. [4] In addition, while some clinical variables are consistently associated with stroke prognosis among previous studies, other variables show variations.
The topographical lesion location determines the type and severity of neurological deficits. The location of the ischemic lesion was associated with functional outcome [5] and more spe-cifically, involvement of the cerebral cortex was associated with poor functional recovery. [6,7] Finally, the prognosis of neurological deficits was well predicted by atlas-based lesion coding. [8] However, still quantitative analyses of the extent of ischemic damage in each cortex for pre-dicting the prognosis has not been widely accepted.
Unlike other impairments caused by stroke (e.g. motor or language dysfunction), the lesion location causing visual field defect (VFD) is less diverse. Usually, the lesion causing VFD is located at the area supplied by posterior cerebral artery (PCA) and the lesion location well-cor-relates with the severity of VFD objectively measured by perimetry. [9] Therefore, a prediction model of VFD to assess the extent of ischemic damage in an individual visual cortex may be appropriate to evaluate the usefulness of lesion location-based prediction of prognosis after ischemic stroke. Here, we tried to verify the value of assessing the regional extent of ischemic lesion (rEIL) in individual visual cortices using the initial diffusion-weighted image (DWI) for the prediction of VFD improvement after stroke.
Materials and Methods
Subjects and study design
Ischemic stroke patients with VFD caused by PCA infarction were prospectively enrolled between September 2011 and July 2014. Patients were included if they were older than 20 years of age and if they were admitted to Asan Medical Center within one week of symptom onset. Patients were excluded if they (1) received thrombolysis, (2) had a previous history of stroke, (3) had new vascular events (e.g., hemorrhagic transformation or recurrent ischemic stroke) between enrollment and final follow-up, and/or (4) had visual field test results that were unreli-able due to being clinically inconsistent and incomplete (e.g. frequent fixation loss and false negative or positive responses)
Enrolled patients were assigned into one of two groups to perform a classification test. A visual field score increase of more or less than 20% from baseline to three months was arbi-trarily regarded as a significant or poor VFD improvement, respectively. This cut-off value was chosen because it was close to the median value of improvement among all patients. The Insti-tutional Review Board of the Asan Medical Center approved this study. Written informed con-sent was obtained from the patients or their legally authorized reprecon-sentatives.
Visual field test and analysis
VFD was quantitatively measured by a Humphrey Field Analyzer(HFA 750i,program 30–2,
SITA-Fast strategy; Zeiss-Humphrey,Leandro,CA). Patients were asked to respond when the short light stimuli appeared with their head fixed in position. The subjects were asked to fixate a fixation spot to reduce the influence of eye movements. From the visual field test, whole visual field consists of 76 points (19 points for each quadrant) for each eye. Each point is pre-sented as a standard deviation from the mean score of an age-matched normal population (i.e. total deviation score). First, the average visual field score of a particular point was calculated by averaging the scores of both eyes. Then, by summating the average visual field score of each point in individual hemi-field and upper- or lower-quadrants of those who had a defect at the particular field were regarded as the visual field score of hemi- and upper- or lower-VFD, respectively. The whole visual field was categorized into four quadrants, upper-affected side (upper-VFD), upper-unaffected side, lower-affected side (lower-VFD), and lower-unaffected side. Defects on the affected side of the upper- and lower quadrants were considered as defect on hemi-field.
Analysis and quantification of ischemic lesion
Patients underwent 1.5-T MRI scanning(Siemens Avanto,Siemens Medical Solutions). DWIs were obtained by a single-shot spin-echo echo-planar imaging technique with repetition time of 3000 ms, echo time of 86 ms, 0.651 × 0.651 × 5 mm3resolution with 2 mm gap, 384 × 384 in-plane voxels. Additionally, patients underwent 3-T MRI scanning(Philips Achieva; Philips Medical Systems)at 1 week after symptom onset to obtain high-resolution T1-weighted MR images (MP-RAGE, voxel size = 1 × 1 × 1 mm3).
An ischemic lesion mask was extracted using FSLView toolbox in FMRIB Software Library (FSL) in its native DWI space [10]. The ischemic lesion was delineated by manual drawing of the margin of the DWI lesion by an investigator (Y.-H.K) under supervision by a stroke neurol-ogist (D.-W.K) who were blind to any clinical information. The lesion volume was calculated in its native space.
regional damage as follows: (the volume of lesion inside the individual gyrus / the total volume of individual gyrus)×100 (%) (Fig 1).
Statistical analysis and classification test
Clinical variables, baseline visual field score, lesion volume, and rEIL were compared between the two groups (significant vs. poor improvement groups). Chi-square test, Student’s t-test, and Fisher’s exact test were used as appropriate. The variables were also test by the correlation analysis to evaluate association with relative changes of visual field scores. A two-tailed
p<0.05 was considered statistically significant. To compare the voxel-wise frequency differ-ence of lesion between the significant and poor improvement groups, Bernoulli model based two sample t-test was performed for each voxel. (12) The false discovery rate correction with significance level atq<0.05 was employed with considering the multiple comparisons in the voxel-wise test.[12] All statistical analyses except for support vector machine (SVM) were per-formed using SPSS for Windows (version 17.0; SPSS Inc.).
Fig 1. Schematic diagram of lesion quantification.(A) Process of registration into standard MNI space. (B) Exemplar images for each registration stage. Image modalities were denoted (DWI = diffusion weighted image; LesionMask = delineated binary lesion mask image; T1 = T1-weighted image). The image spaces during the registration process were denoted by sub-script (e.g., SBJ-DWI = individual subjects’DWI space; SBJ-T1 = individual high-resolution T1 space; and MNI = standard MNI space).
For classification tests, a linear kernel-based SVM(implemented in MATLAB with
‘svmtrain’and‘svmclassify’modules,MathWorks,Inc.,Natick,MA)was adopted to train and validate the prognosis classifier. [13] Each patient was assigned into one of two classes: a sig-nificant and poor improvement group. For the test-retest of classification performance, 70% of the enrolled patients from both the significant and poor improvement groups were randomly selected and used to train the classifier. The remaining patients were used to test the perfor-mance of the classifier. Perforperfor-mance evaluation was conducted 100 times with randomly assigned training and test sets. Given a set of data (N × M; N = number of subjects and M = number of variables), all the possible combinations of variables (i.e., 2M) were considered. Best performance of a combination in a given set was determined based on the highestt-score from the one samplet-test between classification performances performed 100 times and at random chance.
First, all variables were solely tested (i.e., M = 1). Second, variable categorized as subgroups
—clinical variables (M = 9), baseline visual field score (M = 1), initial lesion volume (M = 1), and rEILs (M = 9)—were tested to identify the best subgroup predicting the improvement of VFD with the highest performance. Finally, multivariate classification tests were performed by combining various subgroups of variables to identify the effect of adding rEIL to the previously known predictive factors. A paired t-test (i.e., trained classifier with same training set) was per-formed between the best performances of each subgroup of variables. A two tailedp<0.05 with Bonferroni correction was considered statistically significant.
Results
Subjects and visual field improvement
During the study period, 51 patients, admitted to our stroke center with VFD and PCA infarction, were screened. Of these, 9 patients refused to participate in the study. Among the initially included 44 patients, 9 patients were further excluded (3 patients with suboptimal visual field test data due to poor compliance, another 2 patients with stroke recurrence, and 4 patients with hemorrhagic transformation during follow-up).Finally, 35 patients were enrolled.
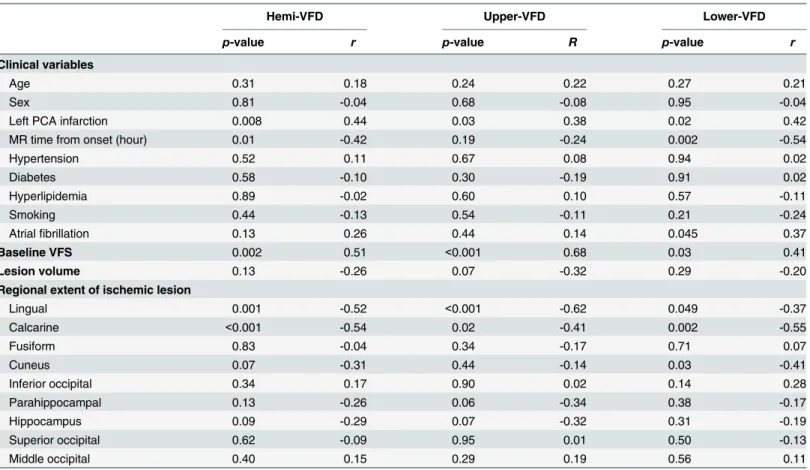
The mean age was 61.6 (SD 11.0) years, and 28 patients (80.0%) were men. Of the 35 patients, 26 (74.3%) had homonymous hemianopia, while the remaining 9 patients had quad-rantanopia. By quadrants, 32 patients had upper-VFD, and 29 patients had lower-VFD. Of them, 20 of 35 patients (57.1%) with hemi-VFD, 13 of 32 patients (40.6%) with upper-VFD, and 13 of 29 patients (44.8%) with lower-VFD were classified as having a significant improve-ment (Fig 2). Patients with significant hemi-VFD improvement demonstrated a less severe baseline VFD, more frequent infarct location in the left hemisphere (p = 0.01) and shorter interval between stroke onset and MR time (p = 0.03) than patients with a poor hemi-VFD improvement. Significant upper-VFD improvement was also associated with higher baseline visual field score (p<0.001) and initial lesion volume (p= 0.03) compared to that of patients with poor upper-VFD improvement. However, in terms of lower-VFD improvement, baseline visual field score or initial ischemic lesion volume was not different, whereas infarct on left PCA (p= 0.04), atrial fibrillation (p= 0.03) earlier MR time (p= 0.009) was associated with patients with significant lower-VFD improvement (Table 1).
fibrillation and rEIL of cuneus cortex were significantly associated with the relative changes of visual field scores in lower-VFD only (p<0.05;Table 2).
rEIL and visual field prognosis
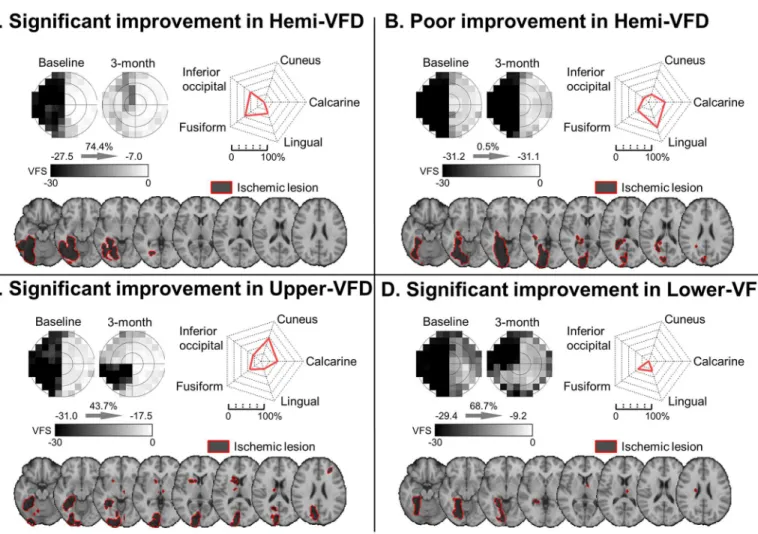
High rEIL was found in the lingual (33.4 ± 4.7%), calcarine (24.9 ± 4.5%), fusiform cortex (21.4 ± 3.7%), and cuneus (14.9 ± 3.8%). A significant improvement for hemi-VFD demon-strated less rEIL in the calcarine, lingual and cuneus. In addition to calcarine and lingual cortex, significant improvements were associated with less involvement of the lingual cortex and hip-pocampus in upper-VFD, and cuneus in lower-VFD (Table 1,Fig 3).Fig 4shows the represen-tative patients with their VFD improvement and lesion location.
Factors associated with visual field improvement by univariate analysis
According to the classification tests based on single variables, the variables demonstrating the highest performance for predicting significant hemi-VFD improvement was rEIL of the lingual cortex (classification performance predicting the prognosis: 75.0 ± 13.9%;p<0.001), calcarine cortex (74.7 ± 10.9%,p<0.001), cuneus (71.3 ± 10.8%,p<0.001) left PCA infarct
(72.8 ± 11.8%, p<0.001), MR time from onset (66.1 ± 11.2%, p<0.001)and hypertension (65.6 ± 14.2%,p= 0.01) comparing to the random chance of 60%. Significant upper-VFD improvement was well predicted by the baseline visual field score (80.0 ± 10.8%,p<0.001) and rEIL of lingual cortex (69.5 ± 15.0%,p<0.001) comparing to the random chance of 62.5%. Sig-nificant lower-VFD improvement was well predicted by rEIL of the calcarine cortex (81.9 ±12.2%,p<0.001), lingual cortex (67.7 ± 11.8%,p<0.001), cuneus (66.7 ± 13.9%,p<0.001), atrial fibrillation (70.4 ± 11.9%,p<0.001), left PCA infarct (65.4 ±16.4%, p<0.001), MR time from onset (65.0 ± 14.0%, p<0.001), smoking (65.0 ± 14.1%,p<0.001) and baseline visual field score (61.3±10.6%,p= 0.02) comparing to the random chance of 57.1% (Fig 5).
Fig 2. The improvement of VFD.Scatter plots show baseline VFS (i.e., at 1 week; x-axis) and follow-up VFS (i.e., at 3 months; y-axis) for hemi-VFD (left), upper-VFD (middle) and lower-VFD (right) subgroups. In each VFD subgroup, the significant improvement was defined who showed %VFS greater than 20%. The subjects with significant and poor improvement were plotted with white filled circle and with gray filled triangle, respectively. Mean and standard error plots at baseline and follow-up were shown in sub-box. VFS = average visual field score in each hemi-field, upper-quadrant or lower-quadrant, respectively; %VFS = (follow-up VFS—baseline VFS) / |baseline VFS|×100(%).
Subgroups and combination of subgroups for visual field improvement
prediction
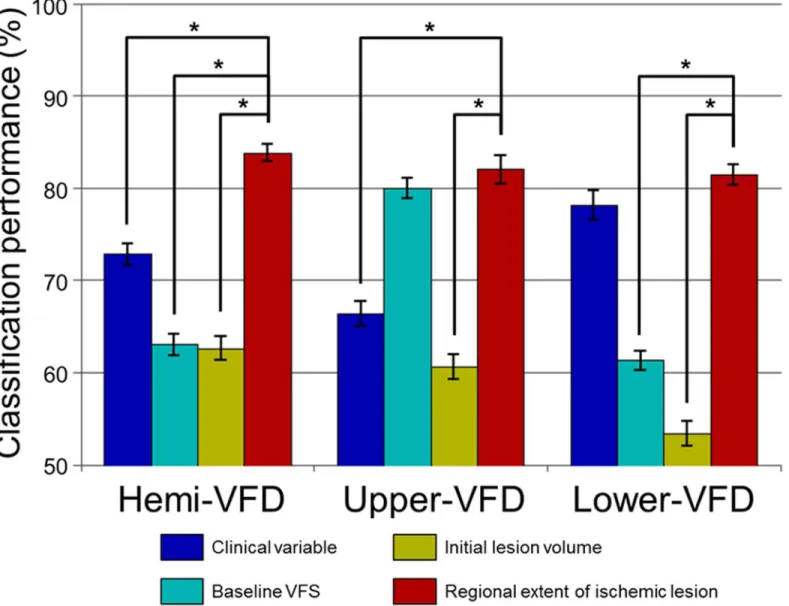
The prediction performance of the visual field improvement was highest using the rEIL (hemi-VFD: 83.8±9.5%, upper-(hemi-VFD: 82.0 ± 15.0%, and lower-(hemi-VFD: 81.4 ± 11.0%) compared with clinical variables (hemi-VFD: 72.8 ± 11.8%,p<0.001; upper-VFD: 66.4 ± 13.5%,p<0.001; and lower-VFD: 78.1 ± 16.0%, no significance), baseline VFD (hemi-VFD: 63.0 ± 11.9%,
p<0.001; and lower-VFD: 61.3 ± 10.6%,p<0.001), or initial ischemic lesion volume (hemi-VFD: 62.6 ± 12.7%,p<0.001; upper-VFD: 60.6 ± 13.5%,p<0.001; and lower-VFD: 53.4 ± 13.4%,p<0.001;Fig 6). The baseline VFD failed to show a significant difference with rEIL for predicting the significant improvement of upper-VFD.
Adding rEIL information to the prediction model including clinical variables, baseline VFD, and initial lesion volume enhanced the performance for predicting the significant improve-ment of VFD; hemi-VFD: from 74.4 ± 11.6% to 91.3 ± 7.7% (p<0.001), upper-VFD: from 82.3 ± 11.5% to 94.8 ± 8.2% (p<0.001) and lower-VFD: from 77.7 ± 12.9% to 89.7 ± 9.5% (p<0.001;Fig 7).
Table 1. Comparison between patients with significant and poor VFD improvement.
Hemi-VFD Upper-VFD Lower-VFD
Significant (n = 20)
Poor (n = 15)
p Significant (n = 13)
Poor (n = 19)
p Significant (n = 13)
Poor (n = 16)
p
Clinical variables
Age (y) 63.8 [8.1] 58.7 [13.8] 0.18 64.2 [8.7] 60.6 [12.4] 0.37 64.5 [6.4] 59.2 [13.4] 0.20
Male 15 (75.0) 13 (86.7) 0.39 9 (69.2) 16 (84.2) 0.31 10 (76.9) 13 (81.2) 0.78
Left PCA infarction 14 (70.0) 4 (26.7) 0.01 9 (69.2) 7 (36.8) 0.07 9 (69.2) 5 (31.3) 0.04 MR time from onset
(hour)
25.5 [30.4] 53.1 [41.7] 0.03 31.2 [34.9] 41.3 [37.2] 0.45 18.3 [17.6] 55.5 [44.4] 0.009
Hypertension 16 (80.0) 8 (53.3) 0.09 10 (76.9) 12 (63.2) 0.41 9 (69.2) 10 (62.5) 0.71
Diabetes 7 (35.0) 6 (40.0) 0.76 3 (23.1) 8 (42.1) 0.27 5 (38.5) 6 (37.5) 0.96
Hyperlipidemia 9 (45.0) 6 (40.0) 0.77 5 (38.5) 7 (36.8) 0.93 6 (46.2) 8 (50.0) 0.84
Smoking 7 (35.0) 9 (60.0) 0.14 5 (38.5) 9 (47.4) 0.62 4 (30.8) 10 (62.5) 0.09
Atrialfibrillation 6 (30.0) 2 (13.3) 0.25 4 (30.8) 4 (21.1) 0.53 5 (38.5) 1 (6.2) 0.03 Baseline VFS -21.9 [7.7] -27.7 [5.0] 0.02 -22.0 [8.5] -29.6 [1.6] <0.001 -24.6 [9.0] -29.5 [4.5] 0.07 Lesion volume 20.8 [14.4] 34.0 [23.8] 0.05 19.6 [14.2] 34.5 [20.9] 0.03 20.6 [13.1] 31.6 [24.2] 0.15 Regional extent of ischemic lesion (%)
Lingual 21.1 [21.5] 49.8 [27.0] 0.001 16.1 [14.6] 50.3 [24.7] <0.001 18.6 [24.3] 41.3 [27.7] 0.03
Calcarine 10.6 [15.2] 44.1 [26.2] <0.001 9.8 [14.2] 36.4 [29.3] 0.005 10.6 [15.5] 43.3 [26.4] <0.001 Fusiform 19.5 [21.3] 24.0 [21.9] 0.55 18.4 [22.9] 26.9 [19.9] 0.27 19.3 [21.7] 21.5 [21.7] 0.78 Cuneus 7.0 [15.1] 25.5 [26.4] 0.01 9.1 [18.2] 18.7 [26.0] 0.26 6.4 [11.3] 27.5 [26.7] 0.01 Inferior occipital 14.3 [21.1] 13.1 [13.7] 0.85 15.4 [21.6] 14.8 [16.5] 0.93 15.4 [21.7] 12.6 [14.2] 0.69 Parahippocampal 7.6 [11.2] 13.7 [16.0] 0.19 5.5 [8.6] 15.1 [15.6] 0.05 7.5 [12.5] 12.6 [15.7] 0.35 Hippocampus 5.1 [10.5] 12.6 [18.6] 0.14 2.5 [4.3] 13.6 [18.3] 0.04 5.7 [12.6] 11.4 [18.0] 0.34 Superior occipital 4.6 [12.2] 10.7 [17.2] 0.23 6.7 [14.8] 8.3 [15.9] 0.78 6.6 [14.8] 10.3 [16.7] 0.54 Middle occipital 6.0 [18.4] 5.5 [13.2] 0.93 9.0 [22.5] 4.5 [11.8] 0.46 9.2 [22.4] 5.1 [12.8] 0.54
Results are expressed in number and (% column) or mean [SD]. VFD: visualfield defect, VFS: visualfield score
Discussion
In the present study, we demonstrated the usefulness of a quantitative analysis of lesion loca-tion based on a standard atlas for predicting the significant VFD improvement after PCA infarction. Less involvement of the calcarine, lingual, and cuneus cortices was associated with significant VFD improvement. A quantified lesion location showed a better performance for predicting the significant improvement than ordinary clinical variables or a combination of those variables. In addition, adding rEIL information to the classification test enhanced its per-formance for predicting the significant VFD improvement with ordinarily used clinical variables.
Various clinical variables including age, previous stroke history, and the initial severity after stroke well correlate with improvement of various symptoms after stroke. Previously, one of the clinical factors associated with significant improvement of VFD was the time from the injury to evaluation.[14] In the present study, we have comprehensively compared the perfor-mance of each clinical variable predicting the improvement of VFD. Left-sided PCA infarction and short interval between stroke onset and MRI were associated with significant hemi-VFD improvement. This finding corresponds well with the previous studies showing that the left-sided hemispheric lesions improve better, [15,16] and that shorter interval between stroke onset and hospital admission is associated with significant improvement.[14]
Considering the stroke location, our current results are consistent with those of a previous study demonstrating that the involvement of the striate cortex and lesion expansion to the
Table 2. Correlation between predictive factors and relative changes of VFS (%VFS).
Hemi-VFD Upper-VFD Lower-VFD
p-value r p-value R p-value r
Clinical variables
Age 0.31 0.18 0.24 0.22 0.27 0.21
Sex 0.81 -0.04 0.68 -0.08 0.95 -0.04
Left PCA infarction 0.008 0.44 0.03 0.38 0.02 0.42
MR time from onset (hour) 0.01 -0.42 0.19 -0.24 0.002 -0.54
Hypertension 0.52 0.11 0.67 0.08 0.94 0.02
Diabetes 0.58 -0.10 0.30 -0.19 0.91 0.02
Hyperlipidemia 0.89 -0.02 0.60 0.10 0.57 -0.11
Smoking 0.44 -0.13 0.54 -0.11 0.21 -0.24
Atrialfibrillation 0.13 0.26 0.44 0.14 0.045 0.37
Baseline VFS 0.002 0.51 <0.001 0.68 0.03 0.41
Lesion volume 0.13 -0.26 0.07 -0.32 0.29 -0.20
Regional extent of ischemic lesion
Lingual 0.001 -0.52 <0.001 -0.62 0.049 -0.37
Calcarine <0.001 -0.54 0.02 -0.41 0.002 -0.55
Fusiform 0.83 -0.04 0.34 -0.17 0.71 0.07
Cuneus 0.07 -0.31 0.44 -0.14 0.03 -0.41
Inferior occipital 0.34 0.17 0.90 0.02 0.14 0.28
Parahippocampal 0.13 -0.26 0.06 -0.34 0.38 -0.17
Hippocampus 0.09 -0.29 0.07 -0.32 0.31 -0.19
Superior occipital 0.62 -0.09 0.95 0.01 0.50 -0.13
Middle occipital 0.40 0.15 0.29 0.19 0.56 0.11
VFD = visualfield defect; VFS = visualfield score; %VFS = (follow-up VFS—baseline VFS) / |baseline VFS |.
occipital pole was associated with poor VFD recovery [17]. In the present study, not the total lesion volume, but the rEIL of the lingual cortex demonstrates a high performance for predict-ing the improvement of hemi-, upper-, and lower-VFD. Visual field recovery is likely to be mediated by the immediate surrounding residual neuronal elements to the infarcted visual cor-tex, which plays a major role in receptive field plasticity [18] Therefore, brain damage of a spe-cific region, may be more important in vision restoration than the overall ischemic lesion volume.
However, only a few studies have focused on lesion location-based prediction for the prog-nosis of stroke. A multivariate linear regression model with lesion-weighted CT perfusion data has accurately predicted the improvement of motor and language function after stroke [5,19]. Compared to CT, MRI provides a more detailed structure of the brain and may therefore be more appropriate for predicting lesion- based prognosis [20,21]. Recently, the outcome and
Fig 3. rEIL and the improvement of VFD.(A) Quantitatively represented location of the gyrus involved. White-filled circles with red-colored solid lines indicate significant improvement group (i.e., %VFS>20%) and gray-colored triangles with blue-colored solid lines indicate poor improvement group (i.e., %VFS<20%). (B) Differences in lesion patterns between significant and poor improvement groups were analyzed using the two-sample test for Bernoulli distribution False discovery rate correction based significance was determined at q<0.05 (z = 2.825 for hemi-VFD; z = 2.813 for upper-VFD; and z = 2.914
for lower-VFD). Ipsilesional and contralesional hemispheres were presented in left and right side of brain, respectively.
recovery of language function was appropriately predicted using SVM with lesion-location data from MRI [8]. The results were consistent with our current findings in that atlas-based lesion data showed additive value to enhance the power of variance for predicting prognosis.
Interestingly, the factors showing the best predictive performance slightly differed between upper- and lower-VFDs. Only the baseline visual field score and rEIL of lingual cortex demon-strated a significantly higher performance predicting the prognosis of upper-VFD. The lingual cortex is supplied by the calcarine artery and is located close to the PCA making them more frequently involved and more likely to be located at the infarct core [22]. Therefore, the initial severity may be the major deterministic factor of the prognosis of upper-VFD. However, still rEIL significantly increased the classification performance when it was added to other variables (Fig 7). In contrast, infarct volume or baseline visual field score was not found to be associated with the prognosis of lower-VFD (Fig 5). Instead, the rEILs of the calcarine, lingual cortex and cuneus were a good prognostic indicator. These results imply that the specific lesion location itself plays a relatively more important role in the prognosis of lower-VFD. Consistent with our results, previous studies have demonstrated that the recovery of lower-VFD is better than
Fig 4. Representative cases of VFD pattern, rEIL and lesion location.(A) Significant improvement in hemi-VFD, (B) Poor improvement in hemi-VFD, (C) Significant improvement in upper-VFD, (D) Significant improvement in lower-VFD. (Top-left in A-D) Gray scaled visual field was presented. (Top-right in A-D) Red-colored solid lines indicate quantified lesion location by regional extent of ischemic lesion. (Bottom in A-D) Lesion area was superimposed on standard MNI T1 scan. The border line and area of lesion were shown with red-solid line and dark area.
that of upper-VFD after ischemic stroke and that the preservation of the cuneus cortex is asso-ciated with restoration of lower-VFD [23].
Still there may be some debates in defining 20% improvement from the baseline visual field score as a significant VFD improvement. Patients with mild VFD may not reach the 20%
Fig 5. Performance of each variable from the classification test.Mean and standard deviation across 100 times of classification test were plotted. Significantly greater performance than random chance was filled with red color (p<0.001). Dotted red-line represents the random chance. Random chance = (greater number of subjects among significant and poor improvement group) / total number of subjects for each hemi-VFD, upper-VFD and lower-VFD, respectively.
improvement due to ceiling effect. However, there was not any patient who was classified as non-significant improvement due to the ceiling effect, and even the mildest patient in our sam-ple demonstrated a VFD enough to improve more than 20% before reaching the normal score. Furthermore, the analysis using the absolute difference in the visual field score from baseline to follow-up (ΔVFS) did not show significant major difference from the analysis to that of using percent improvement from baseline (%VFS). From the previous studies, the size of the relative vision was used for evaluating the outcome, [24] [25] and much smaller improvement rates were considered clinically meaningful. [26] In the present study we used a median split to dichotomize the patients and perform a classification test using SVM. This may be arbitrary and lead to a bias. However, the correlation analysis between variables and the relative change of visual field score demonstrated similar results (Table 2). Further discussion may be needed in the method and cut-off value defining significant improvement in VFD after stroke.
Fig 6. Maximum classification performances predicting the improvement of VFD.Mean and standard error of maximum classification performance were plotted for each subgroup features. Asterisk (*) represents statistically significant differences from paired t-test across 100 times of classification test (p<0.05).
There are some additional noteworthy limitations to this study. First, sample size was small. However, we performed a test-retest classification to ensure the reliability of our results. Sec-ond, recanalization of the PCA was not checked, which may influence the functional recovery. Third, while this lesion location-based prognosis prediction model accurately predicted the improvement of VFD, other stroke symptoms (e.g., motor weakness and aphasia) should also be evaluated in this model to expand its clinical application. Finally, though most VFD follow-ing stroke has largely been attributed to cortical lesions, infarct at the different visual areas such as optic radiation fibers was not considered in the present study. Further studies using dif-fusion tensor image or functional connectivity MRI to predict the improvement of VFD may be needed. [27]
Fig 7. The effect of adding rEIL to other variables on predicting VFD improvement.Mean and standard error of maximum classification performance were plotted without (blue-colored bar plot) and with (red-colored bar plot) including the quantified lesion location features (e.g., regional extent of ischemic lesion).
Conclusions
In conclusion, the lesion location based on rEIL of each individual cortex—which is easily applicable in the clinical practice—accurately predicts the improvement of VFD. Adding rEIL data to clinical variables improves the performance of a prediction model for VFD after PCA infarction. Furthermore, because the predictive factors differ between upper and lower visual field, the mechanism of restoration of upper- and lower-VFDs may also be different.
Supporting Information
S1 Data. Raw data.
(XLSX)
Acknowledgments
This study was supported by grants from the National Research Foundation of Korea (NRF) funded by the Korean government (MEST) (No. 2011–0016868 and
NRF-2014R1A2A1A11051280), and the Korea Health Technology R&D Project and Ministry for Healthcare & Welfare, Republic of Korea (HI12C1847 and HI14C1983).
Author Contributions
Conceived and designed the experiments: BJK YHK NK SUK SJK JSK DWK. Performed the experiments: YHK DWK. Analyzed the data: BJK YHK SJK DWK. Contributed reagents/mate-rials/analysis tools: YHK NK DWK. Wrote the paper: BJK SUK JSK DWK.
References
1. Holloway RG, Benesch CG, Burgin WS, Zentner JB (2005) Prognosis and decision making in severe stroke. JAMA 294: 725–733. PMID:16091575
2. Ween JE, Alexander MP, D'Esposito M, Roberts M (1996) Factors predictive of stroke outcome in a rehabilitation setting. Neurology 47: 388–392. PMID:8757009
3. Hankey GJ, Spiesser J, Hakimi Z, Bego G, Carita P, et al. (2007) Rate, degree, and predictors of recov-ery from disability following ischemic stroke. Neurology 68: 1583–1587. PMID:17485645
4. Stinear C (2010) Prediction of recovery of motor function after stroke. Lancet Neurol 9: 1228–1232.
doi:10.1016/S1474-4422(10)70247-7PMID:21035399
5. Payabvash S, Souza LC, Kamalian S, Wang Y, Passanese J, et al. (2012) Location-weighted CTP analysis predicts early motor improvement in stroke: a preliminary study. Neurology 78: 1853–1859.
doi:10.1212/WNL.0b013e318258f799PMID:22573641
6. Macciocchi SN, Diamond PT, Alves WM, Mertz T (1998) Ischemic stroke: relation of age, lesion loca-tion, and initial neurologic deficit to functional outcome. Arch Phys Med Rehabil 79: 1255–1257. PMID: 9779680
7. Shelton FN, Reding MJ (2001) Effect of lesion location on upper limb motor recovery after stroke. Stroke 32: 107–112. PMID:11136923
8. Hope TM, Seghier ML, Leff AP, Price CJ (2013) Predicting outcome and recovery after stroke with lesions extracted from MRI images. Neuroimage Clin 2: 424–433. doi:10.1016/j.nicl.2013.03.005 PMID:24179796
9. Wong AM, Sharpe JA (1999) Representation of the visual field in the human occipital cortex: a mag-netic resonance imaging and perimetric correlation. Arch Ophthalmol 117: 208–217. PMID:10037566 10. Jenkinson M, Beckmann CF, Behrens TE, Woolrich MW, Smith SM (2012) Fsl. Neuroimage 62: 782–
790. doi:10.1016/j.neuroimage.2011.09.015PMID:21979382
11. Tzourio-Mazoyer N, Landeau B, Papathanassiou D, Crivello F, Etard O, et al. (2002) Automated ana-tomical labeling of activations in SPM using a macroscopic anaana-tomical parcellation of the MNI MRI sin-gle-subject brain. Neuroimage 15: 273–289. PMID:11771995
13. Cortes C, Vapnik V (1995) Support-Vector Networks. Machine Learning 20: 273–297.
14. Zhang X, Kedar S, Lynn MJ, Newman NJ, Biousse V (2006) Natural history of homonymous hemiano-pia. Neurology 66: 901–905. PMID:16567709
15. Denes G, Semenza C, Stoppa E, Lis A (1982) Unilateral spatial neglect and recovery from hemiplegia: a follow-up study. Brain 105 (Pt 3): 543–552. PMID:7104665
16. Adams GF, Merrett JD (1961) Prognosis and survival in the aftermath of hemiplegia. Br Med J 1: 309–
314. PMID:13681380
17. Celebisoy M, Celebisoy N, Bayam E, Kose T (2011) Recovery of visual-field defects after occipital lobe infarction: a perimetric study. J Neurol Neurosurg Psychiatry 82: 695–702. doi:10.1136/jnnp.2010.
214387PMID:20935321
18. Sabel BA, Kruse R, Wolf F, Guenther T (2013) Local topographic influences on vision restoration hot spots after brain damage. Restor Neurol Neurosci 31: 787–803. doi:10.3233/RNN-139019PMID: 24212113
19. Payabvash S, Kamalian S, Fung S, Wang Y, Passanese J, et al. (2010) Predicting language improve-ment in acute stroke patients presenting with aphasia: a multivariate logistic model using location-weighted atlas-based analysis of admission CT perfusion scans. AJNR Am J Neuroradiol 31: 1661–
1668. doi:10.3174/ajnr.A2125PMID:20488905
20. Kim BJ, Kang HG, Kim HJ, Ahn SH, Kim NY, et al. (2014) Magnetic resonance imaging in acute ische-mic stroke treatment. J Stroke 16: 131–145. doi:10.5853/jos.2014.16.3.131PMID:25328872 21. Bang OY (2009) Multimodal MRI for ischemic stroke: from acute therapy to preventive strategies. J Clin
Neurol 5: 107–119. doi:10.3988/jcn.2009.5.3.107PMID:19826561
22. Marinkovic SV, Milisavljevic MM, Lolic-Draganic V, Kovacevic MS (1987) Distribution of the occipital branches of the posterior cerebral artery. Correlation with occipital lobe infarcts. Stroke 18: 728–732. PMID:3603599
23. Tiel K, Kolmel HW (1991) Patterns of Recovery from Homonymous Hemianopia Subsequent to Infarc-tion in the DistribuInfarc-tion of the Posterior Cerebral-Artery. Neuro-Ophthalmology 11: 33–39.
24. Guenther T, Mueller I, Preuss M, Kruse R, Sabel BA (2009) A treatment outcome prediction model of visual field recovery using self-organizing maps. IEEE Trans Biomed Eng 56: 572–581. doi:10.1109/
TBME.2008.2009995PMID:19068421
25. Poggel DA, Kasten E, Sabel BA (2004) Attentional cueing improves vision restoration therapy in patients with visual field defects. Neurology 63: 2069–2076. PMID:15596752
26. Sabel BA, Henrich-Noack P, Fedorov A, Gall C (2011) Vision restoration after brain and retina damage: the "residual vision activation theory". Prog Brain Res 192: 199–262. doi:
10.1016/B978-0-444-53355-5.00013-0PMID:21763527