214
DOUBLE EFFORT TEST FOR EVALUATION OF AEROBIC
CAPACITY OF DIET-INDUCED OBESE RATS
Bruna Brasil Brandão1
Lidiane Moreira de Souza1
Beatriz de Novais Oliveira Trombetta1
Carlos Marcelo Pastre1
Marcelo Papoti2
Patricia Monteiro Seraphim1
1.Department of Physiotherapy, Laboratory of Research in Physiology, State University of São Paulo, Júlio de Mesquita Filho. 2. Physical Education and Sports School of Ribeirão Preto, USP.
Mailing address:
Patrícia Monteiro Seraphim – Departamento de Fisioterapia – Laboratório GPFis, Bloco III – FCT/ UNESP.
Rua Roberto Simonsen, 305 – Centro Educacional 19060-900 Presidente Prudente, SP, Brasil.
E-mail:[email protected]
ABSTRACT
Introduction: The literature lacks studies about lactate actions and some limitations in studies in-volving healthy individuals or patients with some metabolic disorder. Objectives: This study aimed to evaluate the protocol of double effort test for obese-induced rats. Methods: Fourteen male Wistar rats were divided into two groups: Control (Con) and Obese (Obe). The control group was fed with standard chow and water ad libitum. The obese group was fed with standard chow, water ad libitum and hyperlipidic diet. Twelve weeks after the beginning of the hyperlipidic diet, insulin tolerance test, Maximal Lactate Steady State (MLSS) test and the double efforts test were performed. Results: The diet was effective to promote obesity. The obese group decreased insulin sensitivity in approximately 19% (Con = 2.156 ± 0.1187 AU vs Obe = 1.742 ± 0.1551 AU). The lactate concentration and velocity of anaerobic threshold at MLSS test were 3.780 ± 0.09 mmol/L e 18 m.min-1 in both groups. The velocity of anaerobic threshold estimated by double efforts test was 15.59±0.653 m.min-1 in Con group control animals and 16.42±0.672 m.min-1 in Obe group. The double effort test underestima-ted around 13% and 8.7% the aerobic capacity in control and obese groups respectively, however, presented significant correlation with MLSS (r = 0,88; P < 0,0075 controls / r = 0,92; P < 0,0031 obese). Conclusion: So, the double effort test can be an interesting alternative to evaluate the aerobic capacity for both healthy sedentary and obese animals.
Keywords:obesity, lactic acid, running.
INTRODUCTION
In 1808, Barzelius observed that lactic acid was produced in the musculature of deers when they were hunted1. Approximately two centuries later, the lactate metabolism has not been well-elucidated and we need further understanding about its production, accumula-tion, removal and function (Lactate + hydrogen ions) during rest and muscular contraction2,3.
Many researchers try to understand the lactate actions4-6. In 1964, Wasserman and McLlory introduced the term Anaerobic Threshold which could characterize the inflexion point of the lactacidemic cur-ve, a momenta t which the transition zone between aerobic and anaerobic metabolism is found where the concentrations of this acid are approximately at 4.0 mmol/L7. Since then, many tests have been developed to measure aerobic capacity, such as the maximal lactate steady state (MLSS), which may be defined as the highest intensity at which the lactate concentrations are kept steady in exercise of long duration, being the balance point between lactate production and removal8. The protocol which evaluates the MLSS consists in the ap-plication of many tests at different intensities with 30-minute duration performed on two distinct days. For each intensity, blood samples are collected at every five minutes of exertion9. This test is able to measure in an individual and reliable manner, the metabolic transition moment, being hence considered gold-standard for validation of other protocols of anaerobic threshold test10,11.
Besides the MLSS, other invasive tests – minimal lactate8, onset blood lactate (OBLA) obtained by the lactate 4mmol/L steady concentration12,
double effort tests13 – and non-invasive – Critical Power14 – are able to
evaluate aerobic capacity. However, due to the strong need to improve knowledge on the lactate activities and some limitations in the investiga-tions with humans, the application and validation of protocols which eva-luate aerobic capacity in experimental models using rats is increasing15,16. In 2011, Manchado-Gobatto17et al. validated the non-exhaustive double effort protocol on treadmill using sedentary Wistar rats. This test proposed by Chassain13 and adapted by Manchado-Gobatto17consists in the performance of two five-minute efforts at each intensity, separa-ted by two minutes of recovery between them, with blood collection for lactacidemic analysis at the end of the first and second efforts, cal-culating the null delta lactate with these values. We believe that since it is a test which does not lead to body exhaustion, its validation and applicability in populations which present any limitation in performing physical efforts or any chronic-degenerative disease is very relevant. The main causes for increase in weight as fat are related to environmental factors such as bad eating habit and physical inactivty18,19. Therefore, the main measures to be taken for obesity and related diseases preven-tion and/or treatment are eating reeducapreven-tion and regular practice of physical exercise20,21. Thus, the aim of the present study was to test the use and applicability of the protocol of double effort test proposed by Chassain13 and adapted by Manchado-Gobatto17 in obese rats induced by hyperlipidic diet.
METHODS
215
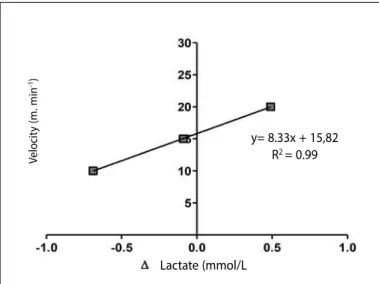
Figure 1. Example of determination of critical load by the Chassain test. The points represent the delta lactate obtained at each intensity. A linear regression was plotted and threshold velocity corresponds to the Y value (16.22 m.min-1).
light cycle initiating at 07h00min a.m.. The experimental procedures used in the present study were approved by the Ethics Committee in Animal Experimentation of UNESP – Presidente Prudente Campus, file # 74/2009.
Obesity induction
Fourteen rats were distributed in two groups with seven ani-mals – Control (Con) and Obese (Obe). The control aniani-mals were fed with standard chow (SUPRA LAB – Alisul Ind. Alimentos Ltda., São Leopoldo/RS; with composition of 25% of proteins, 3% of lipids, 18% of fibers, 11% of mineral material, 2% of calcium and 0.5% of phosphorus) and they were offered water ad libitum. The grou of
obese rats was fed hyperlipidic diet composed of bacon, bolog-na, wieners, cookies, soda and standard chow, in a proportion of approximately 2:2:2:1:1:1, respectively, in a composition of 28% of carbohydrates, 13% of proteins and 59% of lipids, from the second month of life22. The animals were weekly weighed for follow-up of the body weight evolution.
Insulin tolerance test
The test consists in the administration of regular insulin, and the glucose decrease rate was evaluated for 25 minutes. The test was performed at the end of 12 weeks of diet, before the protocols which evaluated the aerobic capacity of the rats. The animals remained six hours at water, food and diet fasting. A small section was performed on the distal extremity of the animals’ tail for blood samples collection. The first collection was performed before the intraperitoneal basal in-sulin administration. 1 U/kg of body weight of regular inin-sulin (Novolin 100U/ml) with saline solution 0.9% + BSA 0.25% was administered. The blood collections were performed at times baseline (0 minute), five, ten, 15, 20 and 25 minutes, after insulin administration. Glycemia was verified with gluco tabs and a glucometer (Biocheck TD-4225/Bioeasy Diagnóstica Ltda. /MG, Brazil). This procedure was always performed in the afternoon shift to maintain the same insulin sensitivity status of the animals, and was performed exactly the same way for all groups. Subsequently, the decrease constant was calculated (kITT expressed in %/min.) from the linear regression of the glycemia concentrations obtained during the test23.
Adaptation to treadmill
After 12 weeks of hyperlipidic diet, prior to the performance of the Maximal Lactate Steady State test and the non-exhaustive of double efforts test (Chassain), it was necessary to previously select the ‘running’ rats to compose the sample with duration of seven days. Each animal ran for five minutes per day at 10 m.min velocity-1. The animals which were able to successfully finish between nine and 10 sessions were selected. After the selection period, the running animals underwent an adaptation process to the treadmill. This process occurred during two weeks with exercise sessions, three times per week, at increasing velocities (5-15 m.min-1), and maximum duration of 15 minutes each session, being the protocol adapted by Manchado-Gobatto et al.,17. After the adaptation period, the animals performed the tests for iden-tification of the anaerobic threshold intensity.
Maximal lactate steady state (MLSS)
The rats were submitted to five continuous tests at velocities equal to ten 10, 15, 18, 22 m.min-1. Each animal performed the
four tests with 48-hour interval between them. The velocities se-quence was randomly distributed. For each velocity, the animals remained in continuous running for 25 minutes. Blood samples were extracted from the tail of the rats in six moments: baseline, five, ten 10, 15, 20 and 25 minutes of test. After the lactacidemic analysis, a plotting chart was designed, and the highest running velocity at which there was increase equal or lower than 1 mmol/L from the 10th to the 25th minute of exercise was considered as equivalent to MLSS10,24.
Chassain test
The test was composed of two efforts of five minutes of duration with passive recovery between them at velocities ten 10, 15 and 20 m.min-1. Each animal performed the test at the three intensities, randomly chosen, with 48-hour interval between them16.
The critical load was determined using the results of the Chas-sain test (figure 1).
This value was calculated for each animal which performed the test. The values c abe seen in tables 1 and 2 in the results section.
Lactacidemic analysis
The lactacidemic analysis was performed from 25 μl blood sam-ples which were collected from the distal proximity of the animal’s tail in a heparinized capillary after the first effort and after the sec-ond effort at each velocity mentioned above. These samples were immediately transferred to 1.5 ml tubes containing 50 μl of NaF solution at 1% and stored in ice for subsequent electroenzymatic reading (YSL 2700 STAT, Yellow Springs Co., USA).
Statistic analysis
Data normality was confirmed by the Shapiro-Wilk test. The ANOVA test with repeated measures was used for comparison of the body weight values. Insulin sensitivity was evaluated with the non-paired Student’s t test. The Person correlation test was used
to evaluate the correlation between the Anaerobic Threshold tests. The differences between groups were considered significant when
P value was < 0.05. The statistical package used was IBM SPSS
Sta-tistics 20.0 for Windows.
V
elocit
y (m. min
-1)
Lactate (mmol/L
y= 8.33x + 15,82
216
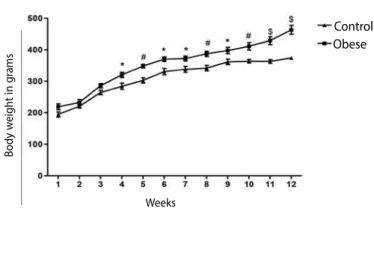
Figure 2. Body weight of the animals during 12 weeks. The data are presented as mean ± SEM. *P < 0.05 versus Control; #P < 0.01 versus Control; $P < 0.001 versus Control (n = 7).
Figure 3. Glucose decrease per minute constant (kITT). Data are presented as mean ± SEM. *P < 0.05 versus Control (n = 7).
Table 1. Delta lactate of the intensities (10, 15, 20 m.min-1), individual estimation of
criti-cal load (intercept Y) and linear e coefficient (R2) of the control animals – Chassain Test.
Animal
Δ Lactate
Threshold velocity (m.min-1)
R2 10
m.min-1 15
m.min-1 20 m.min-1
mmol/L mmol/L mmol/L
1 -0.15 0.00 0.15 15.65 0.98
2 -1.86 -0.71 0.39 18.22 0.99
3 -0.25 0.00 1.65 12.92 0.84
4 -0.48 -0.33 0.77 15.08 0.83
5 -1.87 -0.12 0.53 16.89 0.93
6 -0.30 -0.15 0.69 14.30 0.86
7 -0.68 -0.09 0.51 16.13 0.99
Mean -0.798 -0.200 0.670 15.59 0.917
SEM 0.282 0.094 0.180 0.653 0.027
Table 2. Delta lactate of the intensities (10, 15, 20 m/min-1), individual estimation of the
critical load (intercept Y) and linear coefficient (R2) of the obese animals –Chassain Test.
Animal
Δ Lactate
Threshold velocity (m.min-1)
R2 10 m.min-1 15
m.min-1 20 m.min-1
1 -0.78 -0.6 0.24 18.26 0.87
2 -0.42 -0.33 0.09 18.75 0.87
3 -0.95 -0.48 1 15.67 0.91
4 -0.27 -0.42 0.09 17.62 0.47
5 -0.95 0 0.81 15.26 0.99
6 -0.68 0.42 0.72 14.01 0.90
7 -0.38 -0.03 0.42 15.42 0.97
Mean -0.632 -0.205 0.480 16.42 0.854
SEM 0.105 0.134 0.138 0.672 0.066
k
lT
T
(%
m
in
-1
)
RESULTS
Obesity was induced by hyperlipidic diet initiated when the animals were two months old. Increase of body weight was obser-ved in the group obese from the fourth week of the diet (figure 2).
The obese group presented reduction in the insulin sensitivity of approximately 19% after 12 weeks of the diet (figure 3) and before performing the training protocol. .
The delta lactate values progressively increased according to the effort velocity increments. Statistic difference has not been observed between groups in the double efforts test. In the maxi-mal steady state test, the lactate concentration and the anaerobic threshold velocity were 3,780 ± 0.09 mmol/L and 18 m.min-1, respectively, for both groups (figure 4).
The threshold velocity estimated by the Chassain test was of 15.59 ± 0.653 m.min-1 (R = 0.917 ± 0.02) (table 1) for the animals from the control group. The threshold velocity estimated by the Chassain test was of 14.02 ± 0.565 m.min-1 (R = 0.86 ± 0.03) (table 2) for the animals from the obese group.
DISCUSSION
The use of experimental models with rats for evaluation of metabolic and physiological parameters has rapidly increased and has been extremely reliable for humans15,24. However, studies which evaluate the physical capacity of healthy animals and es-pecially animals with any metabolic disorder are still scarce. The present study evaluated aerobic capacity through the method
B
ody w
eigh
t in g
rams
Weeks
Control Obese
217
Figure 4. Bllod lactate values during the Maximal Lactate Steady State test in the times 0, 5, 10, 15, 20 and 25 minutes of test (n = 7). Data are presented as mean ± SEM. proposed by Chassain13 adapted by Manchado-Gobatto17 in thin and obese rats by hyperlipidic diet.
Half of the animals in this study were submitted to a protocol of hyperlipidic diet with the aim to make them obese. After four weeks of exposure to this hyperlipidic diet, there was significant increase in body weight of the animals from the obese group and reduction in the insulin sensitivity when compared with the animals from the control group (figures 2 and 3), which only received standard chow as food, highlighting the obesogenic effect of the diet22 and the correlation between obesity and metabolic alterations caused by fat excess25. The cytokines released by the excessive adipose tissue may generate a scenario of peripheral systemic
inflamma-tion26,27, altering the insulin signaling and initiating a possible
insulin resistant status28.
Obesity, besides altering the physiological functions28, may be considered as a limiting factor for exercise tests perfor-mance, even in animals. The majority of the protocols used for identification of effort intensity leads the animal to moments of physical exhaustion24,which reduces applicability when animals with any kind of chronic metabolic or functional alteration are considered. Thus, the double effort test presents great advantage in the evaluation of aerobic capacity of animals suffering from any pathology since it is not exhaustive.
In order to validate the proposed method, the maximal lactate steady state test (MLSS) was applied, which is considered ‘gold-standard’ for the identification of aerobic capacity17 (figure 4).
Manchado-Gobatto et al.17 validated the double effort pro-tocol on treadmill using healthy sedentary male Wistar rats. The velocity corresponding to the MLSS was of 20 m.min-1 (lactate concentration = 3.90 ± 0.03 mmol/L), with the Chassain proto-col underestimating the aerobic capacity of the animals in 20%, according to considerations from the study itself. The results of
this study (figure 4) were lower than those found by Manchado-Gobatto et al17. The intensity corresponding to the MLSS of the control group as in the obese group was of 18 m.min-1 (lactate concentration = 4.13 ± 0.139 mmol/L). The double effort test underestimated the aerobic capacity of the animals in 13% (control) and 8.7% (obese); however, significant correlation was found between the tests for the animals from the control group (r = 0.88; P < 0.0075) and obese group (r = 0.92; P < 0.0031) (tables 1 and 2). Other studies, such as the ones by Pilis et al.29 and Langfort et al.30, which evaluated the LAn using the progressive test of multistages, estimated the zone of metabolic transition through individual charts of the lactate concentrations versus velocity and found higher LAn intensi-ties (25 m.mn-1).
The differences found in the MLSS lactacidemic concentra-tions and the double effort test also suggest possible protocol-dependence as observed in the study by Manchado-Gobatto et al.17; however, the double effort test presented high correlation
with the MLSS both for the control and obese animals which presented alterations in insulin sensitivity, suggesting possible applicability in populations with any metabolic disorder.
The great limitation of this study was the fact the animals were not able to reach the 25 m.min-1 running velocity in the maximal steady state test, which caused alteration in the tests from 20 to 18 m.min-1 and from 25 to 22 m.min-1 perfor-mance velocities, being different from the ones suggested in the study by Manchado-Gobatto et al.17. Similarly, such fact caused exclusion of the 25 m.min-1 velocity used in the Chas-sain test, keeping only the 5, 10 and 20 m.min-1 velocities.
In fact, further investigation is necessary to understand the lactacidemic behavior in the different animal models and the several LAn evaluation protocols. It is also worth mentioning the importance to analyze tests models which individually evaluate LAn of the animals, since work intensity may alter the physiological responses. Thus, methods which individually estimate the aerobic capacity will present reliable results and will enable the prescription of a training protocol respective to the physical capacity of each animal.
CONCLUSION
The double effort test presented high correlation with the MLSS, indicating its possible applicability to evaluate the aero-bic capacity both of healthy sedentary animals and obese animals with harmed insulin sensitivity.
ACKNOWLEDGEMENTS
We thank professor José Carlos Silva Camargo Filho for having made the Animal Facility available in the FCT-UNESP; Bruna Bra-sil Brandão received a scholarship from CAPES-Post-Graduation Program, Master’s in Physiotherapy 2010/2011.
All authors have declared there is not any potential conflict of interests concerning this article.
Embaixo: Time (min)
Blood Lac
ta
te (mmol/L)
10 m.min-1
15 m.min-1
18 m.min-1
218
REFERENCES
1. Gladden LB. Lactate metabolism: a new paradigm for the third millennium. J Physiol 2004;558:5-30.
2. Hall G Van. Lactate kinetics in human tissues at rest and during exercise. Acta Physiol (Oxf) 2010;199:499-508.
3. Faude O, Kindermann W, Meyer T. Lactate threshold concepts: how valid are they. Sports Med 2009;39:469-90.
4. Wasserman K, Whipp BJ,Koyl SN,Beaver WL. Anaerobic threshold and respiratory gas exchange
durring exercise. J Appl Physiol 1973;35:236-45.
5. Brooks GA. Current concepts in lactate exchange. Med Sci Sports Exerc 1985;23:895-906.
6. Baron B, Noakes TD, Dekerle J, Moullan F, Robin S, Matran R, et al. Why does exercise terminate at the maximal lactate steady state intensity? Br J Sports Med 2008;42:828-33.
7. Wasserman K, Mcllory, MB. Detecting the threshold of anaerobic metabolismo in cardiac patients during exercise. Am J Cardiol 1964;14:844-52.
8. Tegtbur U, Busse MW, Braumann KM. Estimation of an individual equilibrium between lactate produc-tion and catabolism during exercise. Med Sci Sports Exerc 1993;25:620-7.
9. Manchado FB, Gobatto CA, Contarteze RVL, Papoti M, Mello MAR. Maximal lactate steady state in running rats. JEP (online) 2005;8:29-35.
10. Beneke T. Maximal lactate steady state concentration (MLSS): experimental and modelling approaches. Eur J Appl Physiol 2003;88:361-9.
11. Svedahl K, MacIntosh BR. Anaerobic Threshold: The Concept and Methods of Measurement. Can J Appl Physiol 2003;28:299-323.
12. Sjödin B, Jacobs I. Onset of blood lactate accumulation and marathon running performance. Int J Sports Med 1981;2:23-6.
13. Chassain A. Méthode d’appréciation objetive de la tolérance de l’organisme á l’effort: application á la mensure dês puissances de la frequence cardiaque et de la lactatémie. Science & Sports 1986;1:41-8.
14. Monod H, Scherer J. The work capacity of a synergic muscular group. Ergonomics 1965;8:329-38.
15. Voltarelli FA, Gobatto CA, Mello MAR. Determination of anaerobic threshold in rats using the lactate minimum test. Braz J Med Biol Res 2002;35:1-6.
16. Manchado FB, Gobatto CA, Voltarelli FA, Mello MAR. Non-exhaustive test for aerobic capacity deter-mination in swimming rats. Appl. Physiol. Nutr. Metab 2006;31:731-6.
17. Manchado-Gobatto FB, Gobatto CA, Contarteze RVL, Mello MAR. Non-exhaustive test for aerobic
capacity determination in running rats. Indian J Exp Biol 2011;49:781-5.
18. D’Archivio M, Annuzzi G, Varì R, Filesi C, Giacco R, Scazzocchio B, et al. Predominant role of obesity/ insulin resistance in oxidative stress development. Eur J Clin Invest 2012;42:70-8.
19. Pinhiero ARO, Freitas SFT, Corso ACT. Uma abordagem epidemiológica da obesidade. Rev Nutr 2004;17:534-3.
20. Kriska AM, Saremi A, Hanson RL, Bennett PH, Kobes S, Williams DE, et al. Physical Activity, Obesity, and the Incidence of Type 2 Diabetes in a High-Risk Population. Am J Epidemiol 2003;158:669-75.
21. Hopps E, Caimi G. Exercise in Obesity Management. J Sports Med Phys Fitness 2011; 51:275-82.
22. Panveloski AC, Pinto Junior DAC, Brandão BB, Moreira RJ, Machado UF, Seraphim PM. Treinamento resistido reduz a inflamação em músculo esquelético e melhora a sensibilidade à insulina periférica em ratos obesos induzidos por dieta hiperlipídica. Arq Bras Endocrinol e Metabol 2011; 55:155-63.
23. Pádua MF, Pádua TF, Souza CT, Silva ASR, Ropelle ECC, Cintra DE, et al. Exercício físico reduz a hiper-glicemia de jejum em camundongos diabéticos através da ativação da AMPK. Rev Bras Med Esporte 2009;15 179-84.
24. Gobatto CA, Mello MAR, Sibuya CY, Azevedo JRM, Santos LA, Kokubun E. Maximal lactate steady state in rats submitted to swimming exercise. Comp Biochem Physiol 2001;130A:21-7.
25. Harford KA, Reynolds CM, McGillicuddy FC, Roche HM. Fats, inflammation and insulin resistance:
insights to the role of macrophage and T-cell accumulation in adipose tissue. Proc Nutri Soc 2011;70:408-17.
26. Pedersen BK, Febbraio MA, Mooney RA. Interleukin-6 does/does not have a beneficial role in insulin sensitivity and glucose homeostasis. J Appl Physiol 2006;102:814-6.
27. Guimarães DED, Sardinha FLC, Mizuni DM, Carmo MGT. Adipocitocinas, uma nova visão do tecido adiposo. Rev Nutr Campinas 2007;20:549-59.
28. Monteiro R, Azevedo I. Chronic Inlammation in Obesity and the Metabolic Syndrome. Mediators
Inlamm. 2010;2010. doi:pii: 289645. 10.1155/2010/289645. Epub2010Jul 14. Review. 2010: 289645
29. Pilis W,zarzeczny R,Langfort J,Kaciuba-Uściłko H,Nazar K,Wojtyna J. Anaerobic threshold in
rats. Comp Biochem Physiol 1993;106 A:285-9.