The structural designs of loors formed by hollow core slabs usually consider these as simply-supported slabs. In recent years there have been project changes and hollow core slabs with continuity are widely used. The objective of this study is to suggest a way to calculate the reinforce -ment bars to be used in tests with continuity provided by a structural topping. Thus, this paper presents a method based on the maximum positive resistance moment and maximum shear strength of a hollow core slab. The method is applied to a test in hollow core slab specimens which have the following dimensions: 2 m width, 6 m long, and 21 cm high. The results indicated that the method was satisfactory to the performed test, and can therefore be applied to the other test conigurations or even designs.
Keywords: hollow core slab, continuity, reinforcing bars, topping, tests.
Os projetos estruturais de pavimentos formados por lajes alveolares usualmente as consideram como simplesmente apoiadas. Nos últimos anos têm ocorrido modiicações nos projetos, de tal forma que lajes alveolares com continuidade têm sido muito utilizadas. O objetivo deste trabalho é sugerir uma forma de se calcular a armadura negativa para ser utilizada em ensaios com continuidade obtida por meio de uma capa estrutural. Para isso, apresenta-se um método baseado no máximo momento resistente positivo e na máxima força cortante resistente de uma laje alveolar. O método é aplicado a um ensaio em lajes alveolares com as seguintes dimensões: 2 m de largura, 6 m de comprimento e 21 cm de altura. Os resultados indicaram que o método foi satisfatório para o ensaio realizado e, portanto, pode ser aplicado para outras conigurações de ensaio, ou até mesmo em projetos.
Palavras-chave: laje alveolar, continuidade, armadura negativa, capa estrutural, ensaios.
Determination of reinforcing bars for tests of hollow
core slabs with continuity
Determinação da armadura negativa para ensaios
de lajes alveolares com continuidade
A. P. SANTOS a [email protected] M. A. FERREIRA b [email protected] R. C. CARVALHO b [email protected] L. M. PINHEIRO a [email protected]
Abstract
Resumo
a University of Sao Paulo, Sao Carlos School of Engineering, Department of Structural Engineering, Sao Carlos, SP, Brazil b Federal University Federal of Sao Carlos, Department of Civil Engineering, Sao Carlos, SP, Brazil
904 IBRACON Structures and Materials Journal • 2013 • vol. 6 • nº 6
1. Introduction
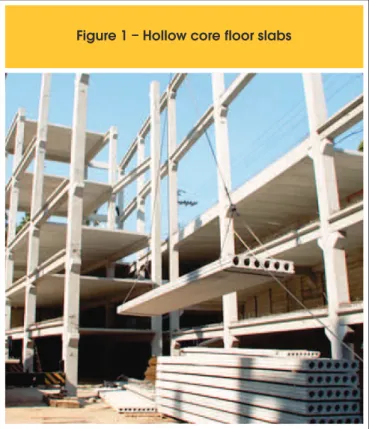
The hollow core slabs were developed in the 1950s in the Unit -ed States of America and in Europe on account of the produc-tion progress in concrete technology and also the increased use of long-line prestressed system. This type of structure is known for providing economic flooring and covering systems,
high speed assembly, small number of elements and low self-weight. It is estimated that the self-weight of a hollow core unit is about half the size of a solid section of the same height. Figure 1 shows an example of hollow core slab floors, Figure 2 presents examples of hollow core units, and Figure 3 displays a typical cross section.
Structurally, the hollow core slabs provide the efficiency of a prestressed element, reaching considerable spans with high load bearing capacity and small displacements. Moreover, if properly designed and detailed, they help to distribute the hori -zontal loads through the floor diaphragm effect.
Another important benefit of the hollow core slabs is fire re -sistance. According to PCI [3] a hollow core panel can resist up to four hours when subjected to high temperatures. This resistance depends on the height of the element and also on the cover of the reinforcement.
Usually these slabs are designed assuming simple supports. This happens because they are prestressed elements in which pretensioning is used, with the prestressed tendon placed near the bottom face. This provides the slabs high load bearing ca -pacity, large spans, and small displacements.
However, a connection between two hollow core slabs can be implemented to ensure the negative moment resistance. This is called continuity.
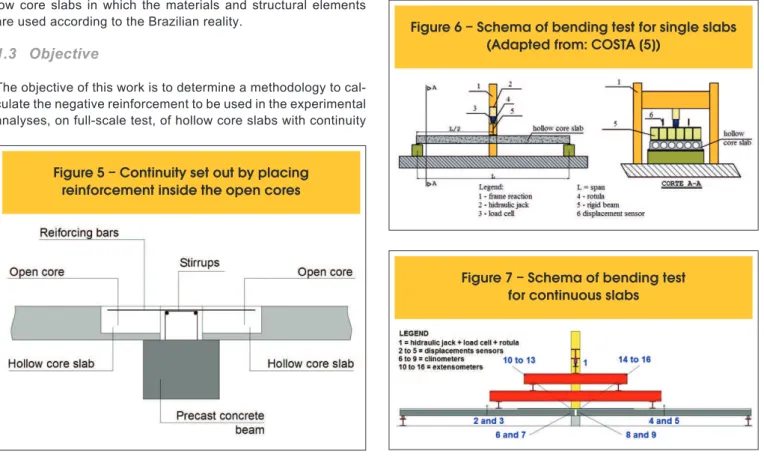
This continuity can be made by placing reinforcement bars over the supports, inside the cover (Figure 4), or in openings made in the cores (Figure 5), in the regions of negative bend -ing moment.
Figure 1 – Hollow core floor slabs
Source: http://blogdopetcivil.com/2011/08/18/lajes-alveolares/ [1])
Figure 2 – Hollow core units
Source: http://www.schokbeton.com/eng/dalles.html [2]
Figure 3 – Typical cross section of hollow core slabs
IBRACON Structures and Materials Journal • 2013 • vol. 6 • nº 6
by adding the reinforcement bars inside the topping (Figure 4). This methodology can be employed in customary design situa -tions, provided it is appropriately adapted.
1.4 Methodology
This method includes discussing the theories, present the de-ductions and use the equations necessary to obtain the nega -tive reinforcement. Furthermore, to analyze its performance in a test considering the self-weight and two concentrated loads, one for each span.
2. Advantages to promote continuity
Some technical papers on continuity demonstrate approaches to obtain beneits when performing continuity. Table 1 describes these advantages.
In the structural design of these elements, each beneit should be taken into consideration according to the aspects of the project. However, with regards to the experimental analysis, of the three advantages cited in Table 1, the most plausible situation that can be analyzed and controlled in the laboratory is the irst one. There -fore, comparative tests between the simple support situation and with continuity can be made for a single element, in other words, with the same geometry and materials, the same amount of pre -stressing bars (Ap) and the same span (ℓ).
3. Changes in the structural system
The design of a hollow core slab considering continuity
1.1 Tests of hollow core slabs
Experimental analysis of hollow core slabs have been carried out in several research centers worldwide in order to study their behavior alone or together. The main subjects studied are: shear and bending.
Bending tests can be made according to the FIP guidelines [4]. A rigid beam should be used to transfer the force to the slab, for example a steel beam. The rigid beam has the purpose to ensure a uniform load distribution over the entire width of the slab. This steel beam must have a minimum height of 15 cm, and 25 cm of height is indicated for tests using a hydraulic jack. The force is applied in the middle of the span, as shown in Figure 6. The standard test can be used to evaluate the shear strength of the slab, also suggested in the FIP guidelines [4]. The scheme of this test is similar to that presented for bending tests (Figure 6). However, the rigid beam must be positioned near one of the supports, at a distance of two and a half times the slab height. Rigid beams are also used in tests of hollow core slabs with continuity in order to simulate a transversal linear load in the center of the each slab, characterizing a bending test. Figure 7 presents a schema for continuous slabs test, with the instrumentation used in this work.
1.2 Justiication
In Brazil, many buildings made with precast concrete have their loors constructed with hollow core slabs, commonly using top -ping to solidify the slabs. In these cases the use of top reinforce -ment over the supports is common. However, this reinforce-ment is not always considered in order to take the continuity in account. Therefore, it is important to analyze continuity in loors with hol -low core slabs in which the materials and structural elements are used according to the Brazilian reality.
1.3 Objective
The objective of this work is to determine a methodology to cal -culate the negative reinforcement to be used in the experimental analyses, on full-scale test, of hollow core slabs with continuity
Figure 5 – Continuity set out by placing
reinforcement inside the open cores
F
igure 6 – Schema of bending test for single slabs
(Adapted from: COSTA [5])
906 IBRACON Structures and Materials Journal • 2013 • vol. 6 • nº 6
of continuity.
To solve that question it is necessary to set a criterion and through this obtain the reinforcement As corresponding to 100% of continuity. One possible criterion is to consider the maximum resistance positive moment of the prestressing bars (Ap) and then analyze the maximum shear resistance of hollow core slabs to be tested.
4.1 Maximum resistance positive moment
To understand the criterion of the slab’s maximum positive resist -ing moment is required to use a hypothetical bend-ing test with a must be obey the two phases described below:
n The irst one corresponds to the simply supported slab condi -tion. At this phase the self-weight of the precast slab has an effect (g1) and also the weight of the concrete cast in situ (g2), corresponding to the topping. The slab must resist the positive moment in the middle of the span. This irst phase occurs dur -ing the continuity test;
n The second phase corresponds to connection with continuity and the emergence of rigid support. In this case, the positive moment is the sum between the positive moment obtained in the irst phase and related to the second phase, in which the other dead loads (g3) and the live loads (q) act. Consequently, the maximum negative moment is that calculated for the sec -ond phase, with the dead and live loads in the most unfavor -able conditions. In the continuity test the second phase is rep -resented by the hydraulic jack and the self-weight of the steel beams used to promote the load.
4. Determination of the continuity
reinforcement bars
The design of a hollow core slab, taking into account continuity, can be made according to the model proposed by PETRUCELLI [10], adding one step that consist in calculating the continuity re -inforcement bars (As). It must also consider the change in the structural system discussed in section 3.
As mentioned earlier, these reinforcement bars can be obtained considering the full action of the theoretical negative moment, commonly denominated as elastic moment. Furthermore, As can
be calculated taking into account a fraction of this moment. However the negative bending moment depends on the value of the applied load. As this is a variable in the experimental analysis, the question is how to determine the amount of reinforcement bars (As), for the experimental analyses, corresponding to 100%
1 http://www.life-365.org/
Table 1 – Advantages of using continuity. Comparison with the simply supported condition
Advantages
References
Comments
Increased capacity to
withstand loads
Decrease the amount
of prestressing
reinforcement (A )
pIncrease in span
RESENDE and
GASTAL [6];
BARBIERI and
GASTAL [7]
PETRUCELLI and
CARVALHO [9]
TAN et al. [8]
The increased capacity to withstand loads is the first
advantage perceived. It is the main advantage mentioned
in the international codes. It was confirmed in tests
conducted by the authors. E.g.: given a hollow core slab with
geometry and materials determined, also for a certain span
and amount of prestressing bars A , this slab can withstand
pmore loads with continuity, when compared to the simple
support condition.
E.g.: given a hollow core slab with geometry and materials
determined, also for a given load and amount of prestressing
bars A , this slab can achieve a larger span with continuity,
pwhen compared to the simple support condition.
E.g.: given a hollow core slab with geometry and materials
determined, also for a given load and for a certain span, this
slab requires a smaller amount of prestressing bars A with
pcontinuity, when compared to the simple support condition.
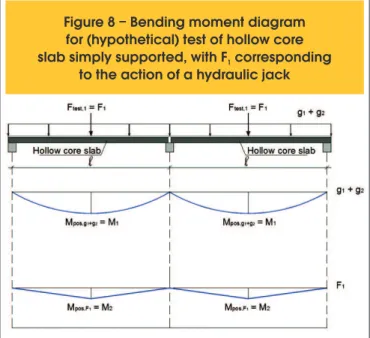
Figure 8 – Bending moment diagram
for (hypothetical) test of hollow core
slab simply supported, with F corresponding
1907 IBRACON Structures and Materials Journal • 2013 • vol. 6 • nº 6
simply supported slab. Figure 8 shows the structural scheme of this test highlighting the bending moment diagrams due to self-weight of the slab (g1) and the weight of the topping (g2) and later due to the action of the hydraulic jack (F1).
Therefore, considering a hollow core slab element with the geom -etry and materials characteristics, also prestressing bars (Ap) and span (ℓ) determined, the maximum positive moment (Mpos,tot,1) that the prestressing bars resists in simple support condition is given by the sum of the positive moments corresponding to the loads g1, g2, and F1.
(1)
Mpos,tot,1=M1+M2
Table 2 presents the equations for the hypothetical lexural test for simply supported slabs.
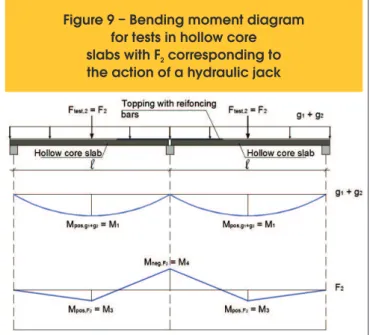
Figure 9 shows the bending moment diagram for the same slabs, assuming continuity in the intermediate support. In this Figure, F2 corresponds to the hydraulic jack in the continuity test. Thus, the total positive bending moment for this test (Mpos,tot,2) is given by equation 2.
(2)
Mpos,tot,2=M1+M3
Mpos,tot,1 can be obtained using the value of Ap. The value of M3, which corresponds to the positive moment due to the force F2 ap-plied to the middle of the slab for the test with continuity,can be obtained equating Mpos,tot,1 with Mpos,tot,2.
Once M3 is known the F2 force value can be calculated, and through this obtain the moment M4. Finally, using M4 the
rein-forcement bar, As, is calculated, in terms of 100% of continuity. After this the ratio between F1 and F2 can be determined. If F2 is
greater than F1 it proves the increasing support capacity. Table 3 shows the equations to determine As for the continuity tests. In addition to the variables already determined, Table 3 also show: n z = lever arm balance in this section with simple bending. This
value can be different, considering the balance with positive and negative moment;
n f
yk = characteristic yielding stress of reinforcement bars.
4.2 Bending moment M
4and the support condition
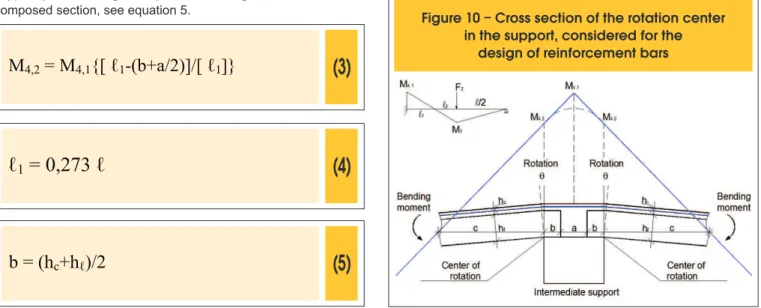
As the intermediate support consists of a connection in precast concrete, the value of As is calculated with the negative bending moment (M4) in the section in which rotation occurs. Thus the geometry of Figure 10 was used, according to the nomenclature shown below:n F
2 = concentrated load applied at the middle span for the test with continuity;
n θ = rotation in the section where the slab begins supporting on the beam (rotation section);
n M
4,1 = negative bending moment at the center of the support; n M
4,2 = negative bending moment at the center of rotation;
Table 2 – Equations for calculating of hollow core slabs simply supported
Variable
Equation
Comments
M
pos,tot,1M
1Deduced by balancing the section for simple bending.
It uses the inverse calculation using A of the hollow
pcore slab under consideration
See Figure 8
See Figure 8
See Figure 8
F
1M2
M
pos,tot,1=M
RM
1=
(g
1+g
2).l
28
M2=Mpos,tot,1-M1
M
2=
F1.l
4
⇒ F
1=
4.M2
l
908 IBRACON Structures and Materials Journal • 2013 • vol. 6 • nº 6
n M
3 = positive bending moment due to the F2;
n a = distance between the edges of the hollow core slabs; n b = support length of the hollow core slab;
n c = distance between the bending moment equal to zero and the rotation section;
n h
c = height of the cover (topping); n h
ℓ = height of the hollow core slab; n ℓ
1 = distance between the ixed support and bending moment equal to zero;
n ℓ
2 = distance between the concentrated load (F2) and the mo-ment equal to zero;
n ℓ/2 = half of the span.
Figure 10 shows the relationships established in equations 3 and 4. Moreover, as a practical rule it is used for the length of the slab support (letter b in Figure 10) half of the height of the slab, for the composed section, see equation 5.
(3)
M4,2
= M4,1{[ ℓ1-(b+a/2)]/[ ℓ1]}
(4)
ℓ
1= 0,273 ℓ
(5)
b = (h
c+h
ℓ)/2
4.3 Veriication of the shear force
The criteria suggested for establishing 100% of continuity reinforce -ment bars through the maximum mo-ment of resistance by the pre -stressing bars must be complemented by verifying the shear force. Performing a continuity test (Figure 7) it can show that the hol -low core slab reaches failure by shear force before the yielding or failure of the continuity reinforcement bar. In other words, the concentrated load corresponding to the failure can be less than that expected by the lexure analysis.
The veriication of shear force in hollow core slabs is widely re -searched. A recent study by CATOIA [11] addresses this veriica -tion in regions of lexural cracks. In Catoia’s work, several shear
Table 3 – Equations for calculating of hollow core slabs with continuity
Variable
Equation
Comments
M
pos,tot,2M
3See Equations1and 2
See Figure 9
See Figure 9
See Figures 9 and 10
See Equations 3, 4 and 5.
See Figure 10.
Area of reinforcement bars deduced by
balancing section for simple bending moment
M
4,1M
4,2A
sF
2M
pos,tot,2=M
pos,tot,1M
3=M
pos,tot,2-M
1M
3=
5.F
2.l
32
⇒ F
2=
32.M
35.l
M
4,1=
3.F
2.l
16
M
4,2=M
4,1(
l
(
(
( (
(
(
(
1
l
1- b+ a2
A
s=
M
z.f
4,2 ykFigure 10 – Cross section of the rotation center
in the support, considered for the
IBRACON Structures and Materials Journal • 2013 • vol. 6 • nº 6
force equations were studied and compared with test results. The equation of the Brazilian code ABNT NBR 6118:2007 [12] was sat -isfactory evaluated in terms of verifying shear force, especially for hollow core slabs with or without topping and concentrated load applied at 2.5 h, where h is the height of the element being tested (section with or without topping).
The shear force was veriied using the formulation of the Brazilian code ABNT NBR 6118:2007 [12] which is based on the European formulation, and which serves as a basis for its use in another Bra -zilian code, ABNT NBR 14861:2011 [13] that especially addresses the hollow core slabs. However, they are similar especially when there is no illed cores, as in this work.
According to Brazilian code ABNT NBR 6118:2007 [12], a slab can be made without transverse tension reinforcement when the equa -tion 6 is satisied.
(6)
V
Sd≤ V
Rd1= [
t
Rdk
(1,2+40
r
1)+0.15
s
cp] b
wd
n V
Sd = acting shear force of design; n V
Rd1 = resisting shear force of design; n τ
Rd = resisting shear stress of design – τRd = 0,25 fctd; n f
ctd = concrete tensile strength – fctd = fctk,inf / γc; n k = │1.6 - d│≥ 1 (d in meters);
n ρ
1 = As1 / (bw d) ≤ 0.02; n A
s1 = steel area considered in the pin effect; n b
w = slab width discounting voids corresponding to the cores; n d = depth of the slab, measured from the extreme compression
iber to the centroid of the tensioning reinforcement; n σ
cp = concrete compression stress due to the prestressing force – σcp = Nsd / Ac;
n N
Sd = longitudinal force due to prestressing; n A
c = area of the concrete cross section.
Equation 7 shows the VSd value considering the concentrated load applied to the continuity test responsible for the failure by shear (F2,Q). This equation considers that the concentrated load (F2) is applied in the middle of the span, as shown in Figure 9. If there is any change in the position of the concentrated load, equation 7 should be adapted.
(7)
V
Sd= (g
1+g
2).(ℓ/2) + (11/16) F
2,QTherefore, the force value one wants to know (F2,Q) depends on the reinforcement ratio (ρ1), in other words, F2,Q depends on the nega-tive reinforcement (As).
Therefore the As value is used to verify shear, with As obtained accord-ing to the lexural test with continuity, and then the F2,Q is calculated.
If F2 is less than F2,Q, the slab will not achieve failure by shear force. Otherwise, the continuity reinforcement will have to be calculated again, limited by the force F2,Q. This can be done by replacing, in
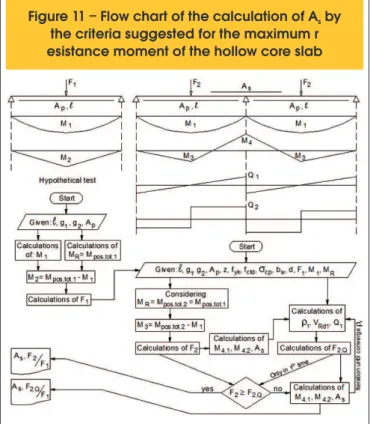
Table 3, F2 by F2,Q, again calculating M4,1 and M4,2, and inally As. Table 4 shows the summary of the equations when shear force is considered. Figure 11 presents the low chart of the calculation of
Table 4 – Equations for calculating of hollow core slabs with continuity – verification of shear force
Variable
Equation
Comments
F
2,QF ≥ F
2 2,QSee expressions 6 and 7
See Table 3
See Table 3
OK. A is equal to the value obtained in Table 3.
sThe slab does not undergo failure by shear force.
M , M and A is calculated again,
4,1 4,2 sreplacing F by F in Table 3.
2 2,QF <F
2 2,Q(g
1+g
2).l
2
+
11
16 .F
2,Q=[
τ
Rd.k(1,2+40.
ρ
1)+0,15
σ
cp].b
w.d
Figure 11 – Flow chart of the calculation of A by
s910 IBRACON Structures and Materials Journal • 2013 • vol. 6 • nº 6
As by the criteria suggested to establish 100% of continuity rein -forcement bars for the maximum resistance moment of the hollow core slab.
5. Experimental program
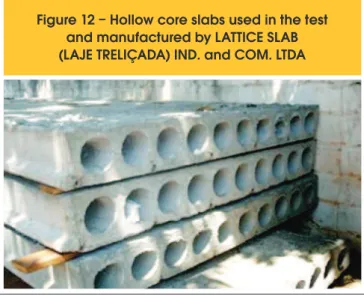
The experimental test in this paper is part of an ongoing doctoral program at the Department of Structural Engineering, Sao Car-los School of Engineering, University of Sao Paulo (SET/EESC/ USP), in Brazil. The tests are being conducted at the Study and Technology Center in Precast Concrete, Department of Civil En -gineering, Federal University of Sao Carlos (NETPRE/DECiv/ UFSCar). The hollow core slabs were donated to this research as part of the agreement between the Brazilian Association of Industrialized Concrete Construction (ABCIC) and the afore-mentioned universities. The slabs were manufactured by LAT -TICE SLAB (LAJE TRELIÇADA) IND. and COM. LTDA., head
-quartered in Cuiaba (MT), and comprise a part of the hollow core slabs (Figure 12) for the soccer stadium Arena Pantanal, in Cuiaba, Mato Grosso state, Brazil.
The experimental test in question was performed on March 7, 2012 in full-scale hollow core slabs. These slabs had the following di -mensions: width 2.00 m, length 6.00 m and height 0.21 m. Figure 13 shows a panoramic view of the test.
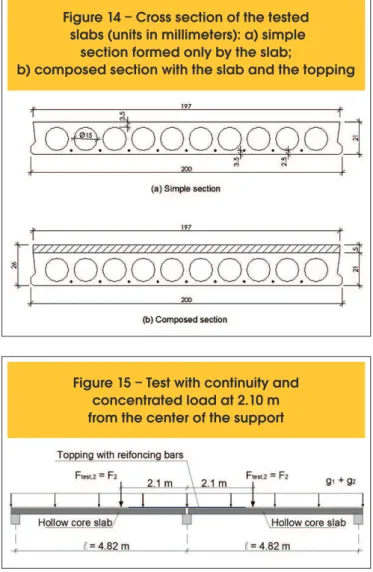
Figure 14 shows the cross section of the hollow core slab. For the concrete compressive characteristic strength (fck) and the concrete compressive strength at 24 hours (fcj,24h) 40 MPa and 21 MPa were used, respectively. For the prestressing bars, 9-wire strands of 12.7 mm diameter, steel CP 190 – RB were used. The initial prestressing force (in each strand) was 142 kN. The geometric properties are shown in Table 5, while the mate -rial properties are shown in Table 6.
Figure 12 – Hollow core slabs used in the test
and manufactured by LATTICE SLAB
(LAJE TRELIÇADA) IND. and COM. LTDA
Figure 13 – Panoramic view of the test site
Table 5 – Geometric properties
Meaning
Variables
Simple section
Composed section
Steel area of prestressing bars
Distance between the prestressing bars and
extreme bottom fiber of slab
Area of the concrete cross section
Moment of inertia
Distance between the upper fiber and the
neutral axis (LN)
Distance between the bottom fiber and the
neutral axis (LN)
Modulus of strength above neutral axis
Modulus of strength below neutral axis
Eccentricity of prestressing bars (distance
between the center of prestressing bars and
the neutral axis)
2
A (cm )
pd' (m)
2
A (m )
cI (m )
4y (m)
sy (m)
i 3W (m )
s 3W (m )
ie (m)
p8.91
0.035
0.2357
0.0013
0.1016
0.1084
0.0128
0.01199
0.0734
8.91
0.035
0.3342
0.0024
0.1143
0.1457
0.0210
0.01647
IBRACON Structures and Materials Journal • 2013 • vol. 6 • nº 6
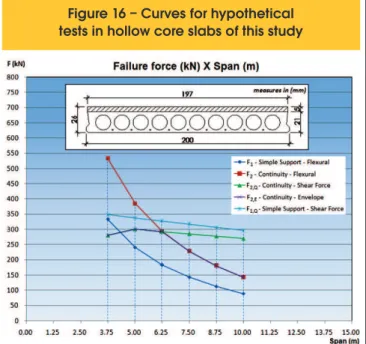
n F
1,Q – Simple supports – Shear – Concentrated loads of the hy -pothetical simple supports slabs in shear tests;
n F
2 – Continuity – Flexural – Concentrated loads corresponding to the hypothetical slabs with continuity in lexural tests; n F
2,Q – Continuity – Shear – Concentrated loads corresponding to the hypothetical slabs with continuity in shear tests;
n F
2,E – Continuity – Envelopment – Considers the most unfavor -able situation between F2 and F2,Q characterizing an envelope. This envelope can also be seen in Tables 7 and 8, emphasizing the most unfavorable situation.
6.1 Calculation of the continuity reinforcement
bars to use in the tests
The calculations to obtain the continuity reinforcement bars (As) for
the tests are presented.
Figure 15 shows the coniguration of the span (ℓ) and the posi -tion of the applied load (F2). This test used a span of 4.82 m, and the distance from the center of the model to the load applica-tion point of 2.10 m. Therefore, it should be menapplica-tioned that the internal stress was calculated in accordance with the test con -iguration. This was performed by using the conversions shown in Table 9.
Moreover, the following should be taken into account: n σ
pt,∞ = 107.67 kN/cm² (prestressing stress considering the
losses, calculated from manufacturing until the date of the test, equals to 24.18%);
n N
p = 107.67 (kN/cm²) x 8.91 (cm²) = 959.29 kN (prestressing
force acting on the section).
The results are shown in Tables 10, 11, 12 and 13. Note that as it is an experimental analysis fck was used instead of fcd. The same applies to the value of fctd, which was replaced by fctk,inf.
Since the value of F2,Q is less than that of F2, it is necessary repeat
the calculations in Table 11 using F2,Q instead of F2, and this is done in Table 13.
It is worth noting that the increasing load capacity of the slab was of 1.09 (Table 12) and not 1.82 (Table 10).
Differently from Figures 8 and 9, the concentrated load was applied at a distance of 2.10 m from the center of the model, as shown in Figure 15. The span (ℓ) of the test was 4.82 m.
6. Results
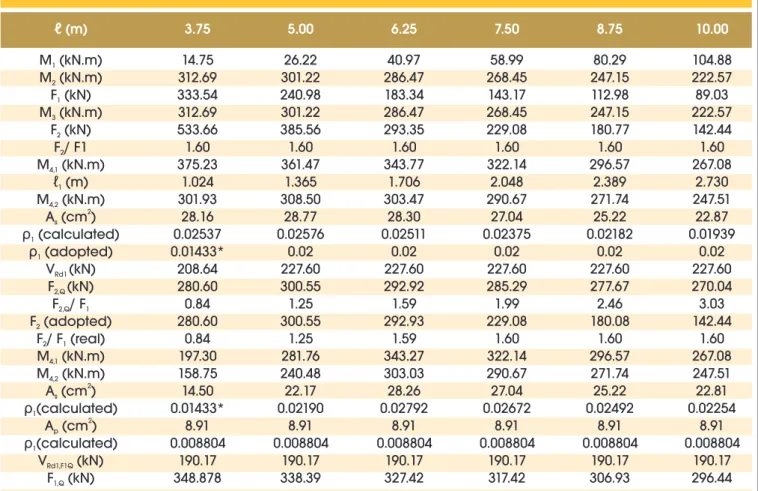
Using the methodology set out in item 4 of this paper, it is possible to draw curves simulating other tests for the slab in question. Table 7 shows the design of the continuity reinforcement bars for the followings spans (in meters): 3.75; 5.00; 6.25; 7.50; 8.75; 10.00. Table 8 shows the summary of the concentrated loads for the fail -ure, also indicating the real capacity increase of the slab to with -stand the loads, through the F2/F1 ratio and the shear force resis-tance (F1,Q) for the simple support test.
Based on Table 8 it was possible to plot the curves shown in Figure 16. This igure shows ive curves relating the concentrated load to the failure of the slab, by lexure (F1 or F2) or shear (F1,Q or F2,Q) with the spans for the hypothetical tests in Table 7.
These curves are explained below. In all cases, it is considered that the forces are positioned at the middle span of each slab.
n F
1 – Simple supports – Flexural – Concentrated loads of the hypothetical simple supports slabs in lexural tests;
Figure 14 – Cross section of the tested
slabs (units in millimeters): a) simple
section formed only by the slab;
b) composed section with the slab and the topping
Table 6 – Material properties
Material
Variables
Values
Concrete
of topping
Concrete
of slabs
Negative
reinforcement
bars
(CA-50)
Prestressing
reinforcement
bars
(CP 190 RB)
f (MPa)
ckE
ci,cml(MPa)
f (MPa)
ckE
ci,cpm(MPa)
f (MPa)
ykE (MPa)
sε
yd(‰)
f (MPa)
ptkf (MPa)
pykE (MPa)
pε
yd(‰)
30
30672
40
35418
500
210000
2.07
1900
1710
205000
8.53
912 IBRACON Structures and Materials Journal • 2013 • vol. 6 • nº 6
Table 7 – Simulation of tests for spans between 3.75 m and 10.00 m
ℓ
(m)
3.75
5.00
6.25
7.50
8.75
10.00
M (kN.m)
1M (kN.m)
2F (kN)
1M (kN.m)
3F (kN)
2F / F1
2M (kN.m)
4,1ℓ
1(m)
M (kN.m)
4,22
A (cm )
sρ
1(calculated)
ρ
1(adopted)
V (kN)
Rd1F (kN)
2,QF / F
2,Q 1F (adopted)
2F / F (real)
2 1M (kN.m)
4,1M (kN.m)
4,22
A (cm )
sρ
1(calculated)
2
A (cm )
pρ
1(calculated)
V
Rd1,F1Q(kN)
F (kN)
1,Q14.75
312.69
333.54
312.69
533.66
1.60
375.23
1.024
301.93
28.16
0.02537
0.01433*
208.64
280.60
0.84
280.60
0.84
197.30
158.75
14.50
0.01433*
8.91
0.008804
190.17
348.878
26.22
301.22
240.98
301.22
385.56
1.60
361.47
1.365
308.50
28.77
0.02576
0.02
227.60
300.55
1.25
300.55
1.25
281.76
240.48
22.17
0.02190
8.91
0.008804
190.17
338.39
40.97
286.47
183.34
286.47
293.35
1.60
343.77
1.706
303.47
28.30
0.02511
0.02
227.60
292.92
1.59
292.93
1.59
343.27
303.03
28.26
0.02792
8.91
0.008804
190.17
327.42
58.99
268.45
143.17
268.45
229.08
1.60
322.14
2.048
290.67
27.04
0.02375
0.02
227.60
285.29
1.99
229.08
1.60
322.14
290.67
27.04
0.02672
8.91
0.008804
190.17
317.42
80.29
247.15
112.98
247.15
180.77
1.60
296.57
2.389
271.74
25.22
0.02182
0.02
227.60
277.67
2.46
180.08
1.60
296.57
271.74
25.22
0.02492
8.91
0.008804
190.17
306.93
104.88
222.57
89.03
222.57
142.44
1.60
267.08
2.730
247.51
22.87
0.01939
0.02
227.60
270.04
3.03
142.44
1.60
267.08
247.51
22.81
0.02254
8.91
0.008804
190.17
296.44
* Obtained by iteration until the result of the final value ρ1 (calculated) is near the value adopted ρ1 (adopted).
Table 8 – Summary of the concentrated loads in terms of failure
ℓ
(m)
F (kN)
1F (kN)
1,QF (kN)
2F (kN)
2,QF (kN)
2,EF /F
2 13.75
5.00
6.25
7.50
8.75
10.00
333.54
240.98
183.34
143.17
112.98
89.03
348.88
338.39
327.90
317.42
306.93
296.44
533.66
385.56
293.35
229.08
180.77
142.44
280.60
300.55
292.92
285.29
277.67
270.04
280.60
300.55
292.92
229.08
180.77
142.44
0.84
1.25
1.59
1.60
1.60
1.60
F = concentrated load applied in the middle of the span in the hypothetical test of simply supported hollow core slab. 1
It occurs by flexural failure;
F = concentrated loads applied in the middle of the span in the hypothetical test of simply supported hollow core slab. 1,Q
The failure occurs by shear;
F = concentrated load applied in the middle of the span in the hypothetical test of hollow core slab with continuity. 2
It occurs by flexural failure;
F = concentrated load applied in the middle of the span in the hypothetical test of hollow cores with continuity. The failure occurs by shear;2,Q
IBRACON Structures and Materials Journal • 2013 • vol. 6 • nº 6
Thus, the continuity reinforcement bars corresponding to 100% is As = 19.56 cm², limited by the veriication of the shear force. There -fore, 17 bars of diameter 12.5 mm were used, spaced of 12 cm, totaling 20.86 cm².
The cracking moment of the topping (Mr) and the force F2 corre-sponding to this cracking are shown and calculated in Table 14.
6.2 Test results
Figure 17 shows the force-displacement curves (F2 versus δ) ob -tained from the values measured by the load cells and displace -ment transducers. The blue curve (right in Figure 17) and the red curve (left) correspond to the slabs highlighted in blue (left of Fig -ure 17) and red (right). In addition, the F2 value includes the self-weight of the rigid steel beams (equal to 10.7 kN) and the force applied by the hydraulic jack.
The maximum load obtained, also considering the self-weight val -ue of the rigid steel beams, was F2 = 272.0 kN (each slab). The cracking moment of the topping can be seen in the curves of Figure 17 for values of around F2 = 107.9 kN.
Moreover, based on Figure 17, the maximum displacements re -sulted in δ = 4.7 mm and δ = 9.5 mm, respectively, at the right (in
red, Figure 13) and left (in blue, in the same igure).
7. Conclusions
According to the results it is concluded that the method presented was able to accurately predict the behavior of the system and es -pecially the failure mode, showing to be adequate for planning con -tinuity tests in hollow core slabs subjected to concentrated loads. The following facts were observed:
n The model tested reached failure by shear force, as provided in the calculations;
n The F
2 force estimated for the cracking of the topping
(F2 = 117.59 kN, Table 14) was close to the real condition (F2 = 107.9 kN, Figure 17);
n Similarly, the F
2 force estimated for the shear failure
(F2 = 274.13 kN, Table 12) was very close to the value achieved in the test (F2 = 272.0 kN, Figure 17).
Figure 16 – Curves for hypothetical
tests in hollow core slabs of this study
Obs.: The curve “F - Continuity - Envelope” overlapped to the two 2,E curves: “F - Continuity - Shear force” (span lower than 6.25 m) and 2,Q “F - Continuity - Flexural” (span higher than 6.25 m).2
Table 9 – Relations between the internal
forces and the applied load
M
4,1M
3Q
k .F .
1 2ℓ
k = 0.192324
1k .F .
2 2ℓ
k = 0.137344
2k .F
3 2k = 0.7565
3Table 10 – Calculations to obtain the concentrated load
corresponding to the failure (F ) in the continuity test
2M
pos,tot,1M
1M
2F
1F
2M
3Calculated by balancing section for simple flexure.
It is inverse calculation using A
pof the hollow core slab.
M
pos,tot,1=327.44 kN.m
F
1=
4M
l
2=
4×303.12
4.82
=251.55 kN
M
1=
(g
1+g
2) l
28
=
(5.89+2.5) 4.82
28
=24.36 kN.m
M
2=M
pos,tot,1-M
1=327.44-24.32=303.12 kN.m
M
pos,tot,2=M
pos,tot,1M
3=M
pos,tot,2-M
1=327.44-24.32=303.12 kN.m
F
2=
k
M
3 2×
l
=
303.12
0.137344
×
4.82
=457.89 kN
F
2F
1=
914 IBRACON Structures and Materials Journal • 2013 • vol. 6 • nº 6
With regard to the curves shown in Figure 16 it is observed that the relationship between the forces corresponding to the lexural failure with continuity and the simple support slabs, F2/F1, is always equal to 1.6 (see Table 7). This relationship can be visually veriied in Figure 16. If only the lexural failure results were considered, it could be conclude for all cases that continuity increases by 1.6
times the resistance of hollow core slabs. However this conclusion is only possible for the slabs with span equal to 6.25 m or above. There is also a relationship between the forces corresponding to the failure by shear forces (F1,Q and F2,Q). This relationship is af-fected by the rate of continuity reinforcement (ρ1) adopted for each situation. However, taking into account only the results of shear
Table 11 – Calculations of continuity reinforcement bars (As) considering flexure
M
4,1M
4,2A
sM
4,1=k
1×
F
2×
l=0.192324
×
457.89
×
4.82=424.46 kN.m
b=
h
c+h
2 =
l0.05+0.21
2
=0.13 m
l
1=1.225 m
a=width of the beam-2b=0.4-2×0.13=0.14 m
M
4,2=M
4,1(
l
1-
(
b+
(
(
a
2
)
)
l
1=424.46
(
1.225-(0.13+0.07)
1.225
)
=355.16 kN.m
A
s=
M
4,2z
s.f
yk=
355.16
0.212
× 500000
=0.003351 m²=33.51 cm²
IBRACON Structures and Materials Journal • 2013 • vol. 6 • nº 6
forces, it is concluded that the shear strength decreases when con -tinuity is promotes. This fact was expected given that in the simple support condition the shear force is equivalent to the half of the force F1,Q, while in the continuity condition, the support considered absorbs more load, with this ratio equal to (11/16) F2,Q. For the cases with continuity at the two supports, the curve of F1,Q is equal
to that of F2,Q. This is because even with continuity the shear force is equivalent to half of the applied force.
The curve “F2,E – Continuity – Envelope” represents the envelope of the slab with continuity considering the failure by lexure or shear force. Analyzing the two effects simultaneously (lexural or shear) it is concluded that the failure mode would be by shear force for the followings spans ℓ = 3.75 m; ℓ = 5.00 m and ℓ = 6.25 m. For the irst case (ℓ = 3.75 m) there is no load resistance increase in the slabs, that is, the failure force value for the lexure tests with continuity
(F2) is lower than the failure force value of the simple support tests (F1). For the last cases (ℓ = 7.50 m; ℓ = 8.75 m and ℓ = 10.00 m), the failure occurs by lexure.
When analyzing the eficiency of continuity (F2/F1, last column of Table 8), the slabs that performed better were those limited by lexural failure. Furthermore, Figure 16 shows the eficiency of the continuity condition by the distance between the curve F2,E and those below this: the curve F2,Q for the span of 3.75 m (ineficient) and the curve F1 for the other slabs.
As the focus of this study is not to analyze the cases with illing cores, this is not depicted in Figure 16. However, when this fact is taken into consideration, the tendency is that the shear force values increase. In other words, in Figure 16, the curve F2,Q would move upward, further improving the continuity eficiency (F2/F1) in the irst envelope section.
Table 12 – Verifying shear force and obtaining the force F
2,QV
Rd1F
2,QIncreased slab capacity to withstand concentrated loads
τ
Rd=0.25
×
f
ctdor 0.25
×
f
ctk=0.25
×
f
ctk,inf=0.25
×
2456 =614.00 kN/m²
k=| 1.6-d| =1.6-0.225=1.375
ρ
1=
b
A
s w*d =
33.51
44 *23.0=0.0331 =0.02
Þ
ρ
1=0.02
N
sk,pt,¥=
σ
pt,¥×
A
p=107.665
×
8.91=959.30 kN
σ
cp=
N
sk,pt,A
¥c
=
959.30
0.2357=4070.00 kN/m
2V
Rd 1
= [
τ
Rd
k
(
1.2 + 40
ρ
1
(
+ 0.15
σ
cp
[
b
w
d
V
Rd1=[614
×
1.375 (1.2+40
×
0.02)+0.15
×
4070.00]
×
0.44
×
0.225
V
Rd 1= [1688.5 + 610.50] × 0.44 × 0.225 = 227.60 kN
(g
1+g
2) l
2
+k
3F
2,Q=V
Rd1(5.89+2.5)
×
4.82
2
+0.7565
×
F
2,Q=227.60
F
2.Q=(227.60-20.22)
0.7565=274.13 kN
1
F
2,QF
1=
274.13
916 IBRACON Structures and Materials Journal • 2013 • vol. 6 • nº 6
Table 13 – Calculation of the continuity reinforcement bars (As) for flexural, limited by verification of shear force
M
4,1M
4,2A
sVerification of
ρ
1
M
4,1=k
1×
F
2×
l=0.192324
×
274.13
×
4.82=254.12 kN.m
b=
h
c+h
2 =
l0.05+0.21
2
=0.13 m
l
1=1.225 m,
a=width of the beam-2
×
b=0.4-2
×
0.13=0.14 m
M
4,2=M
4,1(
l
1-
(
b+
(
a
2
)
)
l
1)
=254.12
(
1.225-(0.13+0.07)
1.225
)
=212.63 kN.m
A
s=
M
z f
4,2yk
=
212.63
0.217
×
500000 =0.001956 m
²
=19.56 cm
²
ρ
1=
b
A
sw
d =
19.56
44
×
23 ≌0.02
Þ
ρ
1=0.02
Therefore, the iterative calculation for the reinforcement ratio, besides adequately working, was limited to the value of 0.02.
Table 14 – Calculation of the cracking moment (M ) and its corresponding force (F )
r 2Section
Equation
M
r=
a
f
y
ctI
C tM
r=
1.5 × 2896 × 0.0024
0.1143
M
r= 91.21 kN. m
M
r=M
4,2Þ
M
4,1=M
4,2×
1.225
1.025 =91.21×
1.225
1.025
M
4,1= 109.01 kN. m
M
4,1= k
1F
2l
= 0.192324 × F
2× 4.82
109.01=0.192324×F
2×4.82
F
2=117.59 kN
917 IBRACON Structures and Materials Journal • 2013 • vol. 6 • nº 6
The case in which the simple support condition exhibited a failure force greater than that for the continuity condition (span = 3.75 m) in -dicates that continuity is not favorable for this span. However, it is pos -sible that the continuity condition is the solution implemented in the project, even with a decrease in eficiency (F2/F1), in terms of control-ling displacements or vibration, for verifying serviceability limit states.
8. Acknowledgements
To CAPES – Coordination for the Improvement of Higher Education Personnel (Coordenação de Aperfeiçoamento de Pessoal de Nível Superior) – for the doctoral scholarship granted to the irst author. To Brazilian Association of Industrialized Concrete Construction (AB -CIC – Associação Brasileira da Construção Industrializada de Concre -to) – and the company LATTICE SLAB (LAJE TRELIÇADA) IND. and COM. LTDA. for providing the hollow core slabs units used in this work. To the friends who collaborated with the experimental test: Thom -az Mendes Lopes V-az, Bruna Catoia and Fernando Menezes de Almeida Filho.
9. References
[01] PET CIVIL – UFJF. Electronic publishing. Available in: <http://blogdopetcivil.com/2011/08/18/lajes-alveolares/>. Accessed on May 2011.
[02] SCHOKBETON INC. Quebec, Canada. Electronic publishing. Available in: <http://www.schokbeton.com/ eng/dalles.html>. Accessed on May 2011.
[03] PRECAST/PRESTRESSED CONCRETE INSTITUTE.PCI. Manual for the design of hollow core slabs. 2.ed. Chicago, IL, USA, 1998.
[04] FÉDÉRATION INTERNATIONALE DE LA PRÉCONTRAINTE (FIP). Planning and design handbook on precast building structures. London, England, 1994.
[05] COSTA, O. O. Avaliação de desempenho de elementos de lajes alveolares protendidas pré-fabricadas. 2009. 132p. Dissertation (Master in Civil Construction) – Department of Civil Engineering, Federal University of Sao Carlos, Sao Carlos, SP, Brazil, 2009.
[06] RESENDE, R. S.; GASTAL, F. P. S. L. Análise numérico-experimental de lajes pré-moldadas protendidas com continuidade posterior por adição de sobrecamada de concreto armado. In: Congresso Brasileiro do Concreto, 41 – IBRACON. Salvador. Sept-Oct. 1999.
[07] BARBIERI, R. A.; GASTAL, F. P. S. L. Análise numérico-experimental de elementos pré-moldados protendidos com continuidade posterior por adição de armadura. In: Congresso Brasileiro do Concreto, 41 – IBRACON. Salvador. Set-Oct. 1999.
[08] TAN, K.; ZHENG, L.; PARAMASIVAM, P. Designing hollow core slabs for continuity. PCI Journal. Precast/ Prestressed Concrete Institute, Chicago, IL, USA. v.41, n.1, p.82-91, Jan-Feb. 1996.
[09] PETRUCELLI, N. S.; CARVALHO, R. C. O uso de continuidade em pavimentos com lajes alveolares protendidas. In: Congresso Brasileiro do Concreto, 52 – IBRACON. Fortaleza. Oct. 2010.
[10] PETRUCELLI, N. S. Considerações sobre projeto e fabricação de lajes alveolares protendidas. 2009. 103p. Dissertation (Master in Civil Construction) – Department of Civil Engineering, Federal University of Sao Carlos, Sao Carlos, SP, Brazil, 2009.
[11] CATOIA, B. Lajes alveolares protendidas: cisalhamento em região issurada por lexão. 2011. Thesis (Doctoral in Structural Engineering) – Scholl of Engineering of Sao Carlos, University of Sao Paulo, Sao Carlos, 2011. [12] ASSOCIAÇÃO BRASILEIRA DE NORMAS TÉCNICAS. NBR 6118: Projeto de estruturas de concreto.Rio de Janeiro, 2003.