Nuclear energy over a
30-year scenario
Introduction
A
n analysis of the future of nuclear energy over a 30-year time frame must comprise at least the following aspects: electricity demand and the comparative environmental, technological and strategic costs (including national reserves and non-proliferation).The comprehensive nature of these aspects requires a concise treatment and referral to previous works, as it is done here.
Electricity Demand
In Brazil, within our time frame, the justifiable peaceful application of a nuclear program is the generation of electrical energy. The share of nuclear-generated electricity depends on the country’s energy requirements, which, in turn, are a function of economic growth and the available alternatives.
The ill-conceived estimates of economic growth were the weak link in energy planning from the 1970’s to the 1990’s. Successive overestimates of economic growth and of the corresponding demand for electrical energy led to a general disbelief regarding the threat of shortages in the supply of electricity. This was one of the causes of the laxness of energy plans, which caused the undersupply that led to the extensive blackout of 2001.
These difficulties motivated the members of the OSCIP e&e team (Public Interest Civil Social Organization – Economy & Energy) to study the restraints on Brazilian growth and identify the chief limitation: the reduction of capital productivity in the 1970’s and 1980’s that curbed the country’s future growth. These difficulties have only increased since 1994 due to the high interest rates applied to control inflation. The result was a decrease in the rate of internal savings that was not offset by the entry of foreign savings, as was expected. The net result of the loss of capital productivity was a plummeting investment rate and the inability to generate the desired economic growth.
Energy planning, practically abandoned in the 1990’s, was resumed in President Lula’s first mandate with basic premises of growth below what the government desired. The 2030 Plan assumed that the GDP would grow by 4% per year (2005-2025), or the equivalent of 3.2% GDP growth per capita.
C
ARLOSF
EUA
LVIM,F
RIDAE
IDELMAN,
We will examine here three assessments of electricity demand, all of them with basically coincidental GDP projections: e&e (Alvim et al, 2007), EPE (Empresa de Pesquisa Energética) in “National 2020 Plan: Supply Expansion Strategy”, and the results of the “Agenda Elétrica Brasileira” published under the auspices of WWF-Brasil (Worldwide Fund for Nature) – Sustainable Electricity Agenda 2020.
Our methodology and the results we obtained are described below.
Methodology and comparison of results
The methodology used by e&e to project energy requirement is analogous to the one that, quite successfully, has been predicting Brazilian growth over the last ten years. Its general traits are:
1 Studying energy and economic variables (and their relationship) with stable and predictable behavior over their time frame,
determining the best arrangement to describe the future by means of curves that usually stabilize at their maximum value.
2 Using data from more developed countries and from Brazilian hydraulic potential to choose the reference and saturation values, whenever applicable.
3 Seeking of best adjustment between the country’s historical data and the adopted reference value.
It should be noted that simply applying the best adjustment in (1) would generate deterministic values. However, the aim of this methodology and of the corresponding computer program is, on the contrary, to achieve consensus regarding the more probable scenario without the rigidity of pre-established relationships. The GDP used in the projections comes from applying the projetar_e semi-empirical macroeconomic model, the results of which are automatically reflected in the demand of energy.
The GDP is then correlated with the demand for equivalent energy, whereby the energy efficiency in each sector is used to determine the
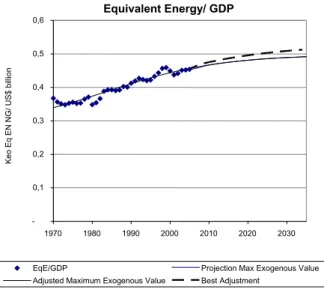
equivalence with a reference fuel of choice. The energy projection is based on the equivalent energy/GDP ratio, which has shown predictable behavior over the 35 years for which there are data available in the Balanço Energético e das Contas Nacionais (Energy Balance and National Accounts).a As shown in
Figure 1, this ratio has slowly increased over the years, but reveals a tendency to saturate over time.
experience. As a result, the values established by the consensus groups usually do not diverge much from the historical trend.
Figure 1. Illustration of the methodology used to project demand in
equivalent energy as a function of GDP (in 2003 US dollars), both under the best adjustment hypothesis and by imposing the limit of (countries with) less energy-intensive countries (Western European countries and Japan).
Figure 2. Share of electric energy in equivalent energy. Equivalent Energy/ GDP
-0,1 0,2 0,3 0,4 0,5 0,6
1970 1980 1990 2000 2010 2020 2030
EqE/GDP Projection Max Exogenous Value Adjusted Maximum Exogenous Value Best Adjustment
Ke
o
Eq
E
N
N
G
/
U
S$
b
ill
io
n
Electric/Total Energy (in Equivalent Energy)
0% 5% 10% 15% 20% 25% 30% 35% 40%
1970 1980 1990 2000 2010 2020 2030
Eel/ Eeq Adjustment Projection
El
e
ct
ri
ci
ty’
s
Sh
a
re
in
Eq
u
iva
le
n
t
En
e
rg
The program then projects the share of electric energy in the total (expressed in equivalent energy). The result is shown in Figure 2.
One inconvenience of working only with the best adjustment is that circumstances (such as the 2001 blackout) can alter the short-, and sometimes middle-range trends, and change the best adjustment by introducing new years in the series. Figure 2 shows a case in which, after a moment of transition around 2000, the behavior of the curve almost returned to the previous value.
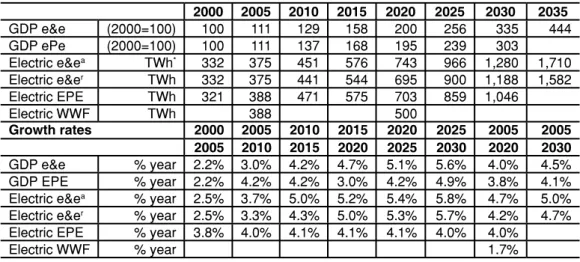
If we adopt the GDP growth hypothesis previously mentioned, this methodology results in the e&e projections shown in Table 1, which also includes the results from EPE and WWF, and a revision of the e&e study that assumes the electric energy/GDP ratio will evolve consistently with the conservation of energy hypotheses adopted by EPE.
Table 1. Comparison of results: e&e (original and revised), EPE and W WF.
2000 2005 2010 2015 2020 2025 2030 2035
GDP e&e (2000=100) 100 111 129 158 200 256 335 444 GDP ePe (2000=100) 100 111 137 168 195 239 303
Electric e&ea TWh* 332 375 451 576 743 966 1,280 1,710
Electric e&er TWh 332 375 441 544 695 900 1,188 1,582
Electric EPE TWh 321 388 471 575 703 859 1,046
Electric WWF TWh 388 500
Growth rates 2000 2005 2010 2015 2020 2025 2005 2005
2005 2010 2015 2020 2025 2030 2020 2030
GDP e&e % year 2.2% 3.0% 4.2% 4.7% 5.1% 5.6% 4.0% 4.5% GDP EPE % year 2.2% 4.2% 4.2% 3.0% 4.2% 4.9% 3.8% 4.1% Electric e&ea % year 2.5% 3.7% 5.0% 5.2% 5.4% 5.8% 4.7% 5.0%
Electric e&er % year 2.5% 3.3% 4.3% 5.0% 5.3% 5.7% 4.2% 4.7%
Electric EPE % year 3.8% 4.0% 4.1% 4.1% 4.1% 4.0% 4.0%
Electric WWF % year 1.7%
e&ea = original values; e&er = revised values; * TWh = terawatts/hour
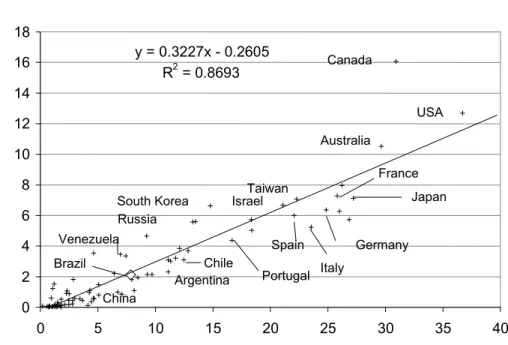
A supplementary way to test the consistency of projections is to study the energy intensity per GDP unit as a ratio of GDP per capita in Purchasing Power Parity (PPP). The United States’ EIA/DOE (Energy Information Administration/Department of Energy) Web site contains data on energy intensity for the consumption of primary and electric energy for practically every country or geographical unit. The adjustment comprises the approximately 200 countries and geographical units
registered at the United Nations and shows strong correlation. When the whole is limited to countries with population over 10 million, the adjustment is improved, as can be seen in Figure 3. The slope of the line of adjustment remains practically the same.
of the energy x GDP curve. However, by representing several countries, it is possible to compare data from countries in different stages of economic growth and take into account the economic growth of each one.
Figure 3. Electric energy/GDP for countries with population over 10 million. (Some countries indicated.)
With the variation of the GDP/inhabitant ratio, the behavior of the energy/inhabitant ratio can also be observed for individual countries or groups of countries. There were no significant variations for groups of countries between 1990 and 2004. The dynamic behavior of the two variables of intensity surveyed (electricity per GDP and per inhabitant) can be drawn on a graph, where the projected data are also represented.b
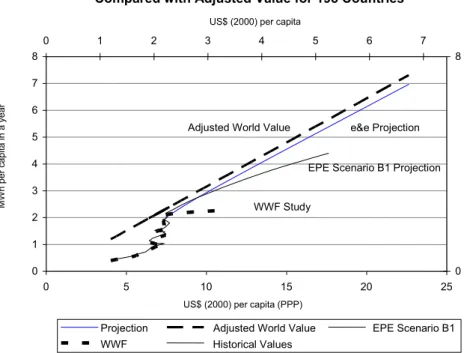
Extrapolated for Brazil, the numbers would continue below the world trend for 2004 (which coincides with that of 1990).c Figure 4 shows two GDP
scales: actual (in 2000 dollars) and in purchasing power parityd.
Figure 5 shows the ratio of electricity consumption/GDP (PPP) per GDP/inhabitant according to the projections of E&E, EPE and WWF.
The results of the survey sponsored by WWF, which included the participation of many respected entities involved in energy conservation or alternative energies, are incongruous with of those of the other two studies, and there was some public controversy between its authors and those of the EPE survey.
Electricity and GDP (PPP) per capita in 2004
y = 0.3227x - 0.2605 R2 = 0.8693
0 2 4 6 8 10 12 14 16 18
0 5 10 15 20 25 30 35 40
Thousands US$ (2000) per capita (PPP) USA
Japan
Spain
Canada
France
Germany
Italy Argentina
Chile South Korea
Portugal Russia
China Venezuela
Australia
Taiwan
Brazil
Israel
MW
h
p
e
r
ca
p
it
Electricity Consumption and GDP (PPP) per capita in Brazil Compared with Adjusted Value for 198 Countries
0 1 2 3 4 5 6 7 8
0 5 10 15 20 25
US$ (2000) per capita (PPP)
0 8
0 1 2 3 4 5 6 7
US$ (2000) per capita
Projection Adjusted World Value EPE Scenario B1 WWF Historical Values
Adjusted World Value e&e Projection
EPE Scenario B1 Projection
WWF Study MW h p e r ca p it a in a ye a r
Electricity Consumption and GDP (PPP) per capita in Brazil Compared with Adjusted Value for 198 Countries
0 1 2 3 4 5 6 7 8
0 5 10 15 20 25
US$ (2000) per capita (PPP)
0 8
0 1 2 3 4 5 6 7
US$(2000) per capita
Electricity per capita e&e Projection Adjusted World Value
Adjusted World Value
e&e Projection MW h p e r ca p it a in a ye a r
Figure 4. Evolution of the electric energy/inhabitant and GDP/inhabitant ratios according to the e&e projections. The numbers corresponding to the real GDP in 2000 dollars are only approximations.
It should be noted that the time frame of each projection is different: e&e’s is 2035, EPE’s is 2030 and WWF’s is 2020. The e&e’s projection begins below the current world standard and gradually departs from it; EPE’s departs somewhat more from this standard, while WWF’s completely diverges from it, assuming strong GDP/inhabitant growth while maintaining per capita consumption of electricity almost constant.
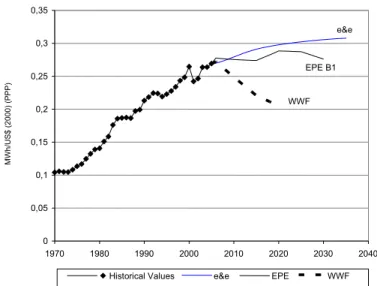
Figure 6 is interesting, as it compares the behavior of the variable electricity consumption/GDP projected by the aforementioned studies.
This comparison reveals that EPE’s projection essentially maintains the ratio electricity/GDP of the last years of the series, whereas e&e’s admits the continuation of a moderate increase in the intensity of electricity usage and a tendency toward saturation after 2035. WWF’s value for 2020 is 14% lower than the same value in the 2001 blackout.
Figure 6: Electricity consumption/GDP in the three studies.
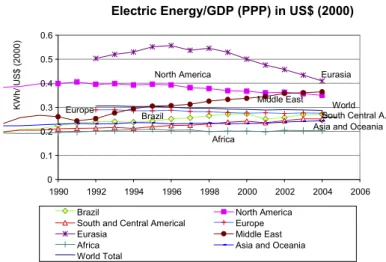
It should be noted that, over the last 40 years, Brazil has become accustomed to admitting that electricity consumption would grow more than the GDP. The most likely trajectory for this ratio is to tend towards becoming a constant value in the period under consideration.e The current
world trend is a very slow decrease of this ratio, as can be seen in Figure 7, which uses data from EIA/DOE to show the evolution of electrical intensity in the economies of various regions of the world.
Figure 7 shows a slow convergence of the various regions toward the same average value. Electricity intensity in North America and Eurasia is falling, while in South and Central America (including Brazil) it is increasing. The Middle East has exceeded the world average and does not conform to the expected convergence. Africa, Asia and Oceania
Electricity Consumption/GDP in PPP US$ (2000)
0 0,05 0,1 0,15 0,2 0,25 0,3 0,35
1970 1980 1990 2000 2010 2020 2030 2040
Historical Values e&e EPE WWF EPE B1
e&e
WWF
MW
h
/U
S
$
(2
0
0
0
)
(P
have maintained their intensity, while Europe’s fell slightly, following the world average. This behavior reinforces the hypothesis that energy intensity tends to remain approximately constant over the next years.f
It must also be noted that worldwide solutions for the scarcity of liquid fuels rely basically on electric energy. This could refuel demand for electricity.
Assuming economic growth of 4% a year, the demand for electrical energy in 2035 should be between 1,600 and 1,700 TWh (terawatt/hour): it is upon this demand outlook that we will analyze the role of nuclear energy.
Comparative costs of electric energy generation Several studies of comparative costs were carried out around the world after the recent oil crisis and in view of the greenhouse effect. (Arguably,) The most significant is possibly the International Energy Agency’s (IEA) Projected Costs of Generating Electricity – 2005 Update. The methodology employed in our assessment is a simplification of the one adopted in that study that enables us to easily evaluate changes in costs.
In conventional thermal power plants, fuel is the main cost
component in generating electricity, whereas in nuclear plants most costs are fixed. But when we consider expanding production (or replacing deactivated plants), the comparative costs of production in the plants to be built are of greater interest. IEA’s study considered actual plants that were recently built.
Electric Energy/GDP (PPP) in US$ (2000)
0 0.1 0.2 0.3 0.4 0.5 0.6
1990 1992 1994 1996 1998 2000 2002 2004 2006
Brazil North America
South and Central Americal Europe
Eurasia Middle East
Africa Asia and Oceania
World Total
Eurasia
Middle East North America
South Central A.
Africa
World Europe
Brazil
Asia and Oceania
KW
h
/
U
S
$
(2
0
0
0
)
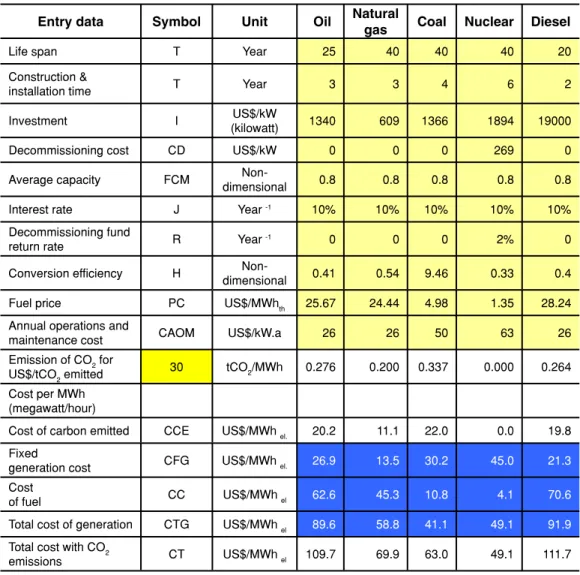
To the assayed results (of typical power plants) were added the corresponding costs of CO2 emissions (which are still not taken into account commercially in the United States, as the country has not ratified the Kyoto protocol). Several measures to capture carbon emissions are being studied in the United States and, undoubtedly, this will become an important parameter in choosing fuels for generating electricity over the next years. Current estimates of the costs to capture CO2 emissions are higher than the cost of coal, US$ 100 per metric ton. The value of US$ 30 per metric ton of CO2 is used merely as an illustration: it corresponds to the assessed cost for purchasing carbon credits in the terms of said Protocol and is the minimum amount currently under consideration. Table 2 shows the comparative costs for the various sources of electricity generation.
Table 2. Comparative costs of electricity generation in the United States.
Entry data Symbol Unit Oil Natural
gas Coal Nuclear Diesel
Life span T Year 25 40 40 40 20
Construction &
installation time T Year 3 3 4 6 2
Investment I US$/kW
(kilowatt) 1340 609 1366 1894 19000
Decommissioning cost CD US$/kW 0 0 0 269 0
Average capacity FCM
Non-dimensional 0.8 0.8 0.8 0.8 0.8
Interest rate J Year -1 10% 10% 10% 10% 10%
Decommissioning fund
return rate R Year -1 0 0 0 2% 0
Conversion efficiency H
Non-dimensional 0.41 0.54 9.46 0.33 0.4
Fuel price PC US$/MWhth 25.67 24.44 4.98 1.35 28.24
Annual operations and
maintenance cost CAOM US$/kW.a 26 26 50 63 26
Emission of CO2 for
US$/tCO2 emitted 30 tCO2/MWh 0.276 0.200 0.337 0.000 0.264
Cost per MWh (megawatt/hour)
Cost of carbon emitted CCE US$/MWhel. 20.2 11.1 22.0 0.0 19.8
Fixed
generation cost CFG US$/MWhel. 26.9 13.5 30.2 45.0 21.3
Cost
of fuel CC US$/MWhel 62.6 45.3 10.8 4.1 70.6
Total cost of generation CTG US$/MWhel 89.6 58.8 41.1 49.1 91.9
Total cost with CO2
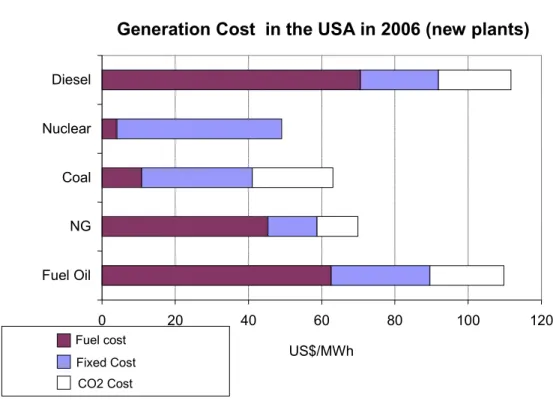
The results are also shown in Figure 8, where fixed costs (including operational and maintenance costs) can be compared to fuel costs. The above mentioned cost of CO2 emissions is also represented.
According to the premises of this comparison, the cost of nuclear generation is competitive with the cost of generation from oil and natural gas, even if coal-generated electricity (predominant in the US) remains cheaper than nuclear. But the nuclear option becomes economically competitive when we take into account even modest costs to suppress CO2 emission. The cost analysis shown here can be taken as an approximation of the current European situation. It should be noted that the deactivation of most coal-based power plants in Western Europe was due to other
environmental reasons that preceded concern about greenhouse effects – and, in countries such as the UK, it was also due to labor issues.
Figure 8. Comparative costs of generating electricity in new power plants and current fuel prices in the US (2005).
A similar analysis is being undertaken for Brazil, with the peculiarity that most of the country’s electricity comes from hydroelectric plants. Thermal plants that are built will necessarily have a regulating role, seeing that the reservoirs that supply the hydroelectric system are slowly dwindling (Alvim et al, 2005). Different average capacity factors are expected for thermal plants; in 2005, for instance, the capacity factor of conventional
Generation Cost in the USA in 2006 (new plants)
0 20 40 60 80 100 120
Fuel Oil NG Coal Nuclear Diesel
US$/MWh Fuel cost
thermal plants was 31%; if we exclude plants from the isolated system, the capacity factor was only 21%.
Nuclear and coal plants should be aimed at complementing the thermal plants with the larger capacity factor, because they are plants with predominantly fixed costs. Other plants will complement the Brazilian generation grid with lower capacity factor. Brazil has considerable potential for generating electricity from biomass, particularly sugarcane bagasse. This energy source is available during the dry season, when there is a water deficit in plants with no adequate reservoir.
In a preliminary analysis, hydroelectric energy is still advantageous in terms of generation costs. However, environmental deadlocks prevent this potential from being fully utilized. On the other hand, future demand will be concentrated in the southeast and northeast of the country, where the hydroelectric potential (if it were fully exploited) would soon be exhausted.
The largest power plants are being planned for the Amazon region, where environmental difficulties are even greater. But it seems probable that, because of its economic advantages, considerable hydroelectric generation capacity will be installed in that region. The plants of Belo Monte and Rio Madeira were included in the PAC – Growth Acceleration Plan. In order to make the projects acceptable to society, the flooded areas (and the reservoirs) were considerably reduced in both projects. In the case of Rio Madeira, there was the additional need to prevent the reservoir from overflowing into Bolivian territory, which would considerably increase the complexity of the undertaking.
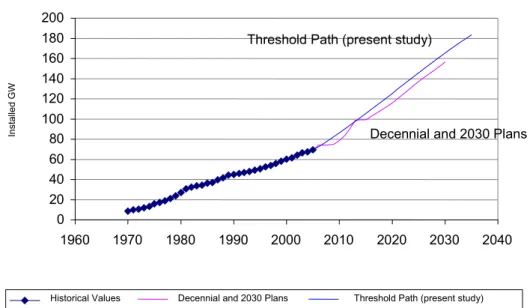
That is, even if the estimated generation costs are lower, the
environmental and financial uncertainties do not allow us to expect installed hydroelectric capacity to be more than 180 GW (gigawatts) in 2035, out of an estimated total of 260 GW. That is the threshold of our upper estimate, including the projections of the 2030 Plan, as shown in Figure 9.
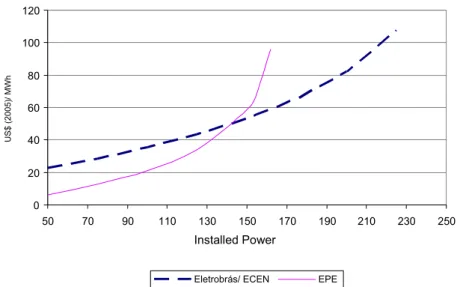
The threshold does not take into account the evolution of the cost of generating energy. Figure 10 shows two estimates of the evolution of the cost per MWh from Brazilian hydroelectric power plants – which, although quite different, coincide at the economic threshold of approximately 150 GW of installed capacity, where the cost of hydroelectric energy would exceed US$ 55 /MWh.
approximately 170 GW; if we assume that 30% of this potential is nuclear, this would correspond to a capability of 52 GW, or approximately forty Angra 3-type reactors.
In the official planning (2030 Plan), nuclear generation capability will reach 7.2 GW in 2030, comprising four additional 1 GW units besides Angra 3. If we extrapolate the 2030 Plan for another five years, we reach a total of 10 GW generated by nuclear plants in 2035.
The main problem in the 2030 Plan seems to be related to the
demand of natural gas, which would reach 26 billion m3 per year in that year,
corresponding to approximately 6% of current Brazilian reserves (including inferred reserves). Since the generation of electricity is only one of the uses of natural gas (approximately 20% both in the US and in Brazil), consumption of natural gas in 2030 would correspond to almost 30% of current reserves in only one year. Brazil holds only 0.2% of the known world reserves of natural gas and only 0.9% of oil reserves (BP Statistical Review of World Energy, June 2005). In other words, the option of producing electricity from natural gas implies importing gas from neighboring countries (South and Central America hold 8.5% of the world reserves). This problem will be discussed below in the strategic analysis.
In Brazil, the cost of generating electricity from natural gas is lower than from nuclear sources. In 2005, the average price of natural gas per
Installed Hydro Power
0 20 40 60 80 100 120 140 160 180 200
1960 1970 1980 1990 2000 2010 2020 2030 2040
Historical Values Decennial and 2030 Plans Threshold Path (present study)
Decennial and 2030 Plans Threshold Path (present study)
In
st
a
lle
d
G
W
Figure 9. Installed hydroelectric power in the reference scenarios of the 2025 and 2030 plans, and the threshold considered
ton of oil equivalent was half that of oil (BEN/MME – Balanço Energético Nacional/ Ministério de Minas e Energia, 2006). One would expect it to cost somewhat more than fuel oil, considering the superior characteristics (including environmental ones) of natural gas.
From an analysis of nuclear generation costs in the US, we can infer that nuclear sources tend to be competitive with natural gas if oil prices (which are a reference for gas prices) remain above US$ 40 per barrel. Inasmuch as Brazilian prices are on a par with international ones, the domestic outlook should also reflect the international one.
From a costs perspective, and if the aforementioned hypotheses of price evolution hold, nuclear sources tend to be competitive with other commercial sources in the time frame of our study.
Environmental concerns
Environmental objections to nuclear energy have lately become less intense. We may say that, in part, they were negatively offset by greater concerns with proliferation, which will be dealt with later.
The main reason for the attenuation of opposition to nuclear energy relates to the perception that the issue of long-lasting waste is not restricted to nuclear plants; it also involves thermal plants if we compute the emission
Figure 10. Assessment of the cost of energy based on updated Eletrobras and EPE investment data for socially and environmentally viable plants. Generation costs calculated
by the authors.
Evaluation of Generation Cost per MWh Using Investment Data
0 20 40 60 80 100 120
50 70 90 110 130 150 170 190 210 230 250
Installed Power
Eletrobrás/ ECEN EPE
U
S$
(2
0
0
5
)/
MW
of greenhouse gases. There are no direct emissions of such gases in nuclear plants.
In order to have an idea of the mass and volume of the residues from both a nuclear and a conventional thermal plant, consider the following. A 1.3 GW nuclear plant (at 80% capacity) requires the replenishment of 54 tons of fuel (enriched uranium) per year, equivalent to one third of its total load, which amounts to a volume of 50 m3. The generation of the
same amount of electricity (approximately 9 TWh) would produce from 2 to 3 million tons of CO2 per year (in a natural gas or coal plant), releasing a volume of 1 to 1.5 billion m3 of this gas into the atmosphere. In other
words, there is a 1:50,000 ratio between the mass of residues from a nuclear and a thermal power plant.
The environmental risks of nuclear energy can be divided in four categories:
1 Risks from normal plant operation.
2 Risks from accidents.
3 Risks in the fuel cycle (production chain, from mine to fuel).
4 Risks in the accumulated wastes.
Firstly, normal operation of the nuclear Pressurized Water Reactor (PWR) plants adopted by Brazil (current and future plants) can be considered relatively clean in comparison with other types of thermal
generation plants, and there are no significant objections to operating plants from local populations in Brazil and abroad.
The main worry of neighboring populations and of environmental analyses are the possible accidents from reactor failure and, ultimately, from terrorist action.
Regarding the PWRs, no accidents with significant environmental damage have ever recorded. The most serious incident, at Three Mile Island, had no direct environmental consequences, yet led to the improvement of current reactors and to the considerable changes that are being incorporated into the next generation of reactors. The current perspective (International Energy Outlook 2006) is that, worldwide, there will be a 31% increase in nuclear energy generation between 2003 and 2030, and that the forecast number can be exceeded in case of higher fuel prices and greater implementation of the Kyoto Protocol.
the reaction), that affect the direct operators. The Tokaymura accident, which lasted several hours, was an exception. The site near the plant was affected by radiation (gamma rays and neutrons), but external
contamination was not serious. An accident of much graver consequences might come from the accidental or intentional dispersion of plutonium from reprocessing plants. These two types of accidents are highly unlikely in Brazil, as the level of enrichment used here in commercial plants is relatively low (4%) and there are no plans for domestic fuel reprocessing in the next decades.
It should be noted that, as in any type of activity, such accidents must be compared to accidents in other fuel cycles, including coal mine collapses, fires in oil installations and hazardous transportation of liquid and gaseous fuels.
In Brazil, the type of radiation dispersion of gravest concern relates to mining activities (not necessarily related to the nuclear cycle), where effluents can disseminate natural radioactivity found in ores, facilitated by the chemical attack used to extract uranium and other materials.
In addition to insufficient financial and human resources for licensing and inspecting activities, Brazil’s nuclear regulatory agency, CNEN (National Nuclear Energy Commission), faces the peculiar problem of incompatible interests, being also responsible for managing the country’s nuclear industries [INB – Indústrias Nucleares Brasileiras]. This anomaly, acknowledged by CNEN’s current directors, persists in spite of numerous national and international recommendations against it.
Regarding low- and medium-activity waste currently stored in situ at the Angra plant, a definite solution must be reached before expansion of the Nuclear Program. The solution to this problem poses no technological difficulties; rather, it is a matter of political will and public acceptance.
There is, however, the greater problem of finding a definite repository for medium- and high-activity waste (essentially, irradiated fuels), the technical solution for which seems to be underground
deposition at a place with proper geological conditions that, nevertheless, reserves for future (and current) generations the possibility of an eventual intervention. This is probably the strategy that will be implemented in the Yucca Mountain repository in the United States.
It is impossible to overstress that a definite repository for nuclear waste must be capable of containing radioactive residue for many thousands of years. This is a problem with which humanity has no experience (the time frame is longer than that of so-called civilized human activity) and whose solution depends on past geological behavior.
predominantly by the world generates a lower volume of solid waste than its closest competitor, the natural/heavy water uranium reactors – PHWRs (Pressurized Heavy Water Reactors). Reprocessing these fuels by reusing the plutonium through irradiation of mixed oxides (plutonium and uranium) is something that is already being done in several
developed countries, considerably reducing the volume of high-activity residue to be stored (products that result from the fission of the uranium nucleusg and from residual plutonium). In Brazil, no decision was made
to follow the reprocessing road, which leads us to believe that fuel storage will be carried out with no changes in their physical or chemical state.
Therefore, we may say that there is still no solution for nuclear waste (solid, small volume and highly toxic for thousands of years) and for the residues of other thermal plants (gaseous, high volume and lasting hundreds of years). In Brazil, more attention should be given to radioactive dispersion in mining activities. Another pressing need is to dissociate the CNEN from the industrial activities of the fuel cycle.
Technological Aspects
Brazil is one of the few countries that masters the nuclear fuel cycle – which includes mining, concentrating and purifying uranium as U3O8 (triuranium octaoxide – yellowcake), converting it into hexafluoride, enriching it, reconverting it into an oxide (UO2 – uranium dioxide), manufacturing pellets and assembling the fuel rods. No commercial units exist for the conversion stage, and due to the enrichment capacity of the unit being built at INB (already in partial operation) most of the uranium is enriched abroad.
The development of the fuel cycle technology, promoted largely at the Navy and CNEN installations (with the support of several industrial units of the Brazilian production system) has already had considerable technological impact on domestic industries.
There are increasing restrictions in the world against the transfer of technologies directly related to the nuclear cycle and of those said to be dual-use. The availability of such technologies has to be attained domestically until the doors for their importation are opened. Considering that many of these technologies are dual-use, an eventual refusal to develop the nuclear area would lead the country to abandon several high-profit areas of the industrial sector.
In the practical experience of nations, access to these technologies is not obtained by renouncing nuclear activities (as the more developed countries wish us to believe), but by acquiring domestic capability and, to a lesser degree, by the transparency of the national nuclear program.
nuclear reactor and of the heat exchangers. However, most of the control elements are still imported. If electricity generationh is divided into smaller
turbines, domestic manufacturing of these components may become possible over the next decades. The design of the next nuclear plants will still come from abroad, albeit with an increasing degree of nationalization.
Manufacturing of reactor components requires important
technological expertise in the areas of materials and mechanical and civil engineering. Building a reactor enhances the expertise in managing and applying quality assurance procedures.
The technological development associated with the nuclear sector also brings important advances for the country in certain specific areas. There are growing access restrictions to these technologies that hamper development in other areas. Access to these technologies is obtained through the domestic mastery that emerges from needs created in the nuclear area.
Strategic Aspects
Strategically, two points should be stressed: the first relates to the availability of national energy reserves and the perspective of energy dependency; the second involves the policy of non-proliferation of nuclear weapons and related technologies.
With regard to the first point, Brazilian energy reserves and resources are published annually in the National Energy Balanço (BEM) by EPE/ MME, as summarized in Table 3 for 2005, including the reserve/production (r/p) and reserve/consumption (r/c) ratios.
Table 3. Reserves measured/indicated in absolute values and related to production and consumption in 2005.
Reserves Production Consump-tion(1) R/P R/C
Consump-tion(2) in
the generation of electricity
106 tep 106 toe/year 106 toe/year Years Years
Oil 1668 84.3 87.7 20 19 3%
Natural gas (3) 304 14.8 22.7 21 13 18%
Coal(4) 2,756 2.3 2.3 1,174 1,204 83%
Nuclear energy 1,236 1.3 2.5 944 498 100%
Source: BEN/EPE/MME Reserves on 12/31/2005 measured/indicated considering waste in mining and processing (in the case of coal and uranium).
(1) Includes transformation.
(2) In the case of oil, electricity generation from oil products.
(3) The production of natural gas excludes re-injection; consumption includes waste.
Among the non-renewable fuels, coal is the one with the greatest reserves and the largest reserve/production and reserve/consumption ratios. These ratios were obtained from the consumption of steam coal and do not include metallurgical coal (for which Brazil is almost completely dependent on imports – 10.4 million tons of oil equivalents in 2005). Nuclear energy – uranium – comes next, even if we adopt the criteria of non-utilization of the residual energies of uranium and plutonium in the irradiated fuels. As for natural gas, not only is Brazil already dependent on foreign supply, but this is the non-renewable energy source with the lowest reserve/consumption ratio. The generation of thermal electricity using preferentially natural gas, as predicted in the 2030 Plan, will probably continue to be carried out with gas imported from our neighbors.
Table 4 shows the possible generation of electric energy from the reserves shown on the previous table. The last column indicates total reserves, including both inferred and estimated values. This table attempts do discriminate the part of the reserves that would be destined to electrical generation by fixing tentative limits on the use of each source based on the percentage of use in 2005 (an increase in the share of natural gas used in generation was assumed).
From Table 4 we can infer that generating electricity from coal and nuclear sources provide greater energy independence among non-renewable fuels. However, Brazilian coal, containing a large volume of ashes, is only useful for generation at the mine head, and therefore is restricted to plants in the southern region of the country. Furthermore, when we include inferred and estimated reserves, it becomes evident that the 2020 Plan’s option for thermal generation from natural gas is a strategic choice to make use of the natural resources of our neighbors, with whom Brazil has a privileged relationship vis-à-vis other countries with a demand for natural gas. The table takes into account that there are other uses for natural gas and that it should preferably be used to co-generate electricity and heat, and not exclusively for generating electricity.
Table 4. Electricity generation from existing Brazilian reserves.
Measured/ indicated
reserves
For use in generating electricity
Reserves usable in generation
'HſEKGPE[ in generating
electricity
Generation: measured/
indicated reserves
Generation including
inferred/ estimated
reserves
106 tep 106 tep 106 tep TWh TWh
Oil 1,668 5% 83 0.38 32 368 505
Natural gas 304 30% 91 0.41 37 435 645
Coal 2,756 85% 2,343 0.29 679 7,900 25303
An analysis of the reserves makes it clear that steam coal and nuclear sources are important generation options. The table does not include renewable reserves, but the production of electricity from biomass will become increasingly important, particularly that derived from sugarcane bagasse.
Under the hypothesis that nuclear energy’s share in 2035 would be an installed capacity of 52 GW, nuclear generation would be approximately 350 TWh (with a capacity factor of approximately 80%), and the total reserves would allow it to be maintained for 23 years. In the most probable scenario, with an installed capacity of 10 GW and the generation of 70 TWh, estimated reserves would last 110 years.
As to the second point of this strategic analysis, we must take into account that the issue of nuclear proliferation has changed significantly over the last years:
India and Pakistan have declared and demonstrated their ability
to explode nuclear military artifacts.
North Korea has conceded that its nuclear activities are for
military uses.
Iran has had its allegedly peaceful nuclear program contested.
The risk of proliferation of nuclear and other weapons of mass
destruction was used by the United States and Great Britain as a pretext for the invasion of Iraq, in spite of the negative results of UN inspections.
The great nuclear powers have not only practically abandoned
the previously announced policy of disarmament, but have also rekindled old projects such as “Star Wars”.
Finally, a new doctrine in the United States contemplates the use
of specific nuclear weapons against non-nuclear countries. This doctrine and the use of force against Iraq in disregard of the conclusions of UN inspectors (from the International Atomic Energy Agency – IAEA) on nuclear issues have weakened the best arguments on the practical uselessness of other countries seeking access to nuclear weapons.
In this scenario, it came as no surprise the complete failure of the UN Conference to review the Nuclear Non-Proliferation Treaty, which took place in May 2005.
With regard to Brazil, which was even identified as a cause of concern in the area of safeguards and the “flavor of the month” for international pressure to adhere to the Additional Protocol strengthening IAEA’s safeguards, the situation has also improved:
A decision was reached with the IAEA on the methods to be
disclose the technical details Brazil wanted to protect (a camera allows a view from the top of the centrifuges).
The policy of preserving Brazil’s enrichment technology was
revealed and has been acknowledged as effective for non-proliferation, with no disclosure of information and no participation of Brazilian technicians in non-peaceful projects abroad.
The current oil price crisis and the problems of global warming associated with the greenhouse effect have led many countries to reconsider increasing the share of nuclear energy in their energy matrix over the next decades. Countries that kept their nuclear generation programs, such as China and Japan, have already announced their intention of intensifying them. Most countries chose extending the life span of existing reactors. Brazil seems inclined to resume the construction of Angra 3 and the 2030 Plan includes four additional nuclear power plants.
Therefore, it is inevitable that Brazil’s (and, probably, Argentina’s) adherence to the Additional Protocol, ratified by the IAEA to strengthen nuclear safeguards, will come again under discussion. This Protocol has already been signed by practically every country where nuclear energy plays a relevant role and it does not seem possible for Brazil to delay indefinitely its decision to adhere (or not) to it. It would be desirable to find a less intrusive way to eventually apply the Additional Protocol to Brazil.
Thus, Brazil’s uranium reserves and mastery of the fuel cycle place the country in a privileged position regarding the use of nuclear energy. The world trend in non-proliferation indicates that this option will be closed to countries that are not able to master the technology over the next years.
Conclusions
Projected energy demand for the next 30 years, even for less-than-desirable economic growth and taking into account efforts aimed at reducing energy intensity, reveals the need to add thermal energy to electricity
generation, which today is predominantly hydroelectric. Nuclear energy should also have a share in generating electricity.
Overly optimistic forecasts of the reduction of the electricity intensity do not seem feasible in our time frame.
The cost of nuclear generation will probably remain competitive in a world scenario with oil prices above US$ 40 per barrel. In Brazil, nuclear energy should also become competitive sometime during this period.
energy. The mass of the residues is fifty-thousand times greater than that from nuclear sources.
The line of reactors adopted by Brazil and the forecasted limited use of nuclear energy make it possible to postpone a solution to the problem of long-term waste disposal. The repositories for short- and medium-duration waste should be defined over the following years. The issue of dissociating CNEN from the industrial activities of the fuel cycle must also be solved. Special care must be given to the environmental impacts of mining activities, even that of non-nuclear materials.
The development of nuclear technology has already brought important gains for the country, affecting other areas of industrial activity – which, in turn, drive the domestic development of technologies that suffer from restrictions in the importation of techniques and equipment needed for other sectors.
Strategically, Brazil has uranium reserves and masters the technology to produce fuel. This makes its supply of electric energy less vulnerable, as it will probably depend more strongly on imported natural gas. The policies of non-proliferation of nuclear weapons have enormously restricted the development or importation of technology related to the fuel cycle. Brazil enjoys a privileged position in the development and responsible management of this technology and must strive to keep it active, because nuclear energy is certainly part of its energy future.
Notes
a This analysis can be global or by industry, as it was done here, for reasons of
simplicity.
b The values of GDP in PPP from 1980 to 2004 show practically the same relative
behavior of the annual GDP values in real terms. This allows us to extend to the concept of purchasing power parity to the 1970-1979 period and project it for the following years.
c The disparity between exchange rates in terms of purchasing power parity is
a persistent reality in many countries, in spite of the economic openness that has been occurring. It is hoped, however, that if the process of economic
internationalization is not reverted, this difference will disappear. Either way, the real value of the GDP is what should be taken into account.
d The correspondence between both scales is not precise, but the approximation
e In 2005, for instance, the consumption of electricity grew more that the GDP (surprising government planners).
f It should be noted that the change pointed out by the WWF study is equivalent
to attaining, in 15 years, the same electricity/GDP ratio (in purchasing power parity) of Africa. Those who are more optimistic might say that Brazil would attain the level of Italy, which also has a low electricity/GDP ratio. But certainly, this way is not possible if the country continues to specialize in commodities. In any case, such a radical change in the economy of electric energy does not seem possible within the time frame suggested by the WWF.
g For fission products, there is also the alternative of irradiation in accelerators to
reduce residual activity.
h In plants such as Angra 2, with only one turbine.
ABSTRACT – The perspectives of nuclear energy in Brazil is analyzed regarding
Carlos Feu Alvim has a PhD in Physical Sciences and is the editor of the Economy & Energy journal. He was a Secretary and Deputy-Secretary of the Brazilian-Argentine Agency for Accounting and Control of Nuclear Materials (Agência Brasileiro-Argentina de Contabilidade e Controle de Materiais Nucleares, ABACC) from 1992 to 2001. @ - [email protected].
Frida Eidelman has a master’s degree in Nuclear Engineering and is the Director-Superintendent of Economy & Energy, a Civil Society Organization of Public Interest. @ - [email protected].
Olga Mafra has a PhD in Physics and is an Associate of Economy & Energy. She has taught graduate courses at IME (Institute of Mathematics and Statistics of the University of São Paulo) and IPEN (Institute for Energy and Nuclear Research). @ - [email protected].
Omar Campos Ferreira is a civil and nuclear engineer and an Associate of Economy & Energy. He was a director of the Nuclear Technology Development Center (Centro de Desenvolvimento de Tecnologia Nuclear, CDTN) and a Professor at the Federal University of Minas Gerais (UFMG). @ - [email protected].
This text has been translated by Carlos Malferrari. The original in Portuguese – “Energia nuclear em um cenário de trinta anos” – is available at http://www.scielo.br/scielo. php?script=sci_issuetoc&pid=0103-401420070001&lng=pt&nrm=iso.