regional committee
~,~s&
PAN AMERICAN
WORLD
1-~{
)').
SANITARY
HEALTH
ORGANIZATION
ORGANIZATION
VIII Meeting VII Meeting
Washington, Do C. 9-21 September 1955
CD8/5 (Eng.) 12 July 1955
ORIGINAL: ENGLISH
Topic 13: PROPORTIONATE PROGRAM DISTRIBUTION OF BUDGET FUNDS
A report on the proportionate program distribution of budget funds of the Pan American Sanitary Bureau (1951-1954) was presented by the Director to the Executive Committee at its 25th Meeting, in compliance with a resolution adopted by the Committee at its 24th Meeting.
After studying the report, the 25th Meeting of the Executive Committee adopted Resolution I, which reads:
"THE EXECUTIVE COMMITTEE,
Taking into account the report presented by the Director of the Pan American Sanitary Bureau on the proportionate pro-gram distribution of budget funds, 1951-1954 (Document CE25/10 and Corrigendum); and
Considering that the afore-mentioned report fully complies with Resolution I adopted at the 2it;h Meeting of the Executive Committee,
RESOLVES:
1. To take note of the report on proportionate program distribution of budget funds, 1951-1954 (Document CE25/10 and Corrigendum), and to congratulate the Director of the Pan American Sanitary Bureau on the presentation and contents of the report.
2, To transmit the aforesaid report to the next meeting of the Directing Council."
In accordance with the above resolution, the Director has the honor to transmit the said report to the Directing Council for consideration.
executive committee of working party of the directing council the regional committee
PAN AMERICAN
WORLD
SANITARY
HEALTH
ORGANIZATION
ORGANIZATION
25th Meeting Mexico, D. F. 25 April - 3 May 1955
CE25/lO and Corr, (Eng.) 6 April 1955
ORIGINAL: ENGLISH
Topic 8: REPORT ON PROPORTIONATE PROGRAM DISTRIBUTION OF BUDGET FUNDS
or1951
1.954)During the discussion on the PASB/WHO Program and Budget at the XIV Pan American Sanitary Conference, the Chilean Delegation requested the Director to provide some information on the proportionate distribu-tion of funds by major groups of activities. A report prepared in the limited time available to the Secretariat during the Conference was presented indicating the distribution of funds budgeted for 1955 and
1956 from three combined sources (PASB/Regular, WHO/Regular and UN/TA Programs)..
The Conference referred the subject for study to the 24th Meet-ing of the Executive Committee, which considered it as a topic entitled "Measures to Facilitate the Analysis of the Budget." The discussions which took place on the matter led the Executive Committee to adopt a resolution recommending to the Director the presentation of information "on the proportionate distribution of funds administered by the Bureau in the various administrative and technical activities in such a manner that its analysis will show a comparison of the expenditures of the past four years with those proposed for future programs." Accordingly, the Director has the honor to present the following report.
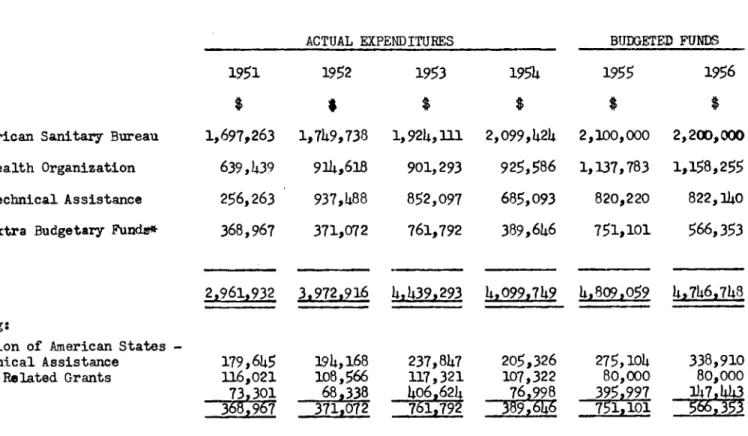
As general background information, it seems pertinent to present in Table I a general summary of the yearly expenditures made for the period 1951 - 1955 according to the several financial resources made available to the Bureau, namely: PASB and WHO/Regular Budgets, funds from the UN/Technical Assistance and the Technical Cooperation Program of the Organization of American States, contributions of Member Govern-ments, and .grants provided for the administration of INCAP, funds reim-bursed by UNICEF to 1HO for the payment of personnel, PASB funds specifi-cally authorized by the governing bodies and other funds, the latter
including grants from various sources. In this table the funds administer-ed by the Bureau on behalf of the Member Governments for the purchase of supplies and equipment are not considered, nor are the amounts allocated by the UNICEF Executive Board for supplies and equipment to international health programs which are technically approved and supervised by PASB/WHO. It seems pertinent to mention this fact since the use of these funds
CE25/10 (Eng.) Page 2
staff and a consequent higher proportion of overhead costs, when these overhead costs are considered only in relation to the figures shown in the tables. To illustrate the above point, the figures indicating the amounts of actual purchases and proforma quotations submitted to Govern-ments are presented for the years 1951 - 1954, inclusive:
Purchases
$
1, 721.,5R8 3,072,022 1,365, 199 1,500,461
The following amounts have been allocated by the Board for purchases of supplies and equipment by UNICEF
Quotations
$
4,083o000 .3924,265
2,517,521 .2,672,166
UNICEF Executive for joint projects:
Amount
899,o0o0 1,152,000 676,000 496,000
It should be pointed out that the estimated expenditures for 1955. and 1956 cannot properly be compared with the actual expenditure figures for previous years. 'In fact, it is impossible to foresee'the actual amount available from :some of the sources of funds, especially those from the UN Expanded Program for Technical Assistance.
As was stated iby the Secretariat during the discussions held at the Conference and the Executive Committee Meeting, an analysis of the propor-tionate distribution of funds according to major fields of activity cannot properly be considered unless all funds are taken into consideration as one, the fact being that the program of PASB/WHO is an integrated whole, irrespective of the financial sources. available to it. As a consequence, the figures presented on subsequent tables make a breakdown of the'total amount spent or budgeted for a particular year.
Table II, prepared in a similar fashion to that appearing on Page 11 of Document CE25/2, will permit the study of the trend of proportionate
Year
1951
1952
1953
1954
Year
1951
1952
1953
CE25/10 (Eng.) Page 3
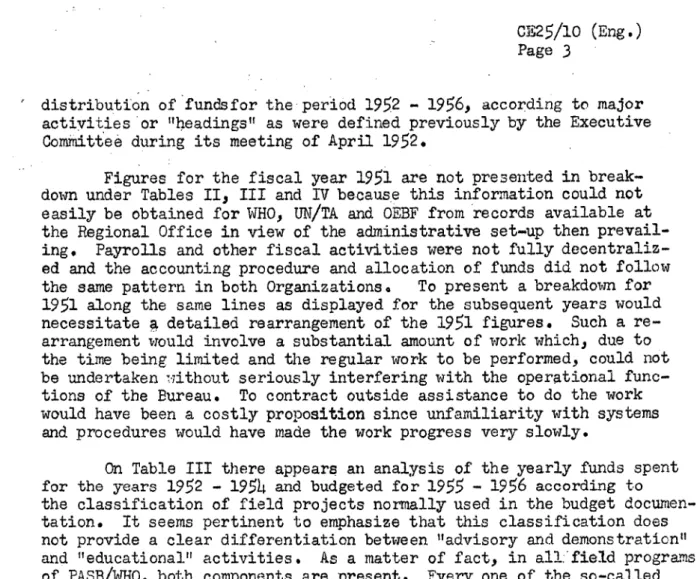
distribution of fundsfor the period 1952 - 1956, according to major activities or "headings" as were defined previously by the Executive Committee during its meeting of April 1952.
Figures for the fiscal year 1951 are not presented in break-down under Tables II, III and IV because this information could not easily be obtained for WHO, UN/TA and OEBF from records available at the Regional Office in view of the administrative set-up then
prevail-ing. Payrolls and other fiscal activities were not fully decentraliz-ed and the accounting procdecentraliz-edure and allocation of funds did not follow the same pattern in both Organizations. To present a breakdown for
1951 along the same lines as displayed for the subsequent years would necessitate 4 detailed rearrangement of the 1951 figures. Such a re-arrangement would involve a substantial amount of work which, due to the time being limited and the regular work to be performed, could not be undertaken without seriously interfering with the operational func-tions of the Bureau. To contract outside assistance to do the work would have been a costly proposition since unfamiliarity with systems
and procedures would have made the work progress very slowly.
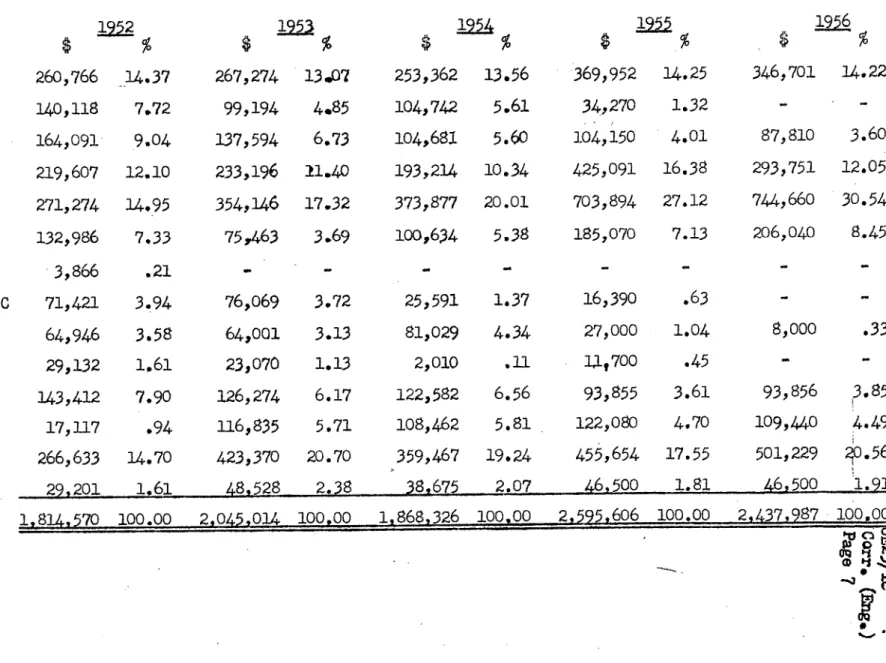
On Table III there appears an analysis of the yearly funds spent for the years 1952 - 1954 and budgeted for 1955 - 1956 according to the classification of field projects normally used in the budget documen-tation. It seems pertinent to emphasize that this classification does not provide a clear differentiation between "advisory and demonstration" and "educational" activities. As a matter of fact, in all field programs
of PASB/WHO, both components are present. Fvery one of the so-called advisory and demonstration activities, which for the sake of brevity will be referred to as "operational," is devoted in great part to the
training of national personnel to enable a country to proceed with the work once the Organization has withdrawn. On the other hand, field
activities labelled as "educational" have as a major tool the improve-ment of health services. Understandably, educational programs in all public health fields require practical experience which, in turn, means that services usually must be improved as an essential step in providing
sound education.
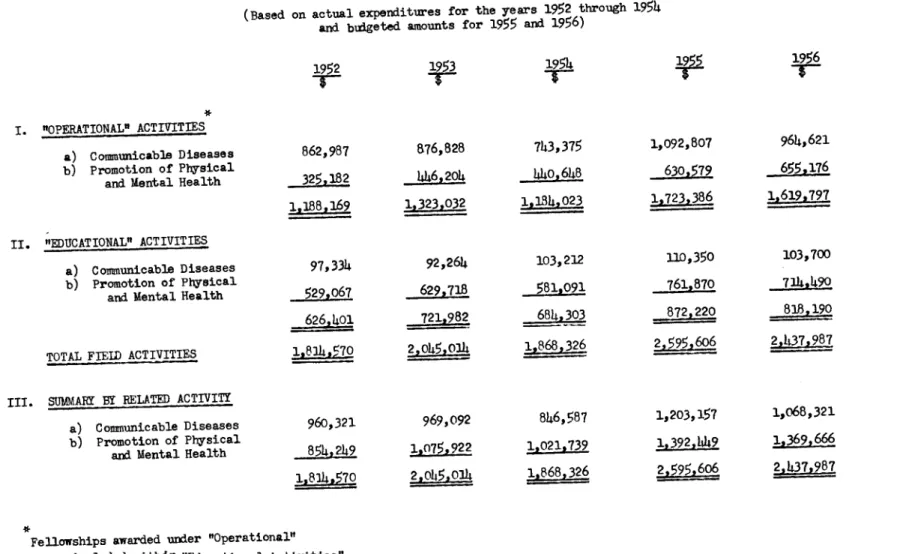
Table IV attempts to give a rather broad picture by dividing the field activities into two major groups, "operational" and "educational,"
according to their main method of work. Each of them, in turn, is being divided into two subgroups, namely: "Communicable Diseases" and "Pro-motion of Physical and Mental Health," depending on their major
neces-CE25/10O (Eng.) Page 4
sarily be arbitrarye In fact, the main final objective of all the
activities of PASB/WHO is the strengthening of national health services, whether the activities are directed toward control or eradication of insect vectors or of communicable diseases, improvement.of environmental sanitation, development of a system for integrated local health services, improvement of nutrition, dissemination of technical information, assis-tance of educational institutions, provision of fellowships to public health personnel, or related activities.
. I
; ! .
I . . . I .: . I I .1
. 7 .,
TABLE I
SUMMARY OF FUNDS ADMINISTERED BY PASB/WHO
1951 THROUGH 1956 BY SOURCE OF FUNDS
ACTUAL EXPENDITURES
1. Pan American Sanitary Bureau
2. World Health Organization
3, U. N. Technical Assistance
4. Other Extra Budgetary Fundre
1951
$
1,697,263
639,439
256,263
368,967
2,961,932
* Comprising:
Organization of American States -Technical Assistance
INCAP and Related Grants Other
179,645
116,021 73,301 368,967
1952
1,749,738
914,618
937,48 8
371,072
3,972,916
194,168 108,566
68,338
371,072
1953
$
1,924, 111
901,293
852,097
761,792
4 439,293
237,847 117,321 406,624 761,792
1954
$ 2,099,424
925,586
685,093
389,646
4,099,749
205,326 107,322 76 998
389,646
BUDGETED FUNDS
1955 1956
$ $
2,100,000 2,200,000
1,137,783 1,158,255
820,220 822,140
751,101 566,353
4,809,059
275,104
80,000
395,997
751,101
4,746,748
338,910
80,000
147,443
566,353 tuC
lM ·dy,
:o
SUMlMARY OF ALL ACTIVITIES FROM FUNDS ADMINISTERED BY PASB/WHO FOR THE YEARS 1952 THROUGH 1956 BY PRINCIPAL GROUPS
(Based on actual expenditures for the years 1952 through 1954 and budgeted amounts for 1955 and 1956)
1952
$ %
GROUP I
Office of Director Executive Offices
Office of Public Information Office of Coordination
Division of Administration (excluding Supply)
Common Services - Headquarters Common Staff Costs
TOTAL - GROUP I
114,300 2.9
52,948 1.3 21,600 .5
346,847 8.8
138,405 3.5
143,280 3.6
817,380 20.6
1953
92,200 2.1
59,973 1.3
23,163 .5
346,363 7.8
129,906 2.9
159,187 3.6
810,792 18.2
111292 2.7
111, 292 2.7
67,532 1.6
20,196 .5
335,793 8.2
118,361 2.9
146,414 3.6
799,588 19.5
TABLE II
1955
116,632 2.4
64,723 1.3
24,484 .5
340,312 7.1
115,47o 2.4
141,505 3.0
803,126 16.7
1956
$ %
119,420 2.5
65,253 25,054
1.3 .5
349,690 7.4 114,470 2.4 154,722 3.4 828,609 17.5
GROUP II
Tech. Services and Supply Division of Public Health Division of Education and Training Library
Editorial Office Supply Office Zone Offices Common Staff Costs
TOTAL - GROUP II
GROUP III Programs
Publications of PASB TOTAL - GROUP III
GROUP IV
Part I - PASO
Conference Services Organizational Meetings Colmnon Staff Costs
TOTAL - GROUP IV
GROUP V
Terminal Leave
Building Loan Amortization Building Improvements
TOTAL- GROUP V
225,859 5.7 61,721 1.6 32,974 .8
48,204 1.2
60,430 1.5
463,654 11.7
130,730 3.3
1,023,572 25.8
1,785,369 44.9 29,201 .e
1,814,570 45.7
77,967 1.9
96,412 2.4 25,911 .7
200,290 5.0
18,977 .5 50,000 1.2 48,127 1.2 117,104 2.9
190,417 4.3 90,706 2.0 33,515 .8
52,572 1.2
71,335 1.6 539,926 12.2
119,184 2.6
1,097,655 24.7
2,000,561 45.1 44,453 1.0
2,045,O014 46.1
80,075 1.8
44,529 1.0
19,379 .4
143,983 3.2
26,870 .6
200,000 4.5
114,979 2.7
341,849 7.8
192,730 4.7
82,871 2.0
34,806 .8
55,710 1.4
73,305 1.8
552,144 13.5
162,827 3.9
1,154,393 28.1
1,829,729 44.6
38,597 1.0
1,868,326 45.6
87,652 2.1
133,704 3.3
38,226 .9
259,582 6.3
17,860 .5 17,860 .5
257,881 5.4 126,973 2.6 35,517 .7
55,845 1.2
70,336 1.5 535,170 11.1
157,596 3.3
1,239.318 25.8
2,549,106 53.0 46,500 1.0
2,595,606 54.0
92,329 1.9 49,000 1.0 29,725 .6 171,054 3.5
_ _
= _
264,855 5.6
130,632 2.8
36,424 .8
57,899 1.2
72,796 1.5
537,310 11.3
163.799 3.4
1,263,715 26.6
2,391,487 50.4
46,500 1.0
2,437,987 51.4
95,598 2.0 87,827 1.9 33,012 .6
216,437 4.5
_ _ _ _
4,746,748 oo100. TOTAL - ALL GROUPS
o X cs CDrX
4,809,104 1OO.O 4,099,749 100loo.o
TABLE III (Corrigendum) S UMIARY OF FIELD ACTIVITIES FROM FUNDS ADMINISTERED BY PASB/WH O
FOR THE YEARS 1952 THROUGH 1956 BY MAJOR SUBJECT HEADINGS
(Based on actual expenditures for the years 1952 through 1954 and budgeted amounts for 1955 and 1956)
MALARIA & INSECT CONTROL
TUBERCULOSIS
V. D. & TREPONEMATOSES
ENDEMO-EPIDEMIC DISEASES
PUBLIC HEALTH ADMINISTRATION
NURSING
SOCIAL & OCCUPATIONAL HEALTH
HEALTH EDUCATION OF THE PUBLIC
MAITERNAL & CHILD HEALTH
MENTAL HEALTH
NUTRITION
ENVIRONMENTAL SANITATION
OTHER EDUCATION & TRAINING
PUBLICATIONS
1952
$
%
260,766 14.37 140,118 7.72
164,091 9.04
219,607 12.10
271,274 14.95 132,986 7.33
3,866 71,421 64,946 29,132 143,412 17,117 266,633
on OMl
.21 3.94 3.58 1.61 7.90 .94 14.70
-I 1
1954
$
267,274 99,194 137,594 233,196 354,146 13.07 4.85 6.73 21.40 17.32 75,463 3.6976,069 64,001 23,070 126,274 116,835 423,370
j.. q, r
3.72 3.13 1.13 6.17 5.71 20.70
9 qA
253,362 104,742 104,681 193,214 373,877 100,634 25,591 81,029 2,010 122,582 108,462 359,467
$
13.56 5.61 5.60 10.34 20.01 5.38 1.37 4.34 .11 6.56 5.81 19.24 2.07 369,952 34,270 104,150 425,091 703,894 14.25 1.324 .01
16.38
27.12
185,070 7.13
16,390 27,000 1L, 700 93,855 122,080 455,654
L6. 500
.63 1.04 .45 3.61 4.70 17.55 1.81 1956
346,701 14.22
87,810 293,751 744,660 206,040 8,000 93,856 109,440 501,229 46.500 3.60 12.05 30.54 8.45 .33 3.85 4.49 0.56 1.91
rc7 - i r-j SU J._.,U1 4QQ C -
-1,814,570 100.00 2,045.014 100,00 1,868,326 100700 2,595,606 100.00 2,437,987 100.00
e ij
TABLE IV
SUMMARY OF FIELD ACTIVITIES FROM FUNDS ADMINISTERED BY PASB/WHO
FOR THE YEARS 1952 THROUGH 1956 BY PRINCIPAL GROUPS
(Based on actual expenditures for the years 1952 through 1954
and budgeted amounts for 1955 and 1956)
T-I. "OPERATIONAL" ACTIVITIES
a) Communicable Diseases 862,987 876,828 743,375
1,092,807 964,621
b) Promotion of Physical48 630,79 6 76
and Mental Health 325,182 6,20 630579 65176
1,188,169 1,323,032 1134,023 1,723,386 1619.797
II. "EDUCATIONAL" ACTIVITIES
a) Communicable Diseases 97,334 92,264
103,212 110,350 103,700
b) Promotion of Physical
and Mental Health 529,067 629,718 581,091
761,870 714,490
626, 401 721,982 684,303 872,220 818.190
TOTAL FIELD ACTIVITIES 1,814,570 2,045,014 1,868,326
2,595,606 2,437,987
III. SUMMARY BY RELATED ACTIVITY
a) Communicable Diseases 960,321 969,092
846,587 1,203,157 1,068,321
and Mention of Physical 854,249 1,075,922 1,021,739 1,392,449
1,369,666
* t-j
Fellowships awarded under "Operational"