Drug Use in Ontario, Canada
REGINALD
G.SMART & EDWARD
M.ADLAF~
Tzoo long-term surveys of drug use have been carried out in Ontario, Canada-one involving middle- and high-school students, and the other adults in the general
population. These studies revealed that use of tobacco and alcohol is common and that cannabis is the most widely used illicit drug by both the students and adults (15.9% and 9.5%, respectively, in 1987). Use of other illicit drugs is much less common. The trend data from 1977 to 1987 show a decrease in all drug use among students and a basically stable pattern among adults, with the exception of an upward trend in cocaine use. A study of adult cocaine users in the community found
that half had experienced intense cravings for cocaine and other adverse effects. Demographic information was also gathered that made it possible to outline the most common characteristics of cannabis and cocaine users.
M
uch of the information that has been obtained about drug use in Ontario, Canada, has come from surveysof students and the general population and studies of users. The purposes of this epidemiologic research, conducted by the Addiction Research Foundation, an agency of the province of Ontario, are to (1) study the nature and extent of drug use in Ontario among general and high- risk populations; (2) examine trends in the use of a variety of drugs, of both re- cent and long-standing use; and (3) de- termine users’ characteristics, problems, and treatment needs. This information is supplemented with studies of arrests, seizures of drugs, and other official data where appropriate.
Epidemiologic information is always more useful if trend data are available; two long-term trend studies have been conducted in Ontario, one of students and the other of adults. Surveys of stu- dents began in 1968 in Toronto. In 1977, this study was expanded to include all
‘Prevention Studies Department, Addiction Re- search Foundation. Mailing address: 33 Russell Street, Toronto, Ontario, Canada M5S 251. 22 Bulletin of PAHO 24(l), 1990
students in grades 7, 9, 11, and 13 in the province. The survey is repeated every two years; the latest data available were collected in 1987. These surveys inquire about the students’ use of alcohol and 16 other licit and illicit drugs.
Studies on alcohol and drug use in the adult population of Ontario began in 1976 in Toronto and are repeated about every three years. They provide informa- tion on the age group 18 years old and over.
Both the student and adult studies in- volve samples of the general population, chosen to be representative and unbi- ased. However, they typically do not in- clude many heavy users, especially of less common drugs. This means that while the studies are valuable for indica- ting overall trends, they are of limited value for gathering information specifi- cally about drug abusers. In-depth stud- ies of heavy users are needed to deter- mine their patterns of use and special problems. Since cocaine abuse has been the fastest growing illicit drug problem in Canada, special study of cocaine users was particularly warranted.
studies done in the past 10 years: of stu- dents, adults, and cocaine users. Taken together, they give an overview of drug use trends and the characteristics and problems of users. First, however, it is useful to examine each study separately.
DRUG USE AMONG STUDENTS
Methods
The 1977 and 1979 surveys employed a stratified multistage cluster design with two strata-grade and geographic region. These designs yielded sample groups of 4,687 students (70% participation rate) from 104 schools m 1977 and 4,794 stu- dents (78% participation rate) from 87 schools in 1979.
The sampling design from 1981 onward has employed a more rigorous stratified (grade by region) single-stage cluster sample of homeroom classes (with paired selection of replicates). The data were weighted to account for variable sam- pling fractions and nonresponse by some classes and students. The number of stu- dents surveyed by year was as follows: 3,270 from 182 schools in 1981; 4,737 from 227 schools in 1983; 4,154 from 193 schools in 1985; and 4,267 from 170 schools in 1987. The participation rate varied between 82% and 85%. Since 1981, the surveys have been conducted by the Institute for Social Research, York University. Further details regarding the sampling designs and methods have been published elsewhere (I, 2).
For aU surveys, the data-gathering in- strument was a self-administered, anon- ymous questionnaire completed in class groups in 30- to 40-minute sessions. Reliability and validity of such ques- c tionnaires are usually good, although
students may underreport their drug use (3).
Students were asked about the fre- quency of their use of alcohol and 16
other drugs in the preceding 12 months. For example, the question on cannabis read as foIIows: “In the last 12 months, how often did you use cannabis (also known as marijuana, ‘grass,’ ‘pot,’ hash- ish, ‘hash,’ hash oil)?” For 15 of the 17 drugs (cannabis, glue, other solvents, barbiturates, stimulants, tranquilizers, heroin, speed, LSD, PCP, other haIIu- cinogens, cocaine), the response catego- ries were (1) do not know drug, (2) did not use drug during past 12 months, (3) used drug l-2 times, (4) 3-5 times, (5) 6-9 times, (6) lo-19 times, (7) 20-39 times, or (8) 40 or more times during the past 12 months. Annual prevalence of use was calculated on the basis of positive re- sponses to codes 3 through 8. Response categories for alcohol use were (1) no drinking in past 12 months, (2) drank at special events (e.g., Christmas, wed- dings), (3) took a sip to see what it is like, (4) drank once a month or less, (5) two or three times a month, (6) once a week, (7) two or three times a week, (8) four or five times a week, or (9) almost every day. Prevalence calculations were based on positive responses to codes 2 and 4 through 9. Response categories for to- bacco use were (1) did not use, (2) tried one cigarette, (3) smoked less than one cigarette daily, (4) l-2 cigarettes daily, (5) 3-5, (6) 6-10, (7) 11-15, (8) X-20, or (9) more than 20 cigarettes daily. For barbitu- rates, stimulants, and tranquilizers, dis- tinction was made between medical use, meaning use under the direction of a physician, and nonmedical use.
Results
Overall Drug Use
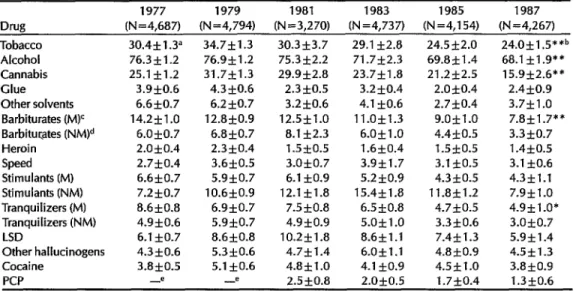
AIcohol and tobacco are the most pop- ular drugs by far, with 68% and 24% of students, respectively, using them in the 12 months prior to the 1987 survey (Table 1). Cannabis is the next most popular
Table 1. Annual prevalence (%) of drug use among Ontario students, 1977, 1979, 1981,1983, 1985, and 1987.
1977 1979 1981 1983 1985 1987 Drug (N=4,687) (N=4,794) (N=3,270) (N=4,737) (N=4,154) (N=4,267) Tobacco 30.4*1.3a 34.7f1.3 30.3*3.7 29.1*2.8 24.512.0 24.0f1.5**b Alcohol 76.3k1.2 76.9&l .2 75.3k2.2 71.7f2.3 69.8f1.4 68.1*1.9** Cannabis 25.1&-1.2 31.7*1.3 29.9k2.8 23.7k1.8 21.252.5 15.9f2.6** Glue 3.9f0.6 4.3f0.6 2.3k0.5 3.2f0.4 2.0*0.4 2.4*0.9 Other solvents 6.6kO.7 6.2f0.7 3.2k0.6 4.1f0.6 2.7kO.4 3.7*1.0 Barbiturates (M)’ 14.2*1.0 12.8&0.9 12.5*1.0 11.0*1.3 9.0*1.0 7.8*1.7** Barbitur,ates (NMjd 6.0f0.7 6.8f0.7 8.1k2.3 6.Okl.O 4.4f0.5 3.3*0.7 Heroin 2.OkO.4 2.3kO.4 1.5f0.5 1.6kO.4 1.5f0.5 1.4*0.5 Speed 2.7f0.4 3.6f0.5 3.0*0.7 3.9Tk1.7 3.1*0.5 3.1kO.6 Stimulants (M) 6.61tO.7 5.9*0.7 6.1kO.9 5.2 *0.9 4.3*0.5 4.3fl.l Stimulants (NM) 7.2kO.7 10.6kO.9 12.1zkl.8 15.4*1.8 11.8kl.2 7.9*1.0 Tranquilizers (M) 8.6*0.8 6.9kO.7 7.5YcO.8 6.5f0.8 4.7*0.5 4.9*1.0* Tranquilizers (NM) 4.9kO.6 5.9*0.7 4.9*0.9 5.0*1.0 3.3kO.6 3.0f0.7 LSD 6.1kO.7 8.6*0.8 10.2fl.B 8.6*1.1 7.4f1.3 5.9f1.4 Other hallucinogens 4.3k0.6 5.3kO.6 4.7*1.4 6.011.1 4.a*o.9 4.5*1.3 Cocaine 3.8kO.5 5.1kO.6 4.8fl.O 4.1 f0.9 4.5fl.0 3.8kO.9 PCP 4 4 2.5i-0.8 2.OztO.5 1.7f0.4 1.3rt0.6
'95% confidence interval.
bContrastofttestsfor1977versus1987: *p < O.O5,**p c 0.001. '(M) = medical use.
d(NM) = nonmedicaluse. eNotqueried.
(15.9%). The 1987 survey found that aII other drugs were used by small propor- tions of students, fewer than 5% for most illicit drugs. Even cocaine, which has in- creased in general popularity, had been used by only 3.8% of the students.
l?ends in Alcohol and Other Drug Use
Trends in annual prevalence of use be- tween 1977 and 1987 can be seen in Table 1. Comparing 1977 with 1987 reveals sig- nificant reductions in the prevalence of alcohol, tobacco, and cannabis use and the medical use of barbiturates and tran- quilizers. The remaining drugs, in&d- ing glue, heroin, speed, stimulants, LSD, other hallucinogens, and cocaine, do not
show significant changes in use between these two points in time. For many sub- stances, use peaked in 1979 and has since de&red or stabilized. Some of the de-
24 Bulletin
of
PAHO 24(l), 2990dines between 1979 and 1987 are dra- matic: the proportion of students report- ing cannabis use dropped from 31.7% in 1979 to 15.9% in 1987; tobacco smoking declined from 34.7% to 24.0%; and barbi- turate use (medical) dropped from 12.8% to 7.8%.
In addition to the declines that have oc- curred in use of specific substances, muI- tiple drug use has also decreased. The percentage of students reporting use of at least one substance, licit or illicit, was 77.3% in 1977, 81.6% in 1979, 75.4% in 1981, 75.8% in 1983, 73.1% in 1985, and 71.6% in 1987; the mean number of drugs used declined from 2.03 in 1979 to 1.47 in 1987.
Characteristics
ofStudents Who Used
Illicit Drugs
Over the many years of these studies, certain demographic characteristics have been found to be associated with i&it drug use. For purposes of simplicity, can- nabis is taken to represent aII i&it drugs, since most users of any illicit drug have used cannabis, and it always ranked in the surveys as the most popuIar illicit drug. Compared with nonusers, canna- bis users, and especially heavy users, more likely
l aremale;
l are in the higher grades, that is, 11
through 13, and hence are aged 16- 19;
l obtain poorer grades in school;
l report use of alcohol and other
drugs;
l attend church less often;
l have friends and parents who use
drugs.
DRUG USE AMONG ADULTS
Methods
The sampling procedure for all the adult surveys employed the Gallup On- tario Omnibus Survey. This is a yearly study of about 1,100 adults in Ontario who are interviewed in their homes on a variety of topics; hence it is an “omni- bus” survey. It maintains a modified probability sample in aII population cen- ters of over 1,000 persons. The survey is designed to produce an approximation of the adult civilian population 18 years old and older living in Ontario (except for those persons in institutions, such as prisons or hospitals, or those residing in far Northern regions). Census data were employed to ensure that the age and gen-
der distributions reflect the Ontario adult population. In total, 1,774 respondents were interviewed with the same ques- tionnaire items in 1977, 1,040 in 1982, 1,051 in 1984, and 1,084 in 1987.
Questions about the frequency of use of sleeping pi&, stimulants (including pep and diet pills), tranquilizers, mari- juana or hashish, and alcoholic beverages were identical across each of the four sur- veys. No distinction was made between medical and nonmedical use. Two sup- plemental questions regarding the use of cocaine were included for the first time in 1984. Additionally, in 1987 respondents were also queried on the use of cocaine in the form of “crack.” Details of the sam- pling methods and results have been published elsewhere (4,5).
Results
Overall Drug Use
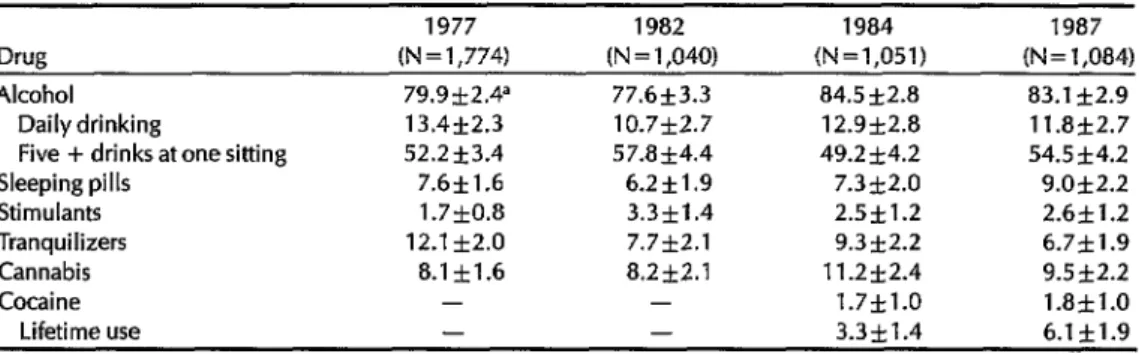
Compared with 1977 and 1982, more respondents in 1984 and 1987 report drinking alcohol within the previous 12 months (Table 2). Indeed, significantly more drank in 1987 (83.1%) versus 1982
(77.6%),
and more drank in 1984 (84.5%) than in 1982 or 1977 (79.9%). There are no significant changes in the percentage of daily drinkers, which has remained rela- tively stable since 1977. The percentage of drinkers who reported the consump- tion of five or more drinks at a single sit- ting within the past 12 months dipped to 49.2% in 1984 and then increased signifi- cantly to 54.5% in 1987. Apart from that recent fluctuation, prevalence of this type of heavy drinking remained relatively stable.The annual prevalence of sleeping pill, stimulant, or tranquilizer use shows no statistically significant changes between 1984 and 1987. Sleeping piU use in 1987 was significantly higher than in 1982 (9.0% versus 6.2%), but otherwise was
Table 2. Annual prevalence (%) of drug use among Ontario adults. Drug
Alcohol Daily drinking
Five + drinks at one sitting Sleeping pills
Stimulants Tranquilizers Cannabis Cocaine
Lifetime use
1977 1982 (N=1,774) (N = 1,040)
79.9*2.4= 77.6k3.3 13.4f2.3 10.7k2.7 52.2k3.4 57.ak4.4 7.6fl.6 6.2&-1.9 1.7f0.8 3.3*1.4 12.1*2.0 7.7k2.1 8.lkl.6 a.2*2.1
- -
- -
1984 (N=1,051)
84.5k2.8 12.9k2.8 49.2 k4.2
7.3k2.0 2.5kl.2 9.3k2.2 11.2k2.4 1.7kl.O 3.3kl.4
1987 (N = 1,084)
83.1 f2.9 11.8f2.7 54.5 f4.2
9.0*2.2 2.6*1.2 6.7k1.9 9.5*2.2 1.a*1.0 6.1*1.9 a95% confidence interval.
stable except for a significant increase be- tween 1984 and 1987 among respondents aged 18-29 years. Overall, stimulant use has remained stable since 1977. No sub- group trends were discovered, but rates of use showed an inverse relationship to age. Tranquilizer use has remained rela- tively stable since 1982. The 1977 estimate of 12.1%, however, was significantly higher than all the levels found subse- quently. In all survey years, females and respondents aged 50 and over were the most likely to report use of tranquilizers.
The aggregate annual prevalence of cannabis use has remained stable at the 8% to 11% level since 1977. However, the data do suggest the beginning of a cohort effect. Between 1984 and 1987, use de- clined significantly among 18-29-year- olds (from 28.5% to 20.0%), while it in- creased nonsignificantly among 30-49- year-olds (6.3% to 9.2%).
Finally, although lifetime prevalence of cocaine use increased significantly be- tween 1984 (3.3%) and 1987 (6.1%), an- nual prevalence remained unchanged (1.7% and 1.8%, respectively). Lifetime use among females climbed from 1.9% to 4.7%, and rose among those aged 18-29 years from 7.1% to 13.6%-both signifi- cant increases. Of interest was our first estimate of use of cocaine in the form of crack. Only 0.7% of all respondents re- ported ever using cocaine in this form. However, about one-fifth (18%) of those
26 Bulletin ofPAH0 24(I), 1990
who had used cocaine at some time in their lives reported use of crack.
Characteristics
ofIllicit Drug
(Cannabis) Users
As in the study of students, it was found that some groups regularly report more cannabis use than others. Although the study questionnaire for adults is rela- tively short and does not have the scope to explore social or psychological factors associated with drug use, it did reveal some demographic facts often associated with cannabis users, namely, that they more likely
are males; are aged 18 to 29;
live in metropolitan Toronto; have secondary or post-secondary education;
are employed rather than in the cate- gory called miscellaneous (unem- ployed, retired, student, or dis- abled).
A STUDY OF COCAINE USERS
Methods
lems (6). Cocaine users who were in treatment or in prison were excluded from this study, as they were sure to have experienced more problems than users still in the community. Interviews were conducted of 111 cocaine users who re- sponded to personal contacts or to adver- tisements placed in mass media outlets with a young audience. To be included in the study, participants had to be aged 21 or over, must have used cocaine within the past three years, and must have been employed for at least six of the past 12 months.
Results
Cocaine and Other Drug Use
Almost all participants used cocaine in- tranasally and only about 7% injected (this study was done before crack cocaine came to Canada). The average age of first use was 22, and the subjects had been taking cocaine for an average of about seven years. Most reported easy access to cocaine, obtaining it from friends. They typically used four to six lines per occa- sion, or about half a gram. About 25% used cocaine weekly, about 45% monthly, and about 30% used it less often than once a month.
Participants were also heavy con- sumers of other drugs. All reported can- nabis use, 86% reported LSD use, 95% had used hallucinogens other than LSD or PCP, 85% had used heroin, and 61% had used other narcotics. About one- third reported daily or almost daily use of cannabis and other drugs.
Efiects
of
Cocaine
The most commonly reported effects of cocaine were increased energy (77% of users), more self-confidence (67%), higher heart rate (66%), and restlessness (50%). About half reported having had
an uncontrollable urge or craving for co- caine at some time; however, 20% re- ported this feeling every or almost every time they used it.
For some users, cocaine had very seri- ous adverse effects, likely to cause them considerable problems. For example, about half of the users had experienced one or more of the following: hallucina- tions, violent or aggressive behavior, paranoia, need to seek medical attention related to cocaine use at least once, fre- quent sore or bleeding nose, frequent mental or physical exhaustion, and fre- quent cravings for cocaine. About 27% of users had more than two of these effects, and thus constituted the group with the gravest problems.
Characteristics
of
Users
The social and demographic character- istics for this group of cocaine users were as follows:
the majority were males (70%); average age was 29.4 years;
more than half were single, and few were currently married;
many were well-educated (40% had attended university);
many had occupations that paid well, such as professionals, man- agers, and technicians.
DISCUSSION AND CONCLUSIONS
The Addiction Research Foundation’s epidemiologic research on drug use, by means of two long-term trend studies and investigations of special groups of drug users, has led to a number of con- clusions regarding the current nature of drug use in Ontario.
1. The most commonly used drugs are alcohol, tobacco, and cannabis,
2.
3.
4.
5.
Other illicit drugs are not often used in the general population.
Most drug use is infrequent; with the exception of alcohol, tobacco, and cannabis, very few drugs are used daily.
Over the past 10 years, the trend in drug use is downward for students and essentially stable for adults. This is particularly the case for the most popular drugs among stu- dents, especially cannabis. There is no significant upward trend in the use of any drug among students, and only in cocaine use among adults.
Users of illicit drugs tend to be young and male.
Users of the popular illicit drugs, such as cannabis, tend to be users of many other licit and illicit drugs.
Many problems exist in maintaining an epidemiologic program, especially one including long-term trend studies. These studies require consistent funding and staffing, and, if done every two years, they become an almost full-time task for several people. In order to have good trend data, the questions on drug use should remain the same from survey to survey. On the other hand, it is necessary to update the questions when new drugs gain popularity. For example, we recently started asking about crack cocaine and steroids, drugs that were not in use a few years ago. Another consideration is tim- ing the surveys so that the data are al- ways collected at the same time of the year. This is important because drug use is often started by students during vaca- tions and varies considerably from month to month. Also, alcohol use is al- ways highest in the summer and around Christmas.
The sampling systems must also re- main the same so that study subjects are
28
Bulletin
of PAHO 24(l), 1990from essentially the same population in each survey. It is particularly difficult to satisfy this last requirement in school sur- veys, since the school system may be changing quickly, and grade levels, schools, and school districts can be radi- cally different from one data collection to the next. Nevertheless, despite the prob- lems associated with trend studies, they remain the best way to assemble informa- tion on the evolution of drug abuse.
The situation is somewhat different for studies of special populations. These studies are often not repeated, hence avoiding some major problems men- tioned above. They usually are done in more depth, allowing more analysis and interpretation than is possible with sur- veys, although based on smaller sam- ples. One problem with such studies is their representativeness. Most depend upon “snowball” sampling, in which people to be interviewed are suggested by friends or associates known to the in- vestigators or by earlier interviewees. There may also be opportunistic, acci- dental sampling, and hence it cannot be known how well the results reflect those that would be found based on an unbi- ased or random sample. It is often diffi- cult to keep up-to-date with the latest drug fads. For example, soon after the start of a recent longitudinal study of co- caine users, crack cocaine appeared on the scene. The study was modified to in- clude more questions on crack and a sam- ple of crack users large enough to permit a separate analysis.
In summary, taken together, trend sur- veys and special studies carry their own difficulties as well as benefits, and com- plement each other to give a more accu- rate picture of drug abuse patterns.
the school population and some adults, are becoming more cautious about drug use. Much of this change probably relates to the large increase in educational and mass media programs about drugs and to significant attitude changes about drug use.
REFERENCES
1. Smart, R. G., E. M. Adlaf, and M. S. Goodstadt. Alcohol and drug use among Ontario students: An update. Can J Public Health 77~57-58, 1986.
2. Smart, R. G., and E. M. Adlaf. Alcohol and Other Drug Use among Ontario Students in
1987, and Trends since 1977. Toronto, Addic- tion Research Foundation, 1987.
3. Smart, R. G., and G. K. Jarvis. Do self- report studies of drug use really give de- pendable results? Can J Criminol 23:83-92, 1981.
4. Smart, R. G., and E. M. Adlaf. Alcohol and Other Drug Use among Ontario Adults in 1987, and Trends since 1977. Toronto, Addic- tion Research Foundation, 1987.
5. Smart, R. G., and E. M. Adlaf. Alcohol, cannabis, cocaine and other substance abuse among Ontario adults 1977-1987. Can J Public Health 79:206-207, 1988. 6. Erickson, l? E., E. M. Adlaf, G. F. Murray,
and R. E. Smart. The Steel Drug: Cocaine in
Perspective. Lexington, Mass., Lexington Books, 1987.
l4ElO Addresses “Designer Drugs”
A new and dangerous drug abuse problem that has arisen in recent years involves the clandestine synthesis of analogues of substances that are con- trolled under national or international laws. These chemical variants, sometimes called “designer drugs,” are not subject to the same legal con- trols as the parent drugs, since they are technically different drugs. How- ever, they have many of the same effects as the controlled substances and are often highly potent, causing death from overdose. In response to this growing problem, in 1987 WHO recommended the international regula- tion of five analogues of controlled substances (Technical Report Series, No. 761,1988). In April 1989 the 26th WHO Expert Committee on Drug Dependence found evidence that nine other “designer drugs” were also liable to abuse, and recommended their control (Technical Report Series, No. 787,1989). Only strengthened collaboration among nations by the adoption and enforcement of new ad hoc legal measures will restrain the spread of this new menace.
Source: World Health Organization, World Health Forum 10(2):286-287,1989.