BGD
11, 1801–1826, 2014North American
runoff
C. R. Schwalm et al.
Title Page
Abstract Introduction
Conclusions References
Tables Figures
◭ ◮
◭ ◮
Back Close
Full Screen / Esc
Printer-friendly Version Interactive Discussion
Discussion
P
a
per
|
D
iscussion
P
a
per
|
Discussion
P
a
per
|
Discuss
ion
P
a
per
Biogeosciences Discuss., 11, 1801–1826, 2014 www.biogeosciences-discuss.net/11/1801/2014/ doi:10.5194/bgd-11-1801-2014
© Author(s) 2014. CC Attribution 3.0 License.
Open Access
Biogeosciences
Discussions
This discussion paper is/has been under review for the journal Biogeosciences (BG). Please refer to the corresponding final paper in BG if available.
A model–data intercomparison of
simulated runo
ff
in the contiguous United
States: results from the North America
Carbon Regional and Continental
Interim-Synthesis
C. R. Schwalm1, D. N. Huntinzger1,2, R. B. Cook3, Y. Wei3, I. T. Baker4, R. P. Neilson5, B. Poulter6, P. Caldwell7, G. Sun7, H. Q. Tian8, and N. Zeng9
1
School of Earth Sciences and Environmental Sustainability, Northern Arizona University, Flagstaff, AZ 86011, USA
2
Department of Civil Engineering, Construction Management, and Environmental Engineering, Northern Arizona University, Flagstaff, AZ 86011, USA
3
Environmental Sciences Division, Oak Ridge National Laboratory, Oak Ridge, TN 37831, USA
4
Department of Atmospheric Sciences, Colorado State University, Fort Collins, CO 80523, USA
5
Pacific Northwest Research Station, USDA Forest Service, Corvallis, OR 97331, USA 6
BGD
11, 1801–1826, 2014North American
runoff
C. R. Schwalm et al.
Title Page
Abstract Introduction
Conclusions References
Tables Figures
◭ ◮
◭ ◮
Back Close
Full Screen / Esc
Printer-friendly Version Interactive Discussion
Discussion
P
a
per
|
D
iscussion
P
a
per
|
Discussion
P
a
per
|
Discuss
ion
P
a
per
|
7
Southern Research Station, USDA Forest Service, Raleigh, NC 27606, USA 8
International Center for Climate and Global Change Research School of Forestry and Wildlife Sciences, Auburn University, Auburn 36849, AL, USA
9
Department of Atmospheric and Oceanic Science, University of Maryland, College Park, MD 20742, USA
Received: 21 November 2013 – Accepted: 5 January 2014 – Published: 29 January 2014
Correspondence to: C. R. Schwalm ([email protected])
BGD
11, 1801–1826, 2014North American
runoff
C. R. Schwalm et al.
Title Page
Abstract Introduction
Conclusions References
Tables Figures
◭ ◮
◭ ◮
Back Close
Full Screen / Esc
Printer-friendly Version Interactive Discussion
Discussion
P
a
per
|
D
iscussion
P
a
per
|
Discussion
P
a
per
|
Discuss
ion
P
a
per
Abstract
Significant changes in the water cycle are expected under current global environmental change. Robust assessment of these changes at global scales is confounded by shortcomings in the observed record. Modeled assessments yield conflicting results which are linked to differences in model structure and simulation protocol. Here we 5
compare simulated runofffrom six terrestrial biosphere models (TBMs), five reanalysis
products, and one gridded surface station product with observations from a network of stream gauges in the contiguous United States (CONUS) from 2001 to 2005. We evaluate the consistency of simulated runoff with stream gauge data at the CONUS
and water resource region scale, as well as examining similarity across TBMs and
10
reanalysis products at the grid cell scale. Mean runoff across all simulated products
and regions varies widely (range: 71–356 mm yr−1) relative to observed continental-scale runoff (209 mm yr−1). Across all 12 products only two are within 10 % of the
observed value and only four exhibit Nash–Sutcliffe efficiency values in excess of
0.8. Region-level mismatch exhibits a weak pattern of overestimation in western and
15
underestimation in eastern regions; although two products are systematically biased across all regions. In contrast, bias in a temporal sense, within region by water year, is highly consistent. Although gridded composite TBM and reanalysis runoffshow some
regional similarities for 2001–2005 with CONUS means, individual product values are highly variable. To further constrain simulated runoff and to link model-observation 20
mismatch to model structural characteristics would require watershed-level simulation studies coupled with river routing schemes, standardized forcing data, and explicit consideration of water cycle management.
1 Introduction
Water balance calculations are becoming increasingly important for Earth system
25
BGD
11, 1801–1826, 2014North American
runoff
C. R. Schwalm et al.
Title Page
Abstract Introduction
Conclusions References
Tables Figures
◭ ◮
◭ ◮
Back Close
Full Screen / Esc
Printer-friendly Version Interactive Discussion
Discussion
P
a
per
|
D
iscussion
P
a
per
|
Discussion
P
a
per
|
Discuss
ion
P
a
per
|
hydrological cycle (Schwalm et al., 2011) and, more specifically, an increase in runoff
are expected under climate change (Gerten et al., 2008). While attempts have been made to observationally constrain continental to global runofftrends (e.g., using
long-term stream gauge data), observed trends remain unclear (Alkama et al., 2011; Dai et al., 2009; Gerten et al., 2008; Milliman et al., 2008; Walling and Fang, 2003). This
5
ambiguity is linked to spatiotemporal gaps in the observed record (e.g., most long-term records (<50 yr) are from northern European or North American rivers), and the overall heterogeneity of discharge measurements.
A standard approach to address inconsistent observational records is the use of modeling frameworks. However, modeled trends in runoff at global scales are highly 10
variable with both increases (Gedney et al., 2006) and decreases (Shi et al., 2011) in runoff, as well as no significant trend (Alkama et al., 2011), reported. A key
source of this ambiguity is the diversity in how models simulate runoff in relation
to global environmental change, including changes in precipitation, temperature, net radiation, land cover/use, nitrogen deposition, fire regime, atmospheric concentrations
15
of greenhouse gases, and irrigation (Caldwell et al., 2012; Gerten et al., 2008; Neilson, 1995; Sun et al., 2011). Forcing data also plays a significant role in simulated runoff
magnitude with the choice of precipitation dataset alone altering simulated region-scale runoffestimates of up to 30 % (Biemans et al., 2009). Furthermore, uncertainty
in precipitation fields (inter-product spread) may propagate to a similar or greater
20
magnitude of uncertainty in runoffestimates (Fekete et al., 2004).
To resolve the ambiguity in modeled runoff trends such frameworks need to be
validated against observational records. The objective of this study is, within the context of the North American Carbon Program (NACP1), to evaluate a suite of modeled runoff
estimates in a region with a dense network of stream gauges, the water resource
25
regions of the contiguous United States (CONUS). The evaluation of terrestrial biosphere models (TBMs) has been a central part of the NACP Interim-Synthesis activities. Investigations of model skill have focused on interannual variability (Keenan
1
BGD
11, 1801–1826, 2014North American
runoff
C. R. Schwalm et al.
Title Page
Abstract Introduction
Conclusions References
Tables Figures
◭ ◮
◭ ◮
Back Close
Full Screen / Esc
Printer-friendly Version Interactive Discussion
Discussion
P
a
per
|
D
iscussion
P
a
per
|
Discussion
P
a
per
|
Discuss
ion
P
a
per
et al., 2012); seasonality, plant functional type and model structure (Huntzinger et al., 2012; Schaefer et al., 2012; Schwalm et al., 2010); phenology (Richardson et al., 2012); time and frequency patterns of model mismatch (Stoy et al., 2013) and spectral characteristics of model errors (Dietze et al., 2011). One outcome of both the site (Schwalm et al., 2010) and regional (Huntzinger et al., 2012) NACP
Interim-5
Syntheses has been the identification of the need for more integrated land-hydrosphere modeling and research.
In this study we address the need to bridge terrestrial and ocean/coastal research endeavors with regional hydrologic modeling. Here we evaluate simulated runoff
from TBMs by intercomparing estimates of discharge from TBMs, reanalyses, and
10
surface weather stations to observations at United States Geologic Survey (USGS) stream gauge stations. Given the lack of a general framework for integration of land-water carbon dynamics into models, this is a critical first step for linking terrestrial carbon/hydrology models with river, estuary, and ocean data and models.
2 Data and methods
15
We compare observed runoff from stream gauges to modeled runoff from six
TBMs, five reanalysis products, and one gridded product based on surface station meteorology. Observed runoff is based on ca. 7400 continuously monitored stream
gauges maintained by the USGS2. This network of stream gauges is divided by hydrologic unit codes (HUC3) using a standardized six-level nested hierarchy that,
20
nationally for the United States, varies from 21 water resource regions (WRR) at level one to ca. 160 000 subwatersheds at level six4. For this study the 18 WRRs in the CONUS domain (Fig. 1) and total CONUS runoff are used as bases of comparison
with USGS stream gauge data.
2
http://waterwatch.usgs.gov 3
http://water.usgs.gov/GIS/huc.html 4
BGD
11, 1801–1826, 2014North American
runoff
C. R. Schwalm et al.
Title Page
Abstract Introduction
Conclusions References
Tables Figures
◭ ◮
◭ ◮
Back Close
Full Screen / Esc
Printer-friendly Version Interactive Discussion
Discussion
P
a
per
|
D
iscussion
P
a
per
|
Discussion
P
a
per
|
Discuss
ion
P
a
per
|
The gridded (1◦spatial resolution; 10–84◦N, 50–170◦W) TBM runoffvalues (Table 1)
are taken from NACP Regional and Continental Interim-Synthesis (RCIS; Huntzinger et al., 2012), as well as an additional TBM, WaSSI, which simulated the same spatiotemporal domain as the RCIS but, not gridded, at the watershed level. The TBM simulations, an ensemble of opportunity, are comprised of model output generated
5
from ongoing NACP and related studies, and therefore were not generated with a standardized protocol across runs or models. While this precludes an assessment of structural uncertainty, it better mimics current practice as each model run represents the “best estimate” of runofffor each respective model.
In addition to the TBMs, we also evaluate runoff derived from reanalysis products 10
(Table 1). Focusing on the CONUS domain, we use runoff(calculated as the sum of
the non-infiltrating surface runoff and subsurface baseflow fields) from the National
Center for Environmental Prediction (NCEP) North American Regional Reanalysis product (NARR; Mesinger et al., 2006); a reanalysis explicitly designed to create a long-term set of consistent climate data on a regional scale for the North American
15
domain. In addition to analyzing native NARR runoffwe also calculate runoffas NARR
precipitation minus NARR evapotranspiration (hereafter NARR [P −E]) and as scaled NARR precipitation minus NARR evapotranspiration (hereafter NARR [GPCP]). In the latter case NARR precipitation is rescaled using Global Precipitation Climatology Project (GPCP v2.1) data (Huffman et al., 2009). The rescaling strategy is to maintain 20
the spatial and temporal pattern of NARR precipitation but adjust the total precipitation amount to match observed GPCP total precipitation. We complement these three NARR-based estimates with the NASA Modern Era Reanalysis for Research and Applications product (MERRA; Rienecker et al., 2011) and MERRA LAND (Reichle et al., 2011), an off-line land-only replay of the MERRA land model with precipitation 25
BGD
11, 1801–1826, 2014North American
runoff
C. R. Schwalm et al.
Title Page
Abstract Introduction
Conclusions References
Tables Figures
◭ ◮
◭ ◮
Back Close
Full Screen / Esc
Printer-friendly Version Interactive Discussion
Discussion
P
a
per
|
D
iscussion
P
a
per
|
Discussion
P
a
per
|
Discuss
ion
P
a
per
version5. For both MERRA variants, runoff is given by the sum of the runoff and
baseflow variables. Complementing the base NARR with two NARR-variants as well as MERRA and MERRA LAND extends the suite of reanalyses (all 1◦spatial resolution) to the third generation and allows consistency across multiple reanalyses to be quantified. We also use an estimate of runoffderived from monthly water-budget fields (Table 1) 5
calculated by the Center for Climatic Research, Department of Geography at the University of Delaware6. This estimate (hereafter UDel) is based on gridded surface station records of temperature and precipitation. Both are first interpolated in space using Shepard’s method and in time using climatologically aided interpolation (Willmott and Robeson, 1995). These interpolated estimates are then used as inputs in
10
a modified Thornthwaite water-budget equation, assuming a soil water holding capacity of 150 mm, to estimate evapotranspiration (Willmot et al., 1985). Evapotranspiration is subtracted from precipitation to estimate runoff(1◦ spatial resolution). Of all modeled
products UDel is the most empirical and is based on readily available data. Its inclusion here allows us to evaluate the trade-offbetween consistency and ease of initialization 15
relative to more computationally expensive TBMs and reanalysis products.
Before analysis, runoff is aggregated to annual values on a water year basis
(October–September) from 2001 to 2005. We chose annual values as none of the TBM runs evaluated here used river routing schemes. Such a scheme tracks the lateral movement of water at finer (sub-yearly) time steps from grid cell to grid
20
cell while accounting for gradients in geomorphology and, where applicable, water cycle management. The absence of river routing precludes an analysis of smaller catchments and sub-yearly timescales as the TBM runs evaluated here effectively
discharge all runoffinto the ocean immediately.
After integration in time, runoff is spatially aggregated. For the comparison 25
using WRRs modeled runoff is aggregated to the relevant region (Fig. 1); for the
5
http://gmao.gsfc.nasa.gov/research/merra/merra-land.php 6
BGD
11, 1801–1826, 2014North American
runoff
C. R. Schwalm et al.
Title Page
Abstract Introduction
Conclusions References
Tables Figures
◭ ◮
◭ ◮
Back Close
Full Screen / Esc
Printer-friendly Version Interactive Discussion
Discussion
P
a
per
|
D
iscussion
P
a
per
|
Discussion
P
a
per
|
Discuss
ion
P
a
per
|
CONUS-wide analysis, aggregation is across all WRRs. In addition to comparing observed and modeled runoff, we also compare TBMs (except WaSSI) and reanalysis
products (including UDel) to each other at the 1◦ grid cell scale. We quantify model skill using bias and Nash–Sutcliffe efficiencies (Nash and Sutcliffe, 1970); the latter
metric ranges from negative infinity to unity where unity indicates perfect model–data
5
agreement.
3 Results
The reanalysis and UDel runoff values are in poor agreement with observed
continental-scale runoff(Fig. 2). Relative to the average CONUS stream gauge runoff
of 209 mm yr−1, mean modeled runoff from 2001 to 2005 is 166 and 298 mm yr−1 for 10
the reanalyses and UDel respectively. In a relative sense, the reanalysis products underestimate CONUS runoff by ca. 25 % while the annual runoff derived from the
UDel product is almost 1.5 times greater than observed. In contrast, the mean value across all six TBMs is within 25 % (261 mm yr−1) of average stream gauge runoff. The
mean and median values across all 12 modeled runoffestimates (224 and 236 mm yr−1 15
respectively) are, typical of ensemble estimates in general, more consistent with observations than individual products except DLEM, MC1, and NARR [P−E] (Fig. 2). In addition to being less consistent with observations, the variability (standard deviation: 94 mm yr−1) of reanalysis estimates is also ca. 1.75 times greater than for TBMs (54 mm yr−1).
20
Normalizing runoff by precipitation does decrease interannual variability for
all estimated products except SiB3.1 (Fig. 2). However, the general pattern of overestimation vs. underestimation remains largely unchanged (Fig. 2); only SiB3.1 and WaSSI show changes in consistency. This result is however subjective as, unlike all modeled products, there is no natural precipitation analogue to pair with USGS
25
BGD
11, 1801–1826, 2014North American
runoff
C. R. Schwalm et al.
Title Page
Abstract Introduction
Conclusions References
Tables Figures
◭ ◮
◭ ◮
Back Close
Full Screen / Esc
Printer-friendly Version Interactive Discussion
Discussion
P
a
per
|
D
iscussion
P
a
per
|
Discussion
P
a
per
|
Discuss
ion
P
a
per
Centre Full Data Reanalysis (GPCC7; Schneider et al., 2011) of monthly global land surface precipitation. Given the small changes in consistency and the ambiguity inherent in choosing the matching precipitation product for USGS data when calculating runoff/precipitation ratios, we limit our discussion of mismatch to runoffonly.
The region level mismatch between stream gauge and modeled runoff suggests 5
a weak geographic divide; WRRs east of and including the Mississippi river are generally underestimated whereas western WRRs are overpredicted (Fig. 3). However, SLand systematically overpredicts all regions. The remaining TBMs also show a tendency toward positive biases, especially in the Rio Grande and Lower Colorado WRRs where SiB3.1 overestimates both by a factor of ca. 7 (Fig. 3). Among the
10
reanalysis and UDel products, MERRA underestimates runoff in every WRR while
UDel overestimates all but two (New England and Mid-Atlantic). Furthermore, there is no relationship between mismatch and WRR size (not shown).
The weak east-west pattern suggests that water cycle management may degrade consistency with USGS stream gauge observations (sensu Caldwell et al., 2012).
15
Ideally, estimates of naturalized flow (Kim and Wurbs, 2011) would augment USGS depleted flows as a comparator. However, these estimates are model-based and not available for the WRRs and analysis period considered here. As such, we investigate this possible dependency using an index of water cycle management intensity based on 2005 gross withdrawals (taken from Caldwell et al., 2012) normalized by mean
20
annual USGS stream gauge runoff from 2001 to 2005. Using this index we find that
there is no coherent relationship between water cycle management and mismatch. Only the reanalysis products and SLand exhibit a dependency between mismatch and the index of management intensity (Fig. 4). Despite significant relative biases by WRR (Fig. 3) and the use of depleted USGS runoff, four of the six TBMs (none of which 25
consider water cycle management in the runs evaluated here) exceed the customary
7
BGD
11, 1801–1826, 2014North American
runoff
C. R. Schwalm et al.
Title Page
Abstract Introduction
Conclusions References
Tables Figures
◭ ◮
◭ ◮
Back Close
Full Screen / Esc
Printer-friendly Version Interactive Discussion
Discussion
P
a
per
|
D
iscussion
P
a
per
|
Discussion
P
a
per
|
Discuss
ion
P
a
per
|
NSE threshold for “good” model–data agreement (≥0.8): DLEM, LPJ-wsl, SiB3.1, and WaSSI (Fig. 4).
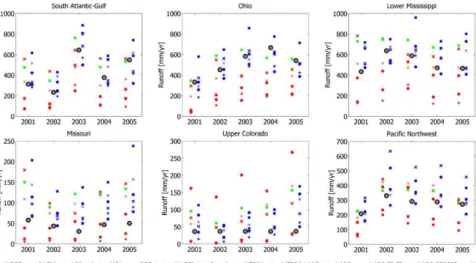
Mapping region-level 5 yr averages to individual water years shows that over- or underestimation relative to stream gauge runoff is generally consistent in time. For
the six representative regions shown (Fig. 5) there is no obvious pattern when an
5
overestimate changes to an underestimate or vice versa. More generally, across 216 combinations (18 WRRs×12 data products), 152 (70 %) exhibit exclusively under- (60) or overpredicted (92) stream gauge runoffover the 2001 to 2005 analysis period. The
New England, South Atlantic-Gulf, Ohio, Tennessee, and Upper Mississippi regions have the lowest consistency with 7 of 12 products. In contrast, the Missouri region
10
shows the highest degree of consistency, 11 of 12 products.
While mean gridded runofffrom TBMs and reanalysis products (including UDel) are
within 4 mm month−1 or ca. 20 % (22 and 18 mm month−1 for TBMs and reanalysis respectively), these composite values mask highly variable individual product estimates of runoff and spatial gradients in grid cell level differences (Fig. 5). Across the Great 15
Plains and western CONUS both TBMs and reanalysis products show similar means. However, six eastern WRRs (Lower Mississippi, Ohio, Tennessee, South Atlantic-Gulf, Mid-Atlantic, and New England) and the lower Great Lakes regions are not in agreement, with TBMs simulating more runoffthan reanalysis products and UDel. The
spread in reanalysis runoff (coefficient of variation) averages 66 % in space with the 20
highest values in the Southwest (Fig. 5). TBMs also exhibit a large degree of spread (mean coefficient of variation: 53 %) with the largest variability in pockets across the
Mountain West.
4 Discussion
This study provides an evaluation of continental, WRR, and grid cell-scale surface
25
annual runoff in the CONUS domain from 2001 to 2005. Temporally, overestimations
BGD
11, 1801–1826, 2014North American
runoff
C. R. Schwalm et al.
Title Page
Abstract Introduction
Conclusions References
Tables Figures
◭ ◮
◭ ◮
Back Close
Full Screen / Esc
Printer-friendly Version Interactive Discussion
Discussion
P
a
per
|
D
iscussion
P
a
per
|
Discussion
P
a
per
|
Discuss
ion
P
a
per
At the region-scale, the 12 data products are consistent in their lack of agreement with stream gauge values. There is neither a coherent spatial pattern across WRRs, nor a region where all products exhibit a uniformly high (or low) level of consistency with stream gauge data. General agreement is seen only at the grid cell level in composite means (averages across all TBMs or reanalysis products) west of the
5
Mississippi, but individual products are highly variable. Given the homogeneity of model–data consistency in time but substantial inter-product spread across all 12 modeled runoff estimates, we use mean CONUS-wide stream gauge runoff to place
modeled estimates into three generic tiers based on model skill.
The first tier products consist of solely TBMs: DLEM, LPJ-wsl, MC1, SiB3.1, and
10
WaSSI. The two products closest (within 10 %) to CONUS-wide stream gauge runoff
(DLEM and MC1) are both TBMs. Furthermore, of the six products with the smallest CONUS-wide bias five are TBMs. Here caution is warranted as TBM predictions, while on average closer to observations than reanalysis products, still show significant bias (mean bias of 52 mm yr−1) and vary widely (range: 200–356 mm yr−1). Despite this,
15
the only products exhibiting “good” consistency (NSE≥0.8) with USGS observations are all first-tier TBMs (DLEM, LPJ-wsl, SiB3.1, WaSSI). This “good” consistency is counterintuitive as significant water cycle management occurs across the CONUS which is reflected in depleted USGS flows but is absent from the TBM runs evaluated. The case of SiB3.1 is instructive as this TBM, in line with others in this tier, exhibits high
20
NSE and small bias with the exception of the Rio Grande and Lower Colorado River WRRs which are extensively managed and where SiB3.1 predictions are biased high by a factor of 7.
Given that water cycle management reduces discharge through inter alia human-induced evapotranspiration, runoff lost to fill surface reservoirs water, or interbasin 25
transfer, a positive bias is expected when models do not include human management of the water cycle. However, this systematic offset does not translate into larger biases
BGD
11, 1801–1826, 2014North American
runoff
C. R. Schwalm et al.
Title Page
Abstract Introduction
Conclusions References
Tables Figures
◭ ◮
◭ ◮
Back Close
Full Screen / Esc
Printer-friendly Version Interactive Discussion
Discussion
P
a
per
|
D
iscussion
P
a
per
|
Discussion
P
a
per
|
Discuss
ion
P
a
per
|
runoff are significant, or a combination of both. As an example of anthropogenic
runoffincrease, ground water mining can act to increase runoff if the mined water is
discharged into surface water and the aquifer source is not connected to surface water (Caldwell et al., 2012).
The second tier of model skill is occupied by those estimates based on precipitation
5
minus evapotranspiration: UDel, NARR [P −E], and NARR [GPCP]. As these also exhibit positive biases, the same caveats concerning water cycle management apply. For example, the largest positive biases for this tier are in the Rio Grande and Lower Colorado regions, similar to the first tier of products. These WRRs are both heavily managed and, typical of the Southwest in general, highly sensitive to withdrawals
10
(Caldwell et al., 2012). Despite this clear bias, precipitation minus evapotranspiration estimates offer reasonable skill levels (e.g., NSE range: 0.58–0.76). Compared to
TBMs, which require substantial infrastructure to implement and run, precipitation minus evapotranspiration is trivial to estimate using readily accessible data products suggesting utility in large-scale diagnostic runoffstudies.
15
The lowest tier consisting of pure reanalysis (MERRA, MERRA LAND, and NARR) and SLand exhibits little to no skill; with the three reanalysis products biased low. Furthermore, there is no tendency for reanalysis products to better replicate stream gauge observations. This finding is unexpected because runoff is based on the
formal assimilation of millions of observations (but not runoff for NARR or either 20
MERRA variant). The underestimation by NARR has been previously documented using both CONUS River Forecast Center regions (Sheffield et al., 2012) and the
Mississippi River basin (Kumar and Merwade, 2011). In contrast, both MERRA variants have shown higher model skill relative to USGS data (Reichle et al., 2011) than in this study. Methodological differences in evaluating MERRA and MERRA LAND skill 25
(scale mismatch of watersheds, naturalized vs. depleted flow as comparator, different
score metrics, different temporal extent and granularity) preclude reconciliation of
BGD
11, 1801–1826, 2014North American
runoff
C. R. Schwalm et al.
Title Page
Abstract Introduction
Conclusions References
Tables Figures
◭ ◮
◭ ◮
Back Close
Full Screen / Esc
Printer-friendly Version Interactive Discussion
Discussion
P
a
per
|
D
iscussion
P
a
per
|
Discussion
P
a
per
|
Discuss
ion
P
a
per
of water cycle management (Fig. 4), explicitly incorporating water cycle management would likely act to increase the magnitude of underestimation for the reanalysis products. Resolving the systematic bias in the reanalysis estimates shown here will require further investigation of, especially for NARR, the known high bias in evapotranspiration (Sheffield et al., 2012) and point-based validation runs of the land 5
surface schemes embedded in the reanalysis (Kumar and Merwade, 2011), ideally with an unambiguous ground truth.
5 Conclusions
The TBMs are, in general, able to reproduce observed tends in CONUS-wide runoff
over the 2001–2005 analysis period. However, several products exhibit profound biases
10
and spatial heterogeneity in model skill. Diagnosing mismatch between stream gauge runoff and any given data product is confounded by the coarse scale of TBM and
reanalysis products used here as well as the off-the-shelf nature of the TBM runs.
Runoff is fundamentally a process that occurs on the catchment scale and multiple
catchments within a large WRR may act in a compensatory manner that is not
15
resolvable at a 1◦ spatial resolution or regional scale. Similarly, mismatch may also be influenced by the choice of forcing data used in a particular TBM. As such it is difficult to attribute differences between simulated and observed values solely to
intrinsic characteristics of the models themselves.
A further complication is the tendency of several products, especially the TBMs,
20
to exhibit “good” consistency despite not including water cycle management, i.e., the “right answers for the wrong reasons” (Kirchner, 2006). This can be related to model formation, e.g., bulk parameters compensating for a lack of physically-based equations at relevant scales (Kirchner, 2006), or overall complexity in large heterogeneous systems at coarser scales as studied here (McDonnell et al., 2007). In general, efforts 25
to reduce mismatch between modeled estimates and observed stream gauge runoff
BGD
11, 1801–1826, 2014North American
runoff
C. R. Schwalm et al.
Title Page
Abstract Introduction
Conclusions References
Tables Figures
◭ ◮
◭ ◮
Back Close
Full Screen / Esc
Printer-friendly Version Interactive Discussion
Discussion
P
a
per
|
D
iscussion
P
a
per
|
Discussion
P
a
per
|
Discuss
ion
P
a
per
|
higher quality data on water withdrawals (Caldwell et al., 2012), and river routing schemes. Large-resource model-intercomparison projects that use a constrained protocol (Huntzinger et al., 2013) hold great promise in furthering our understanding of runoffdynamics at multiple scales.
Acknowledgements. Support for this activity came from the US National Aeronautics and
5
Space Administration (NASA) Terrestrial Ecology Program (NNH10AN68I and NNX11AO08A) and from the Terrestrial Ecosystem Science Focus Area at the Office of Biological
and Environmental Research, US Department of Energy (DOE). Oak Ridge National Laboratory is managed by UT- Battelle for DOE under contract DE-AC05-00OR22725. IB was sponsored by the National Science Foundation (NSF) (ATM-0425247,
AGS-0425247-10
13 and AGS1049041), the Department of Commerce/National Oceanic and Atmospheric Administration (NA08AR4320893), NASA (NNX06AC75G, NNX08AM56G, NNX12AP86G, NNX10AT41G, and NNX11AB87G), DOE (DE-FG02-06ER64317), and the National Institute for Climate Change Research (MTU050516Z14). PC and GS were partially supported by the NSF EaSM program (AGS-1049200) at North Carolina State University. HT was supported by
15
the NASA Interdisciplinary Science Program (NNX11AD47G and NNX10AU06G). We thank Mac Post for his contributions to this research. This is a contribution of the North American Carbon Program.
References
Alkama, R., Decharme, B., Douville, H., and Ribes, A.: Trends in global and basin-scale runoff 20
over the late twentieth century: methodological issues and sources of uncertainty, J. Climate, 24, 3000–3014, doi:10.1175/2010JCLI3921.1, 2011.
Bachelet, D., Lenihan, J. M., Daly, C., Neilson, R. P., Ojima, D. S., and Parton, W. J.: MC1: a dynamic vegetation model for estimating the distribution of vegetation and associated carbon, nutrients, and water-technical documentation, Department of Agriculture, Forest
25
Service, Pacific Northwest Research Station, Portland, OR, US, Version 1.0, Gen. Tech. Rep. PNW-GTR-508, 95 pp., 2001.
Baker, I. T., Denning, A. S., and Stockli, R.: North American gross primary productivity: regional characterization and interannual variability, Tellus B, 62, 533–549, doi:10.1111/j.1600-0889.2010.00492.x, 2010.
BGD
11, 1801–1826, 2014North American
runoff
C. R. Schwalm et al.
Title Page
Abstract Introduction
Conclusions References
Tables Figures
◭ ◮
◭ ◮
Back Close
Full Screen / Esc
Printer-friendly Version Interactive Discussion
Discussion
P
a
per
|
D
iscussion
P
a
per
|
Discussion
P
a
per
|
Discuss
ion
P
a
per
Biemans, H., Hutjes, R., Kabat, P., Strengers, B., Gerten, D., and Rost, S.: Impacts of precipitation uncertainty on discharge calculations for main river basins, J. Hydrometeorol., 10, 1011–1025, 2009.
Caldwell, P. V., Sun, G., McNulty, S. G., Cohen, E. C., and Moore Myers, J. A.: Impacts of impervious cover, water withdrawals, and climate change on river flows in the conterminous
5
US, Hydrol. Earth Syst. Sci., 16, 2839–2857, doi:10.5194/hess-16-2839-2012, 2012. Chen, M., Xie, P., Janowiak, J. E., and Arkin, P. A.: Global land precipitation: a 50-yr monthly
analysis based on gauge observations, J. Hydrometeorol., 3, 249–266, 2002.
Dai, A., Qian, T., Trenberth, K. E., and Milliman, J. D.: Changes in continental freshwater discharge from 1948–2004, J. Climate, 22, 2773–2791, 2009.
10
Dietze, M. C., Vargas, R., Richardson, A. D., Stoy, P. C., Barr, A. G., Anderson, R. S., Arain, M. A., Baker, I. T., Black, T. A., Chen, J. M., Ciais, P., Flanagan, L. B., Gough, C. M., Grant, R. F., Hollinger, D., Izaurralde, R. C., Kucharik, C. J., Lafleur, P., Liu, S., Lokupitiya, E., Luo, Y., Munger, J. W., Peng, C., Poulter, B., Price, D. T., Ricciuto, D. M., Riley, W. J., Sahoo, A. K., Schaefer, K., Suyker, A. E., Tian, H., Tonitto, C., Verbeeck, H., Verma, S. B.,
15
Wang, W., and Weng, E.: Characterizing the performance of ecosystem models across time scales: a spectral analysis of the North American Carbon Program site-level synthesis, J. Geophys. Res., 116, G04029, doi:10.1029/2011JG001661, 2011.
Fekete, B. M., Vörösmarty, C. J., Roads, J. O., and Willmott, C. J.: Uncertainties in precipitation and their impacts on runoffestimates, J. Climate, 17, 294–304, 2004.
20
Gedney, N., Cox, P. M., Betts, R. A., Boucher, O., Huntingford, C., and Stott, P. A.: Detection of a direct carbon dioxide effect in continental river runoffrecords, Nature, 439, 835–838, 2006.
Gerten, D., Schaphoff, S., Haberlandt, U. Lucht, W., and Sitch, S.: Terrestrial vegetation and
water balance – hydrological evaluation of a dynamic global vegetation model, J. Hydrol., 286, 249–270, 2004.
25
Gerten, D., Rost, S., von Bloh, W., and Lucht, W.: Causes of change in 20th century global river discharge, Geophys. Res. Lett., 35, L20405, doi:10.1029/2008GL035258, 2008.
Huffman, G. J., Adler, R. F., Bolvin, D. T., and Gu, G.: Improving the global precipitation record:
GPCP Version 2.1, Geophys. Res. Lett., 36, L17808, doi:10.1029/2009GL040000, 2009. Huntzinger, D. N., Post, W., Michalak, A., Wei, Y., Jacobson, A., West, T. O., Baker, I.,
30
Chen, J., Davis, K., Hayes, D., Hoffman, F., Jain, A., Liu, S., McGuire, D., Neilson, R.,
BGD
11, 1801–1826, 2014North American
runoff
C. R. Schwalm et al.
Title Page
Abstract Introduction
Conclusions References
Tables Figures
◭ ◮
◭ ◮
Back Close
Full Screen / Esc
Printer-friendly Version Interactive Discussion
Discussion
P
a
per
|
D
iscussion
P
a
per
|
Discussion
P
a
per
|
Discuss
ion
P
a
per
|
Synthesis: terrestrial biospheric model intercomparison: Ecol. Model., 232, 144–157. doi:10.1016/j.ecolmodel.2012.02.004, 2012.
Huntzinger, D. N., Schwalm, C., Michalak, A. M., Schaefer, K., King, A. W., Wei, Y., Jacobson, A., Liu, S., Cook, R. B., Post, W. M., Berthier, G., Hayes, D., Huang, M., Ito, A., Lei, H., Lu, C., Mao, J., Peng, C. H., Peng, S., Poulter, B., Riccuito, D., Shi, X., Tian, H.,
5
Wang, W., Zeng, N., Zhao, F., and Zhu, Q.: The North American Carbon Program Multi-scale synthesis and Terrestrial Model Intercomparison Project – Part 1: Overview and experimental design, Geosci. Model Dev. Discuss., 6, 3977–4008, doi:10.5194/gmdd-6-3977-2013, 2013. Kanamitsu, M., Ebisuzaki, W., Woollen, J., Yang, S.-K., Hnilo, J. J., Fiorino, M., and Potter, G. L.:
NCEP-DOE AMIP-II Reanalysis (R-2), B. Am. Meteorol. Soc., 83, 1631–1643, 2002.
10
Keenan, T. F., Baker, I., Barr, A., Ciais, P., Davis, K., Dietze, M., Dragoni, D., Gough, C. M., Grant, R., Hollinger, D., Hufkens, K., Poulter, B., McCaughey, H., Raczka, B., Ryu, Y., Schaefer, K., Tian, H., Verbeeck, H., Zhao, M., and Richardson, A. D.: Terrestrial biosphere model performance for inter-annual variability of land–atmosphere CO2 exchange, Glob. Change Biol., 18, 1971–1987, doi:10.1111/j.1365-2486.2012.02678.x, 2012.
15
Kim, T. J. and Wurbs, R. A.: Development of monthly naturalized flow using Water Rights Analysis Package (WRAP)-based methods, KSCE Journal of Civil Engineering, 15, 1299– 1307, doi:10.1007/s12205-011-1184-y, 2011.
Kirchner, J. W.: Getting the right answers for the right reasons: linking measurements, analyses, and models to advance the science of hydrology, Water Resour. Res., 42, W03S04,
20
doi:10.1029/2005WR004362, 2006.
Koster, R. D., Suarez, M. J., Ducharne, A., Stieglitz, M., and Kumar, P.: A catchment-based approach to modeling land surface processes in a general circulation model. 1. Model structure, J. Geophys. Res., 105, 24809–24822, 2000.
Kumar, S. and Merwade, V.: Evaluation of NARR and CLM3.5 outputs for surface water
25
and energy budgets in the Mississippi River Basin, J. Geophys. Res., 116, D08115, doi:10.1029/2010JD014909, 2011.
Liu, M., Tian, H., Lu, C., Xu, X., Chen, G., and Ren, W.: Effects of multiple environment
stresses on evapotranspiration and runoffover the Eastern China, J. Hydrol., 426–427, 39–
54, doi:10.1016/j.jhydrol.2012.01.009, 2012.
30
BGD
11, 1801–1826, 2014North American
runoff
C. R. Schwalm et al.
Title Page
Abstract Introduction
Conclusions References
Tables Figures
◭ ◮
◭ ◮
Back Close
Full Screen / Esc
Printer-friendly Version Interactive Discussion
Discussion
P
a
per
|
D
iscussion
P
a
per
|
Discussion
P
a
per
|
Discuss
ion
P
a
per
process complexity: a new vision for watershed hydrology, Water Resour. Res., 43, W07301, doi:10.1029/2006WR005467, 2007.
Mesinger, F., DiMego, G., Kalnay, E., Mitchell, K., Shafran, P. C., Ebisuzaki, W., Jović, D.,
Woollen, J., Rogers, E., Berbery, E. H., Ek, M. B., Fan, Y., Grumbine, R., Higgins, W., Li, H., Manikin, G., Parrish, D., and Shi, W.: North American regional reanalysis, B. Am. Meteorol.
5
Soc., 87, 343–360, 2006.
Milliman, J. D., Farnsworth, K. L., Jones, P. D., Xu, K. H., and Smith, L. C.: Climatic and anthropogenic factors affecting river discharge to the global ocean, 1951–2000, Global
Planet. Change, 62, 187–194, 2008.
Nash, J. and Sutcliffe, J. V.: River flow forecasting through conceptual models part I – 10
a discussion of principles, J. Hydrol., 10, 282–290, 1970.
Neilson, R. P.: A model for predicting continental-scale vegetation distribution and water balance, Ecol. Appl., 5, 362–385, doi:10.2307/1942028, 1995.
Richardson, A. D., Anderson, R. S., Arain, M. A., Barr, A. G., Bohrer, G., Chen, G., Chen, J. M., Ciais, P., Davis, K. J., Desai, A. R., Dietze, M. C., Dragoni, D., Garrity, S. R., Gough, C. M.,
15
Grant, R., Hollinger, D. Y., Margolis, H. A., McCaughey, H., Migliavacca, M., Monson, R. K., Munger, J. W., Poulter, B., Raczka, B. M., Ricciuto, D. M., Sahoo, A. K., Schaefer, K., Tian, H., Vargas, R., Verbeeck, H., Xiao, J., and Xue, Y.: Terrestrial biosphere models need better representation of vegetation phenology: results from the North American Carbon Program Site Synthesis, Glob. Change Biol., 18, 566–584, 2012.
20
Reichle, R. H., Koster, R. D., De Lannoy, G. J. M., Forman, B. A., Liu, Q., Mahanama, S. P. P., and Touré, A.: Assessment and enhancement of MERRA land surface hydrology estimates, J. Climate, 24, 6322–6338, doi:10.1175/JCLI-D-10-05033.1, 2011.
Rienecker, M. M., Suarez, M. J., Gelaro, R., Todling, R., Bacmeister, J., Liu, E., Bosilovich, M. G., Schubert, S. D., Takacs, L., Kim, G.-K., Bloom, S., Chen, J., Collins, D., Conaty, A.,
25
da Silva, A., Gu, W., Joiner, J., Koster, R. D., Lucchesi, R., Molod, A., Owens, T., Pawson, S., Pegion, P., Redder, C. R., Reichle, R., Robertson, F. R., Ruddick, A. G., Sienkiewicz, M., and Woollen, J.: MERRA – NASA’s Modern-Era Retrospective Analysis for Research and Applications, J. Climate, 24, 3624–3648, 2011.
Schaake, J. C., Koren, V. I., Duan, Q.-Y., Mitchell, K., and Chen, F.: Simple water balance
30
model for estimating runoffat different spatial and temporal scales, J. Geophys. Res., 101,
BGD
11, 1801–1826, 2014North American
runoff
C. R. Schwalm et al.
Title Page
Abstract Introduction
Conclusions References
Tables Figures
◭ ◮
◭ ◮
Back Close
Full Screen / Esc
Printer-friendly Version Interactive Discussion
Discussion
P
a
per
|
D
iscussion
P
a
per
|
Discussion
P
a
per
|
Discuss
ion
P
a
per
|
Schaefer, K. M., Schwalm, C. R., Williams, C. A., Altaf Arain, M., Barr, A., Chen, J. M., Davis, K. J., Dimitrov, D., Hilton, T. W., Hollinger, D. Y., Humphreys, E., Poulter, B., Raczka, B. M., Richardson, A. D., Sahoo, A., Thornton, P., Vargas, R., Verbeeck, H., Anderson, R., Baker, I., Black, T. A., Bolstad, P., Chen, J., Curtis, P. S., Desai, A. R., Dietze, M., Dragoni, D., Gough, C., Grant, R. F., Gu, L., Jain, A., Kucharik, C., Law, B., Liu, S., Lokipitiya, E.,
5
Margolis, H. A., Matamala, R., McCaughey, J. H., Monson, R., Munger, J. W., Oechel, W., Peng, C., Price, D. T., Ricciuto, D., Riley, W. J., Roulet, N., Tian, H., Tonitto, C., Torn, M., Weng, E., and Zhou, X.: A model–data comparison of gross primary productivity: results from the North American Carbon Program site synthesis, J. Geophys. Res., 117, G03010, doi:10.1029/2012JG001960, 2012.
10
Sheffield, J., Livneh, B., and Wood, E. F.: Representation of terrestrial hydrology and large-scale
drought of the continental United States from the North American Regional Reanalysis, J. Hydrometeorol., 13, 856–876, doi:10.1175/JHM-D-11-065.1, 2012.
Schneider, U., Becker, A., Finger, P., Meyer-Christoffer, A., Rudolf, B., and Ziese, M.: GPCC Full
Data Reanalysis Version 6.0 at 1.0◦
: Monthly Land-Surface Precipitation from Rain-Gauges
15
built on GTS-based and Historic Data, doi:10.5676/DWD_GPCC/FD_M_V6_100, 2011. Schwalm, C. R., Williams, C. A., Schaefer, K., Anderson, R., Arain, M. A., Baker, I., Barr, A.,
Black, T. A., Chen, G., Chen, J. M., Ciais, P., Davis, K. J., Desai, A., Dietze, M., Dragoni, D., Fischer, M. L., Flanagan, L. B., Grant, R., Gu, L., Hollinger, D., Izaurralde, R. C., Kucharik, C., Lafleur, P., Law, B. E., Li, L., Li, Z., Liu, S., Lokupitiya, E., Luo, Y., Ma, S., Margolis, H.,
20
Matamala, R., McCaughey, H., Monson, R. K., Oechel, W. C., Peng, C., Poulter, B., Price, D. T., Riciutto, D. M., Riley, W., Kumar Sahoo, A., Sprintsin, M., Sun, J., Tian, H., Tonitto, C., Verbeeck, H., and Verma, S. B.: A model–data intercomparison of CO2exchange across North America: results from the North American Carbon Program site synthesis, J. Geophys. Res., 115, G00H05, doi:10.1029/2009JG001229, 2010.
25
Schwalm, C. R., Williams, C. A., and Schaefer, K. M.: Carbon consequences of global hy-drologic change, 1948–2009, J. Geophys. Res., 116, G03042, doi:10.1029/2011JG001674, 2011.
Shi, X., Mao, J., Thornton, P. E., Hoffman, F. M., and Post, W. M.: The impact of climate,
CO2, nitrogen deposition and land use change on simulated contemporary global river flow,
30
Geophys. Res. Lett., 38, L08704, doi:10.1029/2011GL046773, 2011.
BGD
11, 1801–1826, 2014North American
runoff
C. R. Schwalm et al.
Title Page
Abstract Introduction
Conclusions References
Tables Figures
◭ ◮
◭ ◮
Back Close
Full Screen / Esc
Printer-friendly Version Interactive Discussion
Discussion
P
a
per
|
D
iscussion
P
a
per
|
Discussion
P
a
per
|
Discuss
ion
P
a
per
Hollinger, D. Y., Izaurralde, R. C., Kucharik, C. J., Lafleur, P., Law, B. E., Liu, S., Lokupitiya, E., Luo, Y., Munger, J. W., Peng, C., Poulter, B., Price, D. T., Ricciuto, D. M., Riley, W. J., Sahoo, A. K., Schaefer, K., Schwalm, C. R., Tian, H., Verbeeck, H., and Weng, E.: Evaluating the agreement between measurements and models of net ecosystem exchange at different
times and timescales using wavelet coherence: an example using data from the North
5
American Carbon Program Site-Level Interim Synthesis, Biogeosciences, 10, 6893–6909, doi:10.5194/bg-10-6893-2013, 2013.
Sun, G., Caldwell, P., Noormets, A., Cohen, E., McNulty, S. G., Treasure, E., Domec, J.-C., Mu, Q., Xiao, J., John, R., and Chen, J.: Upscaling key ecosystem functions across the Conterminous United States by a water-centric ecosystem model, J. Geophys. Res., 116,
10
G00J05, doi:10.1029/2010JG001573, 2011.
Tian, H., Chen, G., Liu, M., Zhang, C., Sun, G., Lu, C., Xu, X., Ren, W., Pan, S., and Chappelka, A.: Model estimates of ecosystem net Primary productivity, evapotranspiration, and water use efficiency in the southern United States during 1895–2007, Forest Ecol.
Manag., 259, 1311–1327, doi:10.1016/j.foreco.2009.10.009, 2010.
15
Walling, D. E. and Fang, D.: Recent trends in the suspended sediment loads of the world’s rivers, Global Planet. Change, 39, 111–126, 2003.
Wei, Y., Liu, S., Huntzinger, D. N., Michalak, A. M., Viovy, N., Post, W. M., Schwalm, C. R., Schaefer, K., Jacobson, A. R., Lu, C., Tian, H., Ricciuto, D. M., Cook, R. B., Mao, J., and Shi, X.: The North American Carbon Program Multi-scale Synthesis and Terrestrial Model
20
Intercomparison Project – Part 2: Environmental driver data, Geosci. Model Dev. Discuss., 6, 5375–5422, doi:10.5194/gmdd-6-5375-2013, 2013.
Willmott, C. J. and Robeson, S. M.: Climatologically Aided Interpolation (CAI) of terrestrial air temperature, Int. J. Climatol., 15, 221–229, 1995.
Willmott, C. J., Rowe, C. M., and Mintz, Y.: Climatology of the terrestrial seasonal water cycle,
25
J. Climatol., 5, 589–606, 1985.
Xie, P. and Arkin, P. A.: Global precipitation: a 17-yr monthly analysis based on gauge observations, satellite estimates, and numerical model outputs, B. Am. Meteorol. Soc., 78, 2539–2558, 1996.
Zeng, N., Neelin, J. D., and Chou, C.: The first quasi-equilibrium tropical circulation
model-30
BGD
11, 1801–1826, 2014North American
runoff
C. R. Schwalm et al.
Title Page Abstract Introduction Conclusions References Tables Figures ◭ ◮ ◭ ◮ Back Close
Full Screen / Esc
Printer-friendly Version Interactive Discussion Discussion P a per | D iscussion P a per | Discussion P a per | Discuss ion P a per |
Table 1.Summary of runoffalgorithms for modeled products.
Model Algorithm Forcing data Citation DLEM Runoff curve number method; function of effective precipitation (precipitation minus
interception, plus snow melt), potential maximum soil moisture retention after runoff, and antecedent water in the soil column. Soil water in excess of saturation in the first soil layers becomes runoff.
NARR Liu et al. (2012); Tian et al. (2010)
LPJ-wsl Sum of surface runofffrom the top soil layer, subsurface runofffrom the lower soil layer, and water percolating down through the lower soil layer. The surface and subsurface runoff
are defined as the excess water above field capacity of the top and lower soil layers.
CRU-TS 3.0a Gerten et al. (2004)
MC1 Sum of surface runoff, macropore (rapid through-flow via roots, cracks, etc.) flow, rapid through-flow and baseflow. Baseflow is a fraction of precipitation as modified by losses to transpiration or direct percolation by soil layer. Losses to transpiration are driven by a simplified version of Penmon–Montieth and transpiration by soil moisture factor for each plant functional type.
PRISMb Bachelet et al. (2001)
SiB3.1 Precipitation (scaled to GPCP) minus evapotranspiration
SiB3.1 natively calculates runoffusing a defined allowable surface interception storage (puddle) depth, which accumulates as precipitation strikes the ground directly or runs off
from the canopy. There is a maximum allowable puddle depth; any water accumulating above this is transferred to runoff, and is immediately in the ocean. As native runoffis unphysical (→0) scaled precipitation minus evapotranspiration is used instead.
NCEP IIc (precipitation scaled to GPCPd)
Baker et al. (2010)
SLand Sum of surface and subsurface runoff. Surface runoffis precipitation minus interception loss scaled by a non-linear function of relative soil wetness. Subsurface runoff is a nonlinear function of relative soil wetness and subsurface runoffat saturation.
SLand is the land surface model component of the dynamic vegetation/carbon model VEGAS as used in the NACP RCIS.
PREC/Le Zeng et al. (2000)
WaSSI Runoffis the sum of overland lateral flow, subsurface, and groundwater flow by an empirical method.
PRISMb Sun et al. (2011)
NARR Sum of surface and subsurface runoff. Surface runoffis a function of infiltration capacity and excess precipitation (non-evaporated inflow in excess of storage capacity by layer). Subsurface runoffis a linear function of subsurface moisture content above a minimum threshold. Water budget does not close due to assimilation of precipitation and snow.
– Mesinger et al. (2006); Schaake et al. (1996)
NARR [GPCP] Scaled NARR precipitation (scaled to GPCPd) minus NARR evapotranspiration NARR [P−E] NARR precipitation minus NARR evapotranspiration
MERRA
MERRA LAND
Sum of precipitation and spurious water source (non-zero due to land–atmosphere interface inconsistencies) minus evapotranspiration and changes in surface and sub-surface water (including interception reservoir, soil moisture, and snow)
– Koster et al. (2000); Rienecker et al. (2011)
UDel Precipitation minus evapotranspiration (from a modified Thornthwaite water-budget equation)
– Willmot et al. (1985)
aCRU-TS – Climatic Research Unit (CRU) Time-Series Datasets (http://badc.nerc.ac.uk/browse/badc/cru/data/cru_ts_observation_databases). b
PRISM – Parameter-elevation Regressions on Independent Slopes Model (http://www.prism.oregonstate.edu/).
c
NCEP II – (Kanamitsu et al., 2002; http://www.esrl.noaa.gov/psd/data/gridded/data.ncep.reanalysis2.html).
d
GPCP – Global Precipitation Climatology Project (http://www.ncdc.noaa.gov/oa/wmo/wdcamet-ncdc.html).
BGD
11, 1801–1826, 2014North American
runoff
C. R. Schwalm et al.
Title Page
Abstract Introduction
Conclusions References
Tables Figures
◭ ◮
◭ ◮
Back Close
Full Screen / Esc
Printer-friendly Version Interactive Discussion
Discussion
P
a
per
|
D
iscussion
P
a
per
|
Discussion
P
a
per
|
Discuss
ion
P
a
per
Fig. 1. CONUS water resource regions. USGS water resource regions and major rivers in the CONUS domain. Prior to aggregation of product runoff, regions coverage converted from
BGD
11, 1801–1826, 2014North American
runoff
C. R. Schwalm et al.
Title Page
Abstract Introduction
Conclusions References
Tables Figures
◭ ◮
◭ ◮
Back Close
Full Screen / Esc
Printer-friendly Version Interactive Discussion
Discussion
P
a
per
|
D
iscussion
P
a
per
|
Discussion
P
a
per
|
Discuss
ion
P
a
per
|
Fig. 2. Mean CONUS runoff and runoff normalized by precipitation. Data values are mean
BGD
11, 1801–1826, 2014North American
runoff
C. R. Schwalm et al.
Title Page
Abstract Introduction
Conclusions References
Tables Figures
◭ ◮
◭ ◮
Back Close
Full Screen / Esc
Printer-friendly Version Interactive Discussion
Discussion
P
a
per
|
D
iscussion
P
a
per
|
Discussion
P
a
per
|
Discuss
ion
P
a
per
Fig. 3. Relative bias in runoff by water resource region and data product. Relative bias is
calculated as ( ˆy−y)/y where y is USGS stream gauge runoff for a given region averaged
BGD
11, 1801–1826, 2014North American
runoff
C. R. Schwalm et al.
Title Page
Abstract Introduction
Conclusions References
Tables Figures
◭ ◮
◭ ◮
Back Close
Full Screen / Esc
Printer-friendly Version Interactive Discussion
Discussion
P
a
per
|
D
iscussion
P
a
per
|
Discussion
P
a
per
|
Discuss
ion
P
a
per
|
Fig. 4.Estimated and observed mean runofffrom 2001 to 2005. Estimated runoffproduct and
Nash–Sutcliffe efficiency (NSE) given in upper-left of each panel. NARR variants are: NARR
[GPCP]; NARR precipitation scaled to GPCP minus NARR precipitation, and NARR [P −E]; NARR precipitation minus NARR evapotranspiration. Each circle represents the 2001–2005 (water year basis) mean for one of the 18 CONUS water resource regions. Symbol size is proportional to management intensity by region (i.e., larger symbols indicate a higher degree of water cycle management). Symbol color coding denotes geography: eastern (green), from the Souris-Red-Rainy, Upper Mississippi, and Lower Mississippi regions eastward or numbers 1– 9, and western (blue) regions, from the Missouri, Arkansas-White-Red, and Texas-Gulf regions westward or numbers 10–18. The Upper Colorado, Lower Colorado, and Rio Grande western regions are colored red and all have a water cycle management index in excess of unity, i.e., gross withdrawals exceed depleted flows. The index of management intensity by region is not correlated with bias except for MERRA (p=0.009), MERRA LAND (p=0.02), NARR
BGD
11, 1801–1826, 2014North American
runoff
C. R. Schwalm et al.
Title Page
Abstract Introduction
Conclusions References
Tables Figures
◭ ◮
◭ ◮
Back Close
Full Screen / Esc
Printer-friendly Version Interactive Discussion
Discussion
P
a
per
|
D
iscussion
P
a
per
|
Discussion
P
a
per
|
Discuss
ion
P
a
per
Fig. 5. Time evolution of region-scale runoff. Annual runoff (water year basis) from 2001
BGD
11, 1801–1826, 2014North American
runoff
C. R. Schwalm et al.
Title Page
Abstract Introduction
Conclusions References
Tables Figures
◭ ◮
◭ ◮
Back Close
Full Screen / Esc
Printer-friendly Version Interactive Discussion
Discussion
P
a
per
|
D
iscussion
P
a
per
|
Discussion
P
a
per
|
Discuss
ion
P
a
per
|
Fig. 6. Spatial patterns of runoff. Maps show monthly mean runoff and its coefficient of