Numerical investigation of fluid flow and
heat transfer in a multi-strand steelmaking
tundish with closed strands
SABIN KUMAR MISHRA*
Department of Mechanical and Industrial Engineering, Indian Institute of Technology, Roorkee - 247667, Uttarakhand, India
PRADEEP K JHA
Department of Mechanical and Industrial Engineering, Indian Institute of Technology, Roorkee - 247667, Uttarakhand, India
SATISH C SHARMA
Department of Mechanical and Industrial Engineering, Indian Institute of Technology, Roorkee - 247667, Uttarakhand, India
S K AJMANI
Steelmaking and Casting Research Group,
Tata Steel, R&D, Burma mines, Jamshedpur –831007, Jharkhand, India.
Abstract
Heat Transfer and fluid flow study has been carried out in a multi-strand billet caster curved shape tundish for a situation when the strand is sometimes closed because of unavoidable circumstances like strand breakout, mechanical/electrical problem in the strand or less availability of molten steel from the next ladle. Closing any of the outlet is supposed to affect the flow distribution inside the tundish ad so it is important to study which of the outlets should be closed to have proper results in terms of mixing parameters and proper temperature distribution inside the tundish. Navier-Stokes equation has been
solved using standard K – ε turbulence model with the help of educational version of CFD software
FLUENT to find the steady state velocity field inside the tundish. Further, tracer dispersion study was carried out using pulse input technique of the tracer to find the Residence Time Distribution (RTD) curve of the tundish. It was found that closing the near outlet increases the mixing capability of the tundish the most as compared to that by closing far or middle outlet. Maximum temperature variation between inlet and outlet was observed to be 6-7 K for all the cases. Numerical code was validated against the experimental observation by performing the tracer dispersion study inside a multi-strand tundish and reasonably good match between the experimental and numerical results in terms of RTD curves is observed.
Keywords— RTD, MRT, Tundish Volumes, Closing Strands, CFD
Nomenclature
C -Concentration of tracer Cavi - Average Concentration of the tracer at outlet i
V - Volume of tundish RTD -Residence time distribution
p - Pressure MRT - Mean residence time
t - Time τ - Theoretical mean residence time
u - Mean velocity k - Turbulent kinetic energy
ρ - Density of fluid - Co-efficient of viscosity
uiuj= Average turbulent stress tr - Actual mean residence time of the fluid in the vessel
Suffix
d - Dead volume i,j,k - Three Cartesian coordinate directions x,y and z
m - Mixed volume p - plug volume
1. Introduction
The main function of the continuous casting tundish has been to act as a distributor of molten steel from the ladle to the moulds. In addition to its conventional role as a reservoir and distributor, tundish is also used as a reactor. This reactor is the last vessel before the solidification of the metal in the mould, in which the molten steel flows through, having a residence time in the vessel. During this time the flow and temperature of molten steel can be modified to produce cleaner steel [1]. It is well known that high superheats usually lead to quality defects of the product and low casting temperatures to early solidification inside the cooler zones of the tundish. For these reasons a detailed knowledge of the liquid steel flow is a prerequisite towards an optimal steel circulation to the moulds with uniform temperature [2].The melt flow is considerably affected during ladle change operations where the hotter steel from the new ladle is drained to the tundish where it makes contact with the cooler steel already present. Due to the density difference of the two molten steels, the flow pattern changes radically resulting in an increase in turbulence intensity [3–4].
Though some researchers investigated the steel flow phenomena in the tundish through industrial trials [5-9], the operating conditions in steel plants, such as the massive size of industrial tundishes and the high temperature indicates serious problems for any direct and elaborate industrial experimental investigations in tundishes. On the other hand, though the kinematic viscosity of steel is almost equal to that of water, the fluid flow study through water models [10–15] is simulated. Consequently, the numerical simulation becomes a reasonable alternative to investigate the metal flow in side the tundish. These includes a large number of mathematical modeling investigations on heat loss and it’s associated influence on the fluid flow, residence time distribution, temperature distribution, etc. in continuous casting tundish [16-18]. The purpose of fluid flow optimization in the tundish is to achieve the best flow pattern inside the tundish.
Most of the reported work deal with the tundish flow in normal conditions where all the outlets are kept open all the time. It is however observed in the plant that sometimes one/two strand is closed because of problems like strand breakout, mechanical/electrical problems in the strand or less availability of the metal in the coming ladle. As the flow behavior inside the tundish changes because of closing of the outlets, change in RTD flow behavior and temperature variation of the tundish is going to be an important area of observation. In the present work, the simulation of fluid flow and temperature distribution in a continuous casting industrial tundish is reported and the effect of the mixing and temperature distribution on the flow pattern in the tundish is discussed.
2. Physical description of the problem
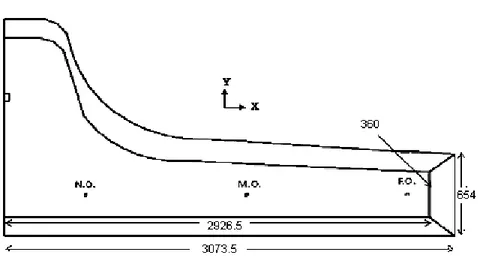
Isometric view of the multi (six) strand billet caster tundish used for the simulation is shown in Fig. 1(a). The bath height is taken as 840mm with the size of the inlet and outlets diameter as 66 mm and 21 mm respectively. All other dimensions are shown in the plan view in Fig. 1(b), which completes the detail geometrical description of the scaled down industrial size tundish taken for simulation.
Three outlets namely outlet-1 (also called as far outlet, being far from the inlet), outlet-2 (called as middle outlet, being in between the far outlet and near outlet) and outlet 3 (called as near outlet, being closest to the inlet) fall on one side of the inlet of the tundish. Symmetry prevails because of the presence of outlet 4, outlet 5 and outlet 6 on other side of the inlet.
Table 1: Different cases and conditions to perform simulation
Case
Outlet closed Outlet – 1
(Far Outlet)
Outlet – 2 (Middle
Outlet)
Outlet – 3 (Near Outlet) 0
I √
II √
III √
Fig. 1. (a) Geometry of multi strand tundish in isometric view
Fig. 1. (b) Plan view of the multi-strand tundish (All dimensions are in mm.)
3. Mathematical formulation and assumptions
3.1 Governing equations [19]
Continuity,
Ui
x
= 0 (1)
Momentum,
i j
i j j i j i
i uu
x U x U x x Dt U D (2)
Turbulent kinetic Energy,
P D Dt k Dk (3)
Rate of dissipation of k, C k
k P C D Dt D 2 2 1
(4)
Concentration,
i c eff i i i x C x x C u t C (5) Where, i j j i t ij j i x U x U v k u u 3 2 f k2 Cvt ;
j t j x x D
;
eff
v
t
;Constants for k-ε model
C1 = 1.44, C2 = 1.92, c = 1.0, k = 1.0, ε = 1.3, f1 = f2 = fμ = 1, Cμ = 0.09
Theoretical mean residence time, Volumetricflowrate tundish the of Volume
(6)Actual Residence Time,
avi i avi r C t C
t i=1,2,3 (for three outlets) (7)
In equation (7), the integration is carried over a time span 2 with an equal interval of time step
rt
-1
tundish
the
of
volume
dead
of
Fraction
(8)Average break through time, tp = First appearance of tracer at the exits (time is averaged because of multi exits)
p t
V
Vp
volume plug of
Fraction (9)
V V V V V d p 1 V volume mixed of
Fraction m (10)
3.2 Boundary condition
The flow is considered to be in steady state and incompressible. Tracer dispersion study has been carried out for different cases studied. Surface of tundish is assumed to be flat and velocity at the inlet is given at 1.85 m/s when all the outlets are open. For the cases with any of the outlet closed, the incoming velocity is reduced accordingly so that uniformity in casting speed is maintained. The walls were set to a no slip condition and turbulent quantities were set from a log wall function for the K – ε turbulence model. After attainment of the steady state, dye was injected through the inlet for 5 seconds. 5 seconds is normally a very short time as compared to the MRT of the tundish, so the influx of the dye during its travel is assumed not to change the local velocity field. Thermal boundary conditions include heat losses in terms of constant heat flux values, as shown in Table2 [20] through the all the side and bottom walls and top surface of fluid in the tundish. The physical properties of liquid steel employed in these simulations are reported in Table 3.
Table 2: Heat losses from the tundish.
Free surface of the bath
Tundish bottom Vertical-longitudinal wall
Vertical-transverse wall 15000 W/m2 1400 W/m2 3200 W/m2 3800 W/m2
Table 3: Physical properties of molten steel employed in the mathematical model.
Property Molten Steel at 1873 K
Absolute Viscosity 0.0067
Density 7010
To simulate the unsteady state conditions the flow and thermal fields under steady state conditions were employed as initial conditions in all cases.
4. Method of solution
RTD behavior of the tundish is studied by injecting a dye through the inlet stream for a very short time of 5 sec and monitoring its concentration at the different outlets in a temporal manner. The intention is to compute the different tundish flow volumes and the mean residence time in the tundish for deciding the effective utilization of the tundish volume. The set of partial differential equations (1) to (5) were solved with the help of the mentioned boundary conditions using finite volume technique with the help of educational version of the CFD software FLUENT [21]. The partial differential equations were integrated over a control volume to find out the fluxes (of mass and momentum as well as that of the dye) through all the faces and the flux balance is made over all the control volumes, which yield a set of linear algebraic equations. The set of algebraic equations is solved by the tri-diagonal matrix (TDM) method for momentum and by a whole field solver, taking one from the family of conjugate gradients for the pressure correction equation. The solutions are said to have converged when the whole field normalized residuals for each of the velocity components and mass fall below unity.
From the temporal variation of concentration the actual mean residence time was found out by simple integration (Eqn. 7). Water has been considered as the working fluid for experimental work since steel at its melting temperature and water at room temperature has equal kinematic viscosity [22].
5. Results and discussion
The analysis of metallurgical capability of the tundish has been carried out by finding the different tundish volumes viz. dead volume, plug volume and mixed volume. Mixing parameters like ratio of actual to theoretical mean residence time (tr / ), ratio of plug to dead volume (Vp/Vd) and ratio of mixed to dead volume (Vm/Vd) have been found out for different cases. While (Vp/Vd) indicated the quiescent region of tundish which promotes the inclusion floatation behavior inside the tundish, (Vm/Vd) is indicative of well mixed region which in turn is supposed to provide better homogeneity inside the tundish [23]. Ratio of actual to theoretical mean residence time indicates the relative time spent by a fluid particle inside the tundish.
5.1 Validation with experiment
The numerical code has been validated experimentally for a 1/4th scale of six strand tundish [19] where the tracer concentration was measured with time at the outlet. The geometry of the tundish is shown in Fig. 2(a). In this experiment the bath height was kept at 143mm and zero shear boundary condition was applied at the top surface. Schematic of experimental set up is shown in Fig. 2(b).
(a)
(b)
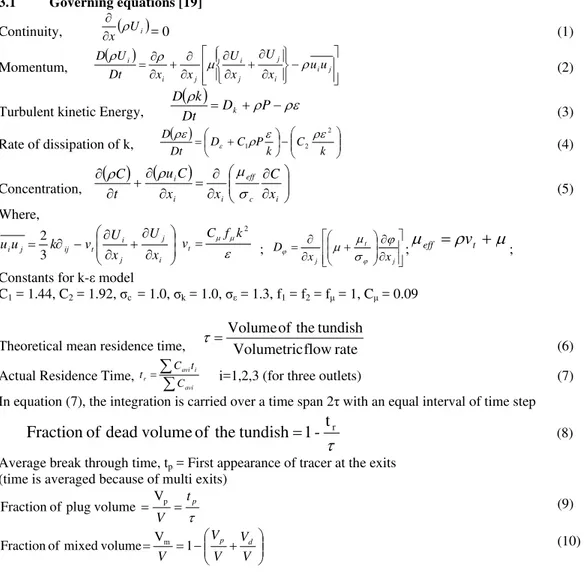
Fig. 3a to 3c shows the temporal variation of the tracer concentration (dimensional) with non-dimensional time. It can be seen from the figure that RTD curve predicted by the numerical simulation matches reasonably well with that by the experimental observation. While the peaks of the concentration curve for near outlet matches completely for experimental and numerical work, for middle and far outlet there is slight variation. The difference in MRT predicted by numerical and experimental observation at each of the three outlets is found to be less than 0.5%.
When the tracer is first added at the inlet, it moves directly towards the outlet due to the steady velocity field present in the tundish. It takes little time to reach the near outlet, which can be seen clearly in Fig. 3a where the concentration just starts to rise from a value of zero. A sharp increase in the tracer concentration as depicted in Fig. 3a shows the short circuiting phenomena indicative of not the full utilization of tundish volume for creating well mixed zone inside the tundish.
0.0 0.5 1.0 1.5 2.0
0 1 2 3 4 5
RTD Curves comparision at Near Outlet
D
im
e
ns
ionl
ess C
oncent
rat
io
n
Dimensionless Time Experimental Computational
(a)
0.0 0.5 1.0 1.5 2.0 0.0
0.2 0.4 0.6 0.8 1.0 1.2
RTD Curves comparision at Middle Outlet
Di
m
e
n
s
io
n
les
s Co
n
c
en
tr
a
ti
o
n
Dimensionless Time Experimental Computational
(b)
0.0 0.5 1.0 1.5 2.0 0.0
0.2 0.4 0.6 0.8 1.0
RTD Curves comparision at Far Outlet
Di
m
e
ns
io
nl
e
s
s
Co
n
cen
tr
at
io
n
Dimensionless Time Experimental Computational
(c)
Fig. 3. (a – c) Temporal variation of tracer concentration at the outlet of a six strand tundish: a comparison between experimental and k – ε turbulence model
A lesser peak is observed in case of middle and far outlet, which indicates that the middle and far outlet contribute more to the mixing inside the tundish as compared to the near outlet. At later time it can be seen that the concentration of the tracer decreases slowly and at about 2 times the mean residence time, the concentration falls to nearly zero.
5.2 Analysis of Residence Time Distribution Curves obtained by numerical investigation
Fig. 4 (a) shows residence time distribution (RTD) curve for case-0 (all outlets are open) and Fig. 4 (b to d) show RTD curve for case-I, case-II and case-III (Far outlet, Middle outlet and Near outlet respectively). It can be seen that outlet-1, which is far outlets having the lowest peak, outlet-2, which is middle outlets show intermediate peak and outlet-3, which is near outlets show the largest peak. A larger peak signifies short circuiting present through the near outlet in the tundish.
ratio of MRT for outlet-3) because of the short-circuiting through these outlets. The far outlets show the maximum values and the middle outlets having the values in between those of near and far outlets.
0.0 0.5 1.0 1.5 2.0 0.0 0.5 1.0 1.5 2.0 2.5
All Outlets are open
Di m e ns io nl e s s Co nc e n tr a ti o n Dimensionless Time Near Outlet Middle Outlet Far Outlet (a)
0.0 0.5 1.0 1.5 2.0 0.0 0.5 1.0 1.5 2.0 2.5
Far Outlet is closed
Di m e n s io n les s C o n c en tr at io n Dimensionless Time Middle Outlet Near Outlet (b)
0.0 0.5 1.0 1.5 2.0 0.0 0.5 1.0 1.5 2.0 2.5
Middle outlet is closed
D im en si o n le ss C o ncen tr at io n Dimensionless Time Far Outlet Near Outlet (c)
0.0 0.5 1.0 1.5 2.0 0.0
0.5 1.0 1.5 2.0
Near Outlet is closed
Dim e nsi onles s Conc ent rat io n Dimensionless Time Far Outlet Middle Outlet (d)
Fig. 4. (a - d) RTD curves for case – 0, case – I, case – II and case – III
Table 4. Comparison of ratio of MRT and the ratio of different tundish volumes
CASE Individual tr / τ at different outlets Overall
tr / τ
Overall (Vm/Vd)
Overall (Vp/Vd)
O1 O2 O3
0 0.842 0.721 0.67 0.744 2.76 0.25
I - 0.719 0.679 0.699 2.22 0.11
II 0.871 - 0.688 0.779 3.21 0.33
III 0.891 0.725 - 0.808 3.69 0.54
It can be noticed that for case-I, the ratios of mixed to dead volume and plug to dead volume are smallest among the three cases studied. Case-III results into larger mixed to dead volume and plug to dead volume ratios because of outlet -3 being closed. It has already been observed that the near outlets when opened have profound effect on overall mixing behavior inside the tundish due to presence of short-circuiting phenomena. The reason for increase in the ratios of mixed to dead volume and plug to dead volume for case-III, can further be explained by referring to the velocity vectors obtained for the different cases as shown in Fig. 5 (a – d) drawn at the outlet plane of the tundish. The velocity vectors for case – 0 show small recirculation zones near the symmetry plane and above the middle outlet. This promotes the tendency of short-circuiting predominantly through outlet-3 and partly through outlet-2. Because of this outlet-3 contribute the minimum for tundish mixing and outlet-2 shows better than outlet-3. Outlet-1 is shown to have highest contribution towards mixing because of well mixed region in their vicinity.
outlets are open, a percentage increase of about 34% is observed in the ratio of mixed to dead volume of the tundish and a significant increase of about 116% is observed in the ratio of plug to dead volume of the tundish.
Fig. 5. (a – d) Velocity vectors at outlet plane for case – 0, I, II and III
5.3 Analysis of Temperature Contours obtained by numerical investigation
(a)
Fig. 6. (a – d) Temperature contours at outlet plane for case – 0 to case – III
6. Conclusion
Reference:
[1] Miki Y and Thomas B G 1999 Metall. Mater. Trans. B 30 639
[2] R D Morales, J de J Barreto, S Lopez-Ramirez, J Palafox-Ramos and M Diaz-Cruz, Modelling Simul. Mater. Sci. Eng. 8 (2000) 781 [3] Joo S and Guthrie R I L 1993 Metall. Mater. Trans. B 24 755
[4] Joo S, Han J W and Guthrie R I L 1993 Metall. Mater. Trans. B 24 767
[5] H. Tanaka, R. Nishihara, I. Kitagawa and R. Tsujino: ISIJ Internationla, (1993), 33(12), 1238. [6] K. Sasai and Y. Mizukami: ISIJ Int., (2000), 40(1), 40.
[7] P. Kovac, J. Jijac, V. Masek, P. Marek, P. Kalmar and K. Michalek: Metalurgija, (2003), 42(4), 249. [8] H. Solhed, L. Jonsson and P. Jonsson: Metal. & Material Trans. B., (2002), 33B(2), 173.
[9] A. Aguilar-Corona, R. D. Morales, M. Diaz-Cruz, J. Palafox-Ramos and H. Rodriguez-Hernandez: Steel Research, (2002), 73(10), 438.
[10] P. K. Jha, P. Srinivasa Rao and Anupam Dewan : ISIJ Int., 48, 2008, 154 [11] Y. Sahai and T. Emi: ISIJ Internationla, (1996), 36(9), 1166.
[12] Anurag Tripathi and S. K. Ajmani, Numerical Investigation of Fluid Flow Phenomenon in a Curved Shape Tundish of Billet Caster. ISIJ International, 2005, 45, 1616
[13] Y. He and Y. Sahai: Metal. Trans B, (1987), 18B(2), 81. [14] C. Damle and Y. Sahai: ISIJ Internationla, (1996), 36(6), 681.
[15] H.-J. Odenthal, R. Bolling and H. Pfeifer: Steel Research, (2003), 74(1), 44.
[16] S. Singh, and S.C. Koria, Study of fluid flow in tundishes due to different types of inlet streams. Steel Research, 1995, 66 , 294 [17] L. Zhang: Journal of Iron and Steel Research International, (2005), 12(4), 20.
[18] L. Zhang: Journal of University of Science and Technology Beijing(English Edition), (2005), 12(116-122), [19] P. K. Jha, P. Srinivasa Rao and Anupam Dewan : ISIJ Int., 48, 2008, 154 – 160
[20] J. De J. Barreto-Sandoval. M. A. Barron-Meza and R. D. Mortlles: ISIJ 1,1!., 36 (1996), 543. [21] FLUENT users guide, Fluent Inc., Lebanon, NH, (2006).