ACPD
10, 523–558, 2010CARIBIC and GOME-2 comparison
of the Kasatochi plume observations
K.-P. Heue et al.
Title Page
Abstract Introduction
Conclusions References
Tables Figures
◭ ◮
◭ ◮
Back Close
Full Screen / Esc
Printer-friendly Version
Interactive Discussion Atmos. Chem. Phys. Discuss., 10, 523–558, 2010
www.atmos-chem-phys-discuss.net/10/523/2010/ © Author(s) 2010. This work is distributed under the Creative Commons Attribution 3.0 License.
Atmospheric Chemistry and Physics Discussions
This discussion paper is/has been under review for the journal Atmospheric Chemistry and Physics (ACP). Please refer to the corresponding final paper in ACP if available.
A comparison of DOAS observations by
the CARIBIC aircraft and the GOME-2
satellite of the 2008 Kasatochi volcanic
SO
2
plume
K.-P. Heue1, C. A. M. Brenninkmeijer1, T. Wagner1, K. Mies1, B. Dix2, U. Frieß3,
B. G. Martinsson4, F. Slemr1, and P. F. J. van Velthoven5
1
Max-Planck-Institut f ¨ur Chemie (MPI), Mainz, Germany
2
Department of Chemistry and Biochemistry, University of Colorado, Boulder, USA
3
Institut f ¨ur Umweltphysik, Universit ¨at Heidelberg, Heidelberg, Germany
4
Avdelningen f ¨or k ¨arnfysik, Lunds universitet, Lund, Sweden
5
Koninklijk Nederlands Meteorologisch Instituut (KNMI), De Bilt, The Netherlands
Received: 7 October 2009 – Accepted: 21 December 2009 – Published: 12 January 2010 Correspondence to: K.-P. Heue (klaus-peter.heue@mpic.de)
ACPD
10, 523–558, 2010CARIBIC and GOME-2 comparison
of the Kasatochi plume observations
K.-P. Heue et al.
Title Page
Abstract Introduction
Conclusions References
Tables Figures
◭ ◮
◭ ◮
Back Close
Full Screen / Esc
Printer-friendly Version
Interactive Discussion
Abstract
The 2008 Kasatochi volcanic eruption emitted≈1.5–2.5 Tg SO2 into the upper tropo-sphere and lower stratotropo-sphere. Parts of the main volcanic plume (gases and parti-cles) reached central Europe a week after the eruption and were detected there by the CARIBIC (Civil Aircraft for Regular investigation of the Atmosphere based on an In-5
strument Container) flying observatory. The plume was also observed by the GOME-2 satellite instrument, only a few hours after the CARIBIC aircraft had crossed the plume, thus giving a unique opportunity to compare results. Trajectories and local wind speeds are investigated in detail using the GOME-2 and CARIBIC observations for better com-parison of the results from these two observational systems. A comcom-parison of the 10
spatial pattern with the local observations of the wind speed and the trajectory model TRAJKS showed a slight discrepancy, which has to be considered for satellite valida-tion. Hence, it appears that detailed analyses of wind speeds are required. Emitted and secondary particles, partly measured and sampled by the CARIBIC in situ instru-ments, affected the DOAS SO2measurements, of both CARIBIC and GOME-2. Overall
15
GOME-2 and the CARIBIC SO2measurements agree very well. The major uncertain-ties remain the actual wind speed needed to properly correct for the advection of the plume between the different overpass times, and to smaller degree the effect of aerosol. The good agreement can be seen as validation for both GOME-2 and CARIBIC DOAS observations and is also a basis for future common projects.
20
1 Introduction
Components of the Kasatochi plume (besides particles, remnants of the 1.5 to 2.5 Tg SO2emitted; e.g., Richter et al., 2009) were detected by several instruments aboard the CARIBIC observatory (Civil Aircraft for Regular investigation of the Atmosphere based on an Instrument Container, http://www.caribic-atmospheric.com) (Brenninkmeijer et 25
ACPD
10, 523–558, 2010CARIBIC and GOME-2 comparison
of the Kasatochi plume observations
K.-P. Heue et al.
Title Page
Abstract Introduction
Conclusions References
Tables Figures
◭ ◮
◭ ◮
Back Close
Full Screen / Esc
Printer-friendly Version
Interactive Discussion on 15 August 2008. Besides enhanced particle number densities and a higher carbon
and sulphur content of total aerosol (Martinsson et al., 2009) a strong increase in sul-phur dioxide column densities was observed by the DOAS (Differential Optical Absorp-tion Spectroscopy) instrument (Platt and Stutz, 2008). Although the CARIBIC flying laboratory has been in operation since 1997 (with an interruption from 2002–2004), the 5
Kasatochi eruption in August 2008 was the first significant volcanic eruption observed in this period, as witnessed by strongly elevated sulphur-to-ozone ratios (Martinsson et al., 2009). By the time it was detected, while the aircraft approached Frankfurt airport, the plume had already travelled around half of the northern hemisphere at about 50◦N. The plume’s paths can be retrieved directly from SO2 column densities observed by
10
several satellites e.g. OMI, SCIAMACHY, GOME-2. Here GOME-2 data will be com-pared with the rather fortuitous observations of the plume by CARIBIC. This is because the temporal difference in the observation is smallest compared to SCIAMACHY or OMI.
First we describe the CARIBIC DOAS instrument and its measurements followed 15
by a description of the GOME-2 data. A brief interpretation of the CARIBIC DOAS data is given, here additional CARIBIC measurements are also considered. In this way the plume height and thickness can be estimated. As the overpass times of the two observing platforms differed by more than 3 h forward trajectories (Scheele et al., 1996; Stohl et al., 2001) are included in the comparison. Here a slight inconsistency 20
ACPD
10, 523–558, 2010CARIBIC and GOME-2 comparison
of the Kasatochi plume observations
K.-P. Heue et al.
Title Page
Abstract Introduction
Conclusions References
Tables Figures
◭ ◮
◭ ◮
Back Close
Full Screen / Esc
Printer-friendly Version
Interactive Discussion
2 Description of the instruments
2.1 CARIBIC instrumentation
CARIBIC is based on a Lufthansa Airbus A340-600 retrofitted with a 3 probe (trace gases, water and aerosol) inlet system. The aircraft carries the instrument container on a monthly basis during four consecutive regular passenger flights for 2–3 days. 5
CO, CO2, O3, NO, NOy, some organic compounds (e.g. acetone), mercury, total and gaseous water and aerosols are measured real time. In addition, 28 air samples and 16 aerosol samples are taken for retrospective laboratory analysis of a host of trace gases (Schuck et al., 2009) and aerosol elemental composition, respectively (Nguyen et al., 2006). A video camera in the inlet pylon takes a frame every second for post 10
flight cloud cover analysis. Also the miniature DOAS telescopes are mounted in this pylon. The instruments are maintained and operated by nine scientific groups from institutes in Europe (http://www.caribic-atmospheric.com, July 2009).
2.2 The DOAS instrument on CARIBIC
DOAS (Differential Optical Absorption Spectroscopy) is a well established technique 15
(Platt and Stutz, 2008) and was implemented in CARIBIC to provide a true remote sensing capability to this airborne platform (Dix et al., 2009). The technique is based on the fact that several atmospheric trace gases have individual absorption structures in the UV-visible wavelength range. These spectral fingerprints can be used to de-tect and quantify the trace gases by doing a spectral analysis of scattered or reflected 20
sunlight. Thereby NO2, HCHO, HONO, BrO, OClO, O3, SO2and O4can be detected si-multaneously. The CARIBIC DOAS system comprises three spectrometers (USB 2000 from Ocean Optics) inside a rack unit in the container, each connected to one of the three small telescopes in the inlet pylon via quartz fibre bundles. The telescopes’ field of view is 1.9◦ pointing starboard with elevation angles of−82◦ (named nadir),−10◦,
25
ACPD
10, 523–558, 2010CARIBIC and GOME-2 comparison
of the Kasatochi plume observations
K.-P. Heue et al.
Title Page
Abstract Introduction
Conclusions References
Tables Figures
◭ ◮
◭ ◮
Back Close
Full Screen / Esc
Printer-friendly Version
Interactive Discussion changes of the instrumental response during flight. The spectral range for two units is
321–453 nm, with the third one (−10◦) having a slightly different spectral range, namely
289–441 nm. The spectral resolution of all three spectrometers is approximately 0.5 nm full width of half maximum, but depends on the wavelength considered. The temporal resolution is 30 s, corresponding to a horizontal resolution of≈7.5 km. To reduce noise
5
in the spectra obtained, at times 10 spectra are co added resulting in a resolution of 5 min or≈75 km respectively. Details on the instrument are given in Dix et al. (2009).
The Multi AXes DOAS (MAX-DOAS) technique uses scattered sunlight and there-fore the light path is not well defined. The analysis of the spectra yields slant column densities (SCD) which are integrated concentrations along a weighted average light 10
path. The actual viewing geometry causes different sensitivities of the individual tele-scopes for a certain air mass, by which trace gas concentration profiles close to the flight altitude can be retrieved. The sensitivity for a trace gas at a certain altitude layer is commonly expressed as the box air mass factor (Box-AMF). It is defined as the con-tribution of this layer (or box) to the total observed slant column density relative to the 15
vertical column density in this layer.
The maximum sensitivity for the two near horizontally (−10◦ and+10◦) viewing
tele-scopes is reached close to the aircraft’s flight level (Fig. 1). For the downward (−10◦) viewing direction the sensitivity is also high below the flight level, but decreases rapidly with distance below the aircraft, especially when flying above clouds. In this case the 20
high reflectivity leads to enhanced light paths due to multiple scattering. The decrease in sensitivity with height above the flight altitude is weakest for the upward (+10◦) look-ing telescope. Above a certain altitude the sensitivity for all viewlook-ing directions reaches the stratospheric approximation 1/cos(SZA) depending solely on the solar zenith angle (SZA).
25
ACPD
10, 523–558, 2010CARIBIC and GOME-2 comparison
of the Kasatochi plume observations
K.-P. Heue et al.
Title Page
Abstract Introduction
Conclusions References
Tables Figures
◭ ◮
◭ ◮
Back Close
Full Screen / Esc
Printer-friendly Version
Interactive Discussion not only on the viewing direction and the SZA but also on the cloud cover or the
aerosol extinction. Because of the complexity of the contributing light paths, they are simulated by means of a radiative transfer model. The radiative transfer pro-gram used, McArtim (Deutschmann, 2009), is a Monte Carlo based algorithm to approximate the light paths, and to estimate to what degree they are affected by 5
aerosols and clouds. O4 observations are often used as proxy to estimate cloud properties (Wagner et al., 2004; Heue, 2005). Sometimes additional information on the aerosol optical thickness based on MODIS (http://ladsweb.nascom.nasa.gov, May 2009), Calipso (http://www-calipso.larc.nasa.gov, May 2009) or Aeronet Data (http://aeronet.gsfc.nasa.gov/, May 2009) is used to estimate the cloud and aerosol 10
properties as input of the radiative transfer simulations.
Although most of the ultra violet radiance less than 320 nm is absorbed by strato-spheric ozone, the analysis relies on the weak signals above 312 nm, as the strongest differential SO2absorption does occur in the UV range between 295 and 306 nm, and decreases fast towards longer wavelengths (Bogumil et al., 2003). Consequently the 15
SO2sensitivity of the DOAS retrieval in the wavelength interval 321.65–345 nm is rather low, for the spectra recorded with the two spectrometers connected to the +10◦ and
−82◦ telescopes. Only with the −10◦ viewing direction can a high sensitivity for SO2 be achieved in the wavelength interval between 312 and 330 nm. For SO2 the same cross section (273 K) as for the GOME-2 data retrieval (Sect. 2.4) was used, thereby 20
the systematic error caused by different SO2cross sections is excluded. Moreover, the absorption cross sections of O3(two different cross sections for 223 K and 243 K), NO2, BrO, HCHO, and for the longer wavelength ranges (336–367 nm) O4, were included in the DOAS fit. The filling-in of the Fraunhofer lines caused by inelastic scattering of light (Grainer and Ring, 1962) was corrected by including a Ring spectrum (Kraus, 2006) in 25
ACPD
10, 523–558, 2010CARIBIC and GOME-2 comparison
of the Kasatochi plume observations
K.-P. Heue et al.
Title Page
Abstract Introduction
Conclusions References
Tables Figures
◭ ◮
◭ ◮
Back Close
Full Screen / Esc
Printer-friendly Version
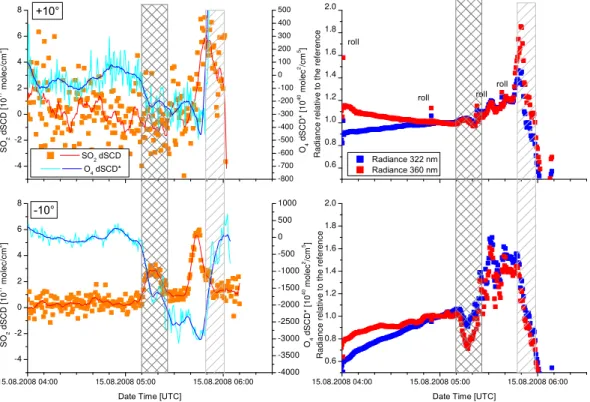
Interactive Discussion (e.g. O4in Fig. 4). For the volcanic SO2plume, we chose a reference spectrum close
to the plume at 05:00 UTC (Fig. 4). As the reference SCD is unknown it might add an offset (±6.5×10¹⁵molec/cm2) to the time series, and thereby affect the intercept of the comparison with GOME-2 (Sect. 4.5, Fig. 13). Figure 2 shows an example fit of the SO2retrieval for the 10 spectra average between 05:43:32 and 05:48:37 UTC.
5
2.3 Wind measurements and the trajectory model
The aircraft’s position and also the roll and pitch angle as well as relevant meteoro-logical observations are provided by the aircraft’s standard ARINC system and are logged in flight by the master computer in the container. Temperature and pressure are measured directly and the true airspeed is based on measurements with Pitot tubes. 10
The wind velocity is calculated from the vector difference between the aircraft’s true air speed and the speed over ground based on an inertial navigation system or on the GPS coordinates. Details on the methodology of the airborne wind speed measure-ments are given e.g. in Khelif et al. (1999).
The time stamp of the ARINC data is stored with the other data on the CARIBIC 15
master PC, and from this the deviation of the master clock can be calculated. In fact the typical time shift during four flights in three days is of the order of a few seconds. This is important as all instruments are synchronised to the master PC.
In addition to the large suite of measurements, the CARIBIC data are complemented with information based on meteorological analyses made with the ECMWF (European 20
Centre for Medium range Weather Forecasts) global weather forecast model. The trajectory model TRAJKS (Scheele et al., 1996; Stohl et al., 2001) of KNMI was used to calculate two day forward as well as eight day backward 3-D trajectories for every 3 min along the flight path. The trajectory model uses archived ECMWF analysis data at a horizontal resolution of 1◦×1◦ and at 90 vertical levels. Various meteorological 25
ACPD
10, 523–558, 2010CARIBIC and GOME-2 comparison
of the Kasatochi plume observations
K.-P. Heue et al.
Title Page
Abstract Introduction
Conclusions References
Tables Figures
◭ ◮
◭ ◮
Back Close
Full Screen / Esc
Printer-friendly Version
Interactive Discussion
2.4 GOME-2 on MetOp-A
The GOME-2 (Global Ozone Monitoring Experiment) on MetOp-A is the first of a series of three identical instruments. With this series the successful long term observations of atmospheric trace gases by GOME and SCIAMACHY are extended until 2020. MetOp-A was launched into a sun-synchronous polar orbit at 800 km altitude in October 2006 5
and crosses the equator at 09:30 LT (local time). The GOME-2 instrument is a 4 chan-nel UV/Vis grating spectrometer, which covers the wavelength region of 240–790 nm with a spectral resolution of 0.2–0.4 nm. Besides the backscattered and reflected radi-ance from the earth it also observes direct sunlight. The ground pixel size is 80×40 km2
and the total swath width is 1920 km, thereby achieving daily coverage of the mid lati-10
tudes (http://www.esa.int/esaLP/LPmetop.html, September 2009).
The SO2 absorption is analysed from the satellite spectra in the wavelength range from 312–324 nm using the DOAS method (Platt and Stutz, 2008). To remove the Fraunhofer lines, a direct sun spectrum (containing no atmospheric absorptions) is in-cluded in the fitting process. The trace gas cross sections for O3 (221 K; G ¨ur et al.,
15
2005), SO2 (273 K; Bogumil et al., 1999), a Ring spectrum (Wagner et al., 2009) and an inverse spectrum (both calculated from the direct sun spectrum) are included in the spectral analysis. Also a polynomial of degree 4 is included to account for broad band effects and atmospheric scattering. Since the atmospheric light paths within the selected fitting window change systematically with wavelength (e.g. van Roozendael et 20
al., 2006), not only the original ozone absorption cross section but also a second one (the original cross section scaled with the a fourth order polynomial in wavelength) are included in the fitting algorithm. It should be noted that in principle additional ozone absorption cross sections for other temperatures might be included in the fitting algo-rithm. However, for the selected case study, no significant change of the retrieved SO2 25
ACPD
10, 523–558, 2010CARIBIC and GOME-2 comparison
of the Kasatochi plume observations
K.-P. Heue et al.
Title Page
Abstract Introduction
Conclusions References
Tables Figures
◭ ◮
◭ ◮
Back Close
Full Screen / Esc
Printer-friendly Version
Interactive Discussion atmospheric SO2loads the retrieved SO2optical depth is no longer a linear function of
the atmospheric SO2 SCD. In such cases this non-linearity has to be corrected for, or alternatively, the analysis has to be performed at wavelengths with much weaker values of the SO2absorption cross section. However, the SO2absorptions investigated in this study (OD≤5%) are far below the threshold at which saturation becomes an important 5
effect.
To convert the SO2 SCD to VCD the geometrical AMF is applied: AMF=1/cos(LOS)+1/cos(SZA) where LOS and SZA are the line of sight (nadir=0◦) and the solar zenith angle, respectively. Only for the direct comparison to the CARIBIC DOAS observation (Figs. 12 and 13), radiative transfer simulations (Deutschmann, 10
2009) were performed including the same cloud and aerosol settings as for CARIBIC DOAS.
3 Observations
3.1 GOME-2 SO2distribution patterns
After the Kasatochi volcano on the Aleutian Islands, Alaska had erupted on 7 Au-15
gust 2008, part of the plume was transported to central Europe within a week. The dis-tribution and dispersion of the SO2plume was observed by various satellite instruments e.g. OMI (http://www.temis.nl/aviation/so2.php, September 2009). Theys et al. (2009) also detected enhanced BrO columns close to the source region using the GOME-2 instrument.
20
In Fig. 3 the vertical column densities based on the GOME-2 spectra are illustrated. Although the centre of the plume is still over eastern Canada reaching out to Green-land, a smaller feature stretches from the western Mediterranean to the Baltic Sea, over Central Europe. This particular sub-plume was also observed during the CARIBIC measurement flight 247 (15 August 2008), and is investigated here.
ACPD
10, 523–558, 2010CARIBIC and GOME-2 comparison
of the Kasatochi plume observations
K.-P. Heue et al.
Title Page
Abstract Introduction
Conclusions References
Tables Figures
◭ ◮
◭ ◮
Back Close
Full Screen / Esc
Printer-friendly Version
Interactive Discussion
3.2 CARIBIC-DOAS observations of the Kasatochi plume
The Lufthansa Airbus equipped with the CARIBIC container returned from Chennai (India) 15 August 2008 and crossed the plume from 05:10 to 05:50 UTC, just before descending to Frankfurt airport. The plume was apparent in the observations as an enhanced aerosol number density (Fig. 6) and increases in the carbon and sulphur 5
mass concentrations of the aerosol (Martinsson et al., 2009). The SO2 time series for the−10◦ telescope (lower part of Fig. 4) shows two significant peaks; the first one between 05:10 and 05:25 UTC and a second one between 05:38 and 05:48, when the SCD had decreased rapidly. Although the data of the upwards looking telescope (+10◦) are very noisy an enhanced SCD at 05:48 can be observed there as well.
10
For a quantitative interpretation of the observed SO2 time series, additional DOAS and other CARIBIC measurements are to be taken into account. The O4column den-sities (Fig. 4, right panels) show a major drop during the first SO2peak and decrease even further just before the second peak. This strong decrease is caused by a cloud below the flight altitude, which shields the lower and denser atmosphere. Later on, 15
the O4 signal increases again, at the moment that the aeroplane descended into the cloud. The video camera in the inlet pylon confirms the cloud cover below the aero-plane (Fig. 5). At the beginning (first SO2 peak) the cloud is optically thin therefore the O4 slant column is reduced by only 1.7×1043molec2/cm5. Later on, the cloud is
denser and the column density decreases further, until the aircraft dives through the 20
cloud. According to the rapid increase in the observed cloud liquid water (Fig. 6) the cloud top altitude is at 11 000 m±100 m. Since only the cloud top height is known, the
cloud optical thickness (COT) was adjusted to approximate the clouds’ optical proper-ties. Besides this, the cloud base was fixed to 9 km and the droplets’ single scattering albedo was also kept constant at ω=0.99. For 7 different COT values between 0.6 25
ACPD
10, 523–558, 2010CARIBIC and GOME-2 comparison
of the Kasatochi plume observations
K.-P. Heue et al.
Title Page
Abstract Introduction
Conclusions References
Tables Figures
◭ ◮
◭ ◮
Back Close
Full Screen / Esc
Printer-friendly Version
Interactive Discussion a dense cloud with an optical density of 10 at 05:44. The MODIS overpass time was at
10:02 UTC and hence≈04:30 h later than the CARIBIC observations, making a direct comparison here even more challenging than for GOME-2. The reduced intensity we observed during the first peak (Fig. 4) could not be modelled considering a bright cloud only. However if aerosols above the clouds are taken into account (Sect. 4.4) a slight 5
decrease can be simulated.
The sensitivity to local SO2 concentrations is enhanced by the cloud (Fig. 1). The AMF for the altitude range between 11 and 12 km increased from 7.9 for a clear sky approximation to 8.29 if the cloud top height is assumed to be at 11 km. This increase of less than 5%, however, is not sufficient to explain the observed peaks, especially as 10
no aersols were included in the simulation. In fact, if aerosols above the clouds are considered (Sect. 4.4) the AMF is slightly reduced despite the presence of the bright cloud. The change in the AMF for the two different clouds is less than 1%, therefore the two different peak heights (2.9 and 5.9×10¹⁶molec/cm2) can not be understood
without considering actual different concentrations. 15
Additional observations and flight parameters are given in Fig. 6. Many variables were changing during the observation of the second SO2 plume, particularly while the aircraft started its descent at 05:44. Only minutes later PV (modelled) and ozone concentration rapidly dropped from 4 to 0 PVU and from 150 to 75 ppb respectively, witnessing the re-entry into the troposphere. Just when the SO2 SCD suddenly de-20
creased by a factor of 2, cloud water appeared in a matter of seconds. This shows that the plane entered the cloud cover it had been passing over. The shorter light path through the SO2 plume inside the cloud reduces the SO2 signal. Another reason for the sharp decline in the observed SO2column might be a reduced SO2concentration due to scavenging by the cloud droplets (e.g. Lohmann et al., 2001).
25
ACPD
10, 523–558, 2010CARIBIC and GOME-2 comparison
of the Kasatochi plume observations
K.-P. Heue et al.
Title Page
Abstract Introduction
Conclusions References
Tables Figures
◭ ◮
◭ ◮
Back Close
Full Screen / Esc
Printer-friendly Version
Interactive Discussion not reach high above the flight altitude. Nevertheless as the aerosol number
concen-tration is enhanced while the plane is still at 11.6 km flight altitude, at least part of the plume reaches up to here. In the following account we assume the plume to have been between 11 and 12 km. Aerosol observations from the CALIPSO satellite in-strument also showed an enhanced aerosol number density above the cloud reaching 5
up to about≈12 km, but not significantly higher than that. As both aerosols and SO2 originated from the same source, it seems justified to assume that the SO2 layer also does not extent to altitudes above 12 km. To illustrate the effect of a varying plume thickness, several box profiles, resulting in the same SCD, are depicted in Fig. 7. A simple inversion algorithm based on the box-AMF (Fig. 1) was applied to the max-10
imum of the observed slant column densities (5.9×10¹⁷molec/cm2). From this the
volume mixing ratios (Fig. 7) for different SO2layers were retrieved. As a consequence of the varying plume thickness the vertical column density would also vary between 1×10¹⁷molec/cm2and 7×10¹⁶molec/cm2.
In accordance with the previous discussion on the plume’s altitude, the altitude range 15
between 11 and 12 km seems to be most realistic. As no aerosols above the cloud are included in these calculations, the AMFs and the mixing ratios shown here are slightly different (+8%) from those used for the comparison with GOME-2. During the period of the SO2observation the solar zenith angle changed only from 76.4
◦
to 73.2◦, by which the respective change in the AMF can be neglected.
20
4 Comparison of CARIBIC and GOME-2
For a detailed comparison with the GOME-2 observations the temporal mismatch be-tween the two observations has to be considered. The CARIBIC measurements of the Kasatochi plume were taken at 05:30 UTC±15 min, whereas MetOp-A/GOME-2 passed-over at 08:50 UTC i.e. 3 h and 20 min after the Lufthansa Airbus. Since both 25
ACPD
10, 523–558, 2010CARIBIC and GOME-2 comparison
of the Kasatochi plume observations
K.-P. Heue et al.
Title Page
Abstract Introduction
Conclusions References
Tables Figures
◭ ◮
◭ ◮
Back Close
Full Screen / Esc
Printer-friendly Version
Interactive Discussion important parameter for the trajectory calculations as the wind field changes strongly
with altitude. A first comparison without any trajectory calculation is shown in Fig. 8. The higher maximum (second CARIBIC SO2plume) coincides very well with the plume as observed by GOME-2, but for the lower one (17◦E) the only similar SO2VCD pattern is observed about 3◦N (NE) of the aeroplane’s flight track.
5
4.1 Time correction
As a first approach we use 4 h forward trajectories calculated with TRAJKS to esti-mate the plume’s position at 08:50 UTC. While the main peak of the CARIBIC DOAS measurements is correctly shifted along the Kasatochi plume, the minor peak is still offfrom the next local SO2maximum observed by GOME-2 (Fig. 9 left). The distance
10
is of the order of two GOME-2 pixels i.e.≈80 km. In the right part of Fig. 9 the cross
section along the shifted flight track is illustrated. The GOME-2 VCD of the nearest pixel is shown for each individual CARIBIC observation thereby the step-function for the GOME-2 data is created. At the position of the smaller maximum no evidence for enhanced SO2columns is observed by GOME-2.
15
Similar discrepancies are found when using the HYSPLIT trajectory model at dif-ferent altitudes (10–13 km) or the wind speeds and directions, actually measured on board of the CARIBIC Airbus (assuming these to remain constant along the trajec-tories for the subsequent 3 to 4 h; not shown). Also a change in the plume’s altitude, which is rather unlikely as the CARIBIC observations demonstrate, does not reduce the 20
distance between the maxima observed by GOME-2 and CARIBIC. The wind speed at 11–12 km altitude based on observation and models is apparently insufficient for the two maxima to match. However, the wind speeds measured by radio soundings (http://weather.uwyo.edu/upperair/sounding.html, May 2009) agree quite well with the CARIBIC data (Fig. 10). In order to compare the wind speeds for similar air masses, 25
ACPD
10, 523–558, 2010CARIBIC and GOME-2 comparison
of the Kasatochi plume observations
K.-P. Heue et al.
Title Page
Abstract Introduction
Conclusions References
Tables Figures
◭ ◮
◭ ◮
Back Close
Full Screen / Esc
Printer-friendly Version
Interactive Discussion (Slovakia) the maximum wind speed was 64 knots at 13 km altitude, which is in the
range of the CARIBIC observation (Fig. 10).
4.2 Geometrical effects
A geometrical effect, i.e. that the plume was not observed at the position of the aero-plane, but further north as the instrument was pointing north-east is possible but not 5
sufficient to explain the discrepancy in observations. The aircraft is at 11.6 km altitude and hence only 600 m above the cloud top. The horizontal distance for the−10◦ line of sight is 3.4 km. If the sun was perfectly in line with the line of sight, the maximum distance would have been 7 km. In fact the sun was only≈10◦offfrom the line of sight. Hence the geometrical effect is at least an order of magnitude too small. If the cloud 10
and the SO2 plume were at lower altitudes, which can not be excluded for the lower maximum, the geometrical shift would increase, but to shift the observations by 20 km a cloud top height of 8 km would be necessary. The assumption of such a low but dense cloud with 8 km top altitude might agree with the O4slant columns but still contradicts the video pictures (Fig. 5), where a thin and high cloud can be seen. Moreover the wind 15
speed measured by the soundings was much lower (≈40±4 knots) at 6–8 km altitude compared to the flight level, hence this larger shift caused by the viewing geometry will be outweighed by advection due to the lower wind speed.
4.3 Enhanced wind speed
Since the shift in the observation is not caused by the viewing geometry, and we are 20
quite confident concerning the plume altitude, we have to assume that the wind speed might by underestimated by two independent observations (CARIBIC and the radio soundings in Poprad-Ganovce). Or, if the wind speed is correct at the beginning, it might have increased further to the north east instead of having a decrease as derived from the trajectory calculations. However, even if the wind speed is not correct at 17◦E, 25
ACPD
10, 523–558, 2010CARIBIC and GOME-2 comparison
of the Kasatochi plume observations
K.-P. Heue et al.
Title Page
Abstract Introduction
Conclusions References
Tables Figures
◭ ◮
◭ ◮
Back Close
Full Screen / Esc
Printer-friendly Version
Interactive Discussion well with CARIBIC instrument. To reduce the complexity of the trajectory calculations
we assume a constant wind speed along the trajectories and use the wind direction observed by CARIBIC. The wind speed is increased between 16.3◦E and 18◦E, and linearly interpolated to the unchanged values within the neighbouring 0.5◦ longitude ranges. Both wind speed and direction were smoothed before calculating the new 5
trajectories.
A good agreement in the observed spatial pattern is found with a wind speed of 75 knots (Fig. 10), which is an increase of 25% compared to the CARIBIC observations (60 knots). Such a difference between observed wind speeds and model simulated can occur due to mesoscale meteorological variability (e.g. small scale filaments or waves). 10
The overlay of the DOAS data and the GOME-2 data (Fig. 11) shows that the spatial patterns of both observations match if the CARIBIC data are shifted according to the enhanced wind speed. The sharp increase of the lower maximum (≈23.5◦E) is seen by
both instruments, also the absolute level of the maximum show good agreement. The local minimum is more pronounced in the CARIBIC data than in the GOME-2. Also the 15
second maximum is observed by both measurements at the same position and with similar amplitude.
The differences observed for the local minimum in the VCD can be reduced if the wind speed in this region is locally increased, but this leads to an inconsistency with some CARIBIC data. If the wind speed is increased here the wind speed at 15.5◦ 20
(Vienna or Udine in Fig. 10) would reach the same level as the absolute maximum observed further to the west. This maximum in the wind speed coincides with the observation of stratospheric air masses (high O3 levels and low CO Fig. 6). Hence, if there was the same wind speed as in the stratospheric air masses, other indicators e.g. O3and CO concentrations, would also be expected to show similar values as later
25
ACPD
10, 523–558, 2010CARIBIC and GOME-2 comparison
of the Kasatochi plume observations
K.-P. Heue et al.
Title Page
Abstract Introduction
Conclusions References
Tables Figures
◭ ◮
◭ ◮
Back Close
Full Screen / Esc
Printer-friendly Version
Interactive Discussion
4.4 Aerosol properties and air mass factors
For ground based observations O4 column densities can be used to retrieve aerosol extinction properties (Wagner et al., 2004; Frieß et al., 2006; Irie et al., 2008). However in the current geometry this is not sufficient, because the aeroplane cruises at 11.6 km altitude where, compared to the surface, O4“concentration” (square of the O2
concen-5
tration) is an order of magnitude lower. This renders the instrument’s response for O4 much less sensitive to a change in local aerosol properties. The observed changes in the O4 column densities (Fig. 4, left) are mainly caused by the cloud cover as de-scribed in Sect. 3.2. Although O4 observations and intensity ratios (Fig. 4, right) at two wavelength intervals can be used here, the small corrections for the cloud cover 10
and the aerosol layer at flight altitude can only be estimated. The O4 observation for both viewing directions, however, was dominated by the cloud. Therefore they were weighted less for the aerosol retrieval. Based on the intensity ratio measured by the upward (+10◦) directed telescope, considering the fact that for the downward (−10◦) telescope the intensity decreases during the first peak, the best approximation was 15
an aerosol extinction of k=0.1 km−1 withω=80% single scattering albedo. The as-sumed aerosol layer extends from 11 to 12 km, hence the total aerosol optical depth equals 0.1. Similar stratospheric aerosol optical densities were observed 5 months after the Mount Pinatubo eruption (Saunders, 1993).
The CARIBIC aerosol in situ real time measurements were limited to the size range 20
from 14 to 100 nm, thus not providing any information on the larger, optically active, aerosols. Therefore we consider independent measurements. Here a complication is that clouds also influence satellite based aerosol retrievals (e.g. OMI or GOME-2), and shield the aerosols from ground based observations e.g. LIDAR. However, in the vicinity of the clouds some information can be retrieved from combined OMI/MODIS 25
ACPD
10, 523–558, 2010CARIBIC and GOME-2 comparison
of the Kasatochi plume observations
K.-P. Heue et al.
Title Page
Abstract Introduction
Conclusions References
Tables Figures
◭ ◮
◭ ◮
Back Close
Full Screen / Esc
Printer-friendly Version
Interactive Discussion altitude levels, bearing in mind the uncertainty of the temporal shifts, this can only be
used to estimate an upper limit for the AOT. The assumed single scattering albedo takes into account the enhanced carbon content in the volcanic aerosol (Martinsson et al., 2009), which usually leads to dark aerosols (Bond and Bergstrom, 2006). The aerosols here, however, are mixed with highly reflecting sulphurous aerosols and are 5
about a week old.
The air mass factors for both instruments (CARIBIC DOAS and GOME-2) were sim-ulated with the same cloud optical thickness i.e. 0.8 and 10 for the first and the second peak, respectively, using identical aerosol optical properties. While for CARIBIC the in-fluence of the different clouds on the SO2AMF is almost negligible (1% increase for the
10
dense cloud), the sensitivity for GOME-2 increases from 2.19 to 2.4 for nadir when the dense cloud is assumed, instead of the optically thin one. Compared to the geomet-rical approximation, the AMF hardly changes for the dense cloud, where the relative change is always less than+3%, depending on the viewing angle. On the other hand for the approximated thin cloud the AMF is reduced by between 5% and 8% for the 15
swath edge or the centre.
The dark aerosols (SSA =80%) lead to a reduced sensitivity for the altitude range between 11 and 12 km for both instruments. This effect is partly compensated by the bright surface of the cloud below (Fig. 1). However, if the cloud is optically thin and the instrument’s viewing direction is close to nadir, this effect is smaller as for the other 20
viewing directions, so that the AMF for the GOME-2 instrument is reduced over the thin cloud. For the pixels close to the swath edges the difference to the geometrical approximation is smaller (≈5%). For both instruments the influence of other values
for the aerosol optical thickness was simulated for both cloud coverages. A relative change in the AMF of±10% is modelled, when the aerosol optical thickness is varied 25
ACPD
10, 523–558, 2010CARIBIC and GOME-2 comparison
of the Kasatochi plume observations
K.-P. Heue et al.
Title Page
Abstract Introduction
Conclusions References
Tables Figures
◭ ◮
◭ ◮
Back Close
Full Screen / Esc
Printer-friendly Version
Interactive Discussion
4.5 Comparison
A direct comparison of the CARIBIC and GOME-2 observations is illustrated in Fig. 12. While up to Sect. 4.4 the geometrical approximation for the GOME-2 AMF was used, in fact here the estimated cloud optical thickness and aerosol extinction above the cloud are included in the simulation. The same settings were used for CARIBIC DOAS AMF 5
from the beginning, and the lower flight altitude for the last two measurements above the cloud (11 470 m and 11 280 m) was also considered.
Since the Lufthansa Airbus dived through the cloud and thereby terminated the CARIBIC DOAS observation of the volcanic SO2 at 05:48 UTC (Fig. 6), the horizon-tal extent of the plume differs between the two observational data sets. In and below 10
the cloud the uncertainty in the CARIBIC DOAS data increases and also different air masses below and above the cloud are observed by CARIBIC and GOME-2. Hence west of 16◦E (in the shifted data in Fig. 12) these datasets should not be compared.
The correlation depicted in Fig. 13, shows a good agreement between the CARIBIC and the GOME-2 data. For this final comparison all CARIBIC data points situated in 15
the same GOME-2 pixel, were averaged, thereby reducing the scatter. The offset of 8.3×10¹³±2.05×10¹⁵molec/cm2 is almost negligible, the slope deviates from unity by 7.9% with an error of 8.1% only. This signifies excellent agreement between the two observations. The correlation is more or less independent of the assumed aerosol extinction above the cloud. Although the AMFs for both GOME-2 and CARIBIC vary 20
up to 10%, the correlations of the respective vertical columns show a slope between 1.02 and 1.08. This is a consequence of a similar influence of the aerosol layer on both DOAS observations. Also the offset between the instruments and the correlation coeffecients (R2) are similar.
Conversely, if the TRAJKS correction for the overpass time is assumed (Fig. 9), 25
ACPD
10, 523–558, 2010CARIBIC and GOME-2 comparison
of the Kasatochi plume observations
K.-P. Heue et al.
Title Page
Abstract Introduction
Conclusions References
Tables Figures
◭ ◮
◭ ◮
Back Close
Full Screen / Esc
Printer-friendly Version
Interactive Discussion correlation is dominated by the high vertical columns observed in the main plume and
the background being close to zero.
5 Conclusions
CARIBIC has, for the deployment periods of near monthly repeated flights in 1997– 2002 and 2005-present, only twice observed increased particulate S/O3 ratios due 5
to volcanic eruptions. Of these two events, the Kasatochi eruption was by far the larger one (Martinsson et al., 2009). This fact is not so much due to the limited spa-tial coverage of CARIBIC but rather due to the rarity of explosive volcanic eruptions, with Pinatubo dating back even further in 1991. Unlike research aircraft that can be launched and directed to study specific volcanic plumes in greatest detail, CARIBIC 10
observations of volcanic plumes occur more or less by chance, although in this case the flight repetition rate and choice of flight destination enabled us to follow the effect of Kasatochi over a period of several months (Martinsson et al., 2009).
CARIBIC and GOME-2 were not exactly simultaneously observing the plume over Europe, which forced us to take into account the advection of the plume with the wind 15
in the time interval between the different observations. It has been shown that this basically is feasible, although we also showed that larger wind speeds than measured and modelled are needed to get an exact overlap. A good agreement between the observed spatial distributions was found if the wind speed is locally enhanced by 25%. Due to the coarse spatial and temporal coverage the enhanced wind speed is not 20
supported by radio soundings in the critical region. The observed discrepancy to the trajectory model is only local and probably due to mesoscale variabilty close to the tropoause and the jet stream. Only limited information on the wind speed can be gained from the trace gas spatial distribution inside the main plume, here additional measurements were required.
25
ACPD
10, 523–558, 2010CARIBIC and GOME-2 comparison
of the Kasatochi plume observations
K.-P. Heue et al.
Title Page
Abstract Introduction
Conclusions References
Tables Figures
◭ ◮
◭ ◮
Back Close
Full Screen / Esc
Printer-friendly Version
Interactive Discussion situ measurements. Also from independent observations only limited information could
be gained. This lack of information results in a enhanced uncertainty, which has to be kept in mind for the comparison of CARIBIC and GOME-2 observations. However, the estimation of plume altitude and thickness is based on several observations and therefore we assume it to be correct, the cloud top altitude below the plume is also 5
an important parameter and is supported by other CARIBIC observations. Because of that, no sensitivity studies for these parameters were included. The main remain-ing uncertainties are the correction of the wind speed and aerosol optical thickness. It turned out that the sensitivity of the overall correlation to the aerosol optical thickness is limited, although the vertical columns change up to 10%, while the wind speed mainly 10
influences the quality of the correlation and it has hardly any effect on the slope and background.
Altogether, a very good and defensible correlation between CARIBIC and GOME-2 observations was found, with a slope deviating from unity by less than 10%. The present comparison aircraft vs. satellite observations reveals, despite incomplete in-15
formation, an interesting and fundamentally good agreement. The comparison of the CARIBIC measurements with GOME-2 satellite observations is a good basis for future common research projects.
Acknowledgements. Finally, we thank Andreas Waibel, Thomas Dauer, Sven Dankart and Detlev Hartwig and the entire Lufthansa Airlines and Lufthansa Technik and of course the
20
CARIBIC Team for their commitment and support. The DOAS System was build and operated by the Institut f ¨ur Umweltphysik of the Universit ¨at Heidelberg. Rinus Scheele is acknowledged for helping with the trajectory calculations.
The development and operation of the CARIBIC system has been financially supported by the German Ministry of Education and Science (AFO 2000), by the European Commission’s
25
DGXII Environment RTD 4th, 5th and 6th Framework programs, by the Max-Planck-Society, EON-Ruhrgas and Frankfurt Airport.
The service charges for this open access publication have been covered by the Max Planck Society.
ACPD
10, 523–558, 2010CARIBIC and GOME-2 comparison
of the Kasatochi plume observations
K.-P. Heue et al.
Title Page
Abstract Introduction
Conclusions References
Tables Figures
◭ ◮
◭ ◮
Back Close
Full Screen / Esc
Printer-friendly Version
Interactive Discussion
References
Bogumil, K., Orphal, J., Voigt, S., Bovensmann, H., Fleischmann, O. C., Hartmann, M., Homann, T., Spietz, P., Vogel, A., and Burrows, J. P.: Reference Spectra of Atmospheric Trace Gases Measured the SCIAMACHY PFM Satellite Spectrometer, Proc. 1st Europ. Sym-pos. Atmos. Meas. from Space (ESAMS-99), ISSN 1022-6656, ESA-ESTEC, Noordwijk, 2,
5
443–447, 1999. 530
Bogumil, K., Orphal, J., Homann, T., Voigt, S., Spietz, P., Fleischmann, O. C., Vogel, A., Hart-mann, M., BovensHart-mann, H., Frerik, J., and Burrows, J. P.: Measurements of Molecular Ab-sorption Spectra with the SCIAMACHY Pre-Flight Model: Instrument Characterization and Reference Data for Atmospheric Remote-Sensing in the 230–2380 nm Region J. Photoch.
10
Photobio. A, 157, 167–184, 2003 528
Bond, T. C. and Bergstrom, R. W.: Light absorption by carbonaceous particles: an investigative review, Aerosol Sci. Tech., 40, 27–67, doi:10.1080/2786820500421521, 2006. 539
Brenninkmeijer, C. A. M., Crutzen, P., Boumard, F., Dauer, T., Dix, B., Ebinghaus, R., Filippi, D., Fischer, H., Franke, H., Frieß, U., Heintzenberg, J., Helleis, F., Hermann, M., Kock, H.
15
H., Koeppel, C., Lelieveld, J., Leuenberger, M., Martinsson, B. G., Miemczyk, S., Moret, H. P., Nguyen, H. N., Nyfeler, P., Oram, D., O’Sullivan, D., Penkett, S., Platt, U., Pupek, M., Ramonet, M., Randa, B., Reichelt, M., Rhee, T. S., Rohwer, J., Rosenfeld, K., Scharffe, D., Schlager, H., Schumann, U., Slemr, F., Sprung, D., Stock, P., Thaler, R., Valentino, F., van Velthoven, P., Waibel, A., Wandel, A., Waschitschek, K., Wiedensohler, A., Xueref-Remy,
20
I., Zahn, A., Zech, U., and Ziereis, H.: Civil Aircraft for the regular investigation of the at-mosphere based on an instrumented container: The new CARIBIC system, Atmos. Chem. Phys., 7, 4953–4976, 2007,
http://www.atmos-chem-phys.net/7/4953/2007/. 524
Deutschmann, T.: Atmospheric Radiative Transfer Modelling with Monte Carlo Methods,
25
Diploma Thesis Universi ¨at Heidelberg, 2009. 528, 531
Dix, B., Brenninkmeijer, C. A. M., Frieß, U., Wagner, T., and Platt, U.: Airborne multi-axis DOAS measurements of atmospheric trace gases on CARIBIC long-distance flights, Atmos. Meas. Tech. Discuss., 2, 265–301, 2009,
http://www.atmos-meas-tech-discuss.net/2/265/2009/. 526, 527
30
ACPD
10, 523–558, 2010CARIBIC and GOME-2 comparison
of the Kasatochi plume observations
K.-P. Heue et al.
Title Page
Abstract Introduction
Conclusions References
Tables Figures
◭ ◮
◭ ◮
Back Close
Full Screen / Esc
Printer-friendly Version
Interactive Discussion
aerosols: 2. Modelling studies, J. Geophys. Res., 111, D14203, doi:10.1029/2005JD006618, 2006. 538
G ¨ur, B., Spietz, P., Orphal, J., and Burrows, J.: Absorption Spectra Measurements with the GOME-2 FMs using the IUP/IFE-UBs Calibration Apparatus for Trace Gas Absorption Spec-troscopy CATGAS, Final Report, IUP University of Bremen, Oct., 2005. 530
5
Grainger, J. and Ring, J.: Anomalous Fraunhofer line profiles, Nature, 193, 762, 1962. 528 Heue, K.-P.: Airborne Multi AXes DOAS instrument and measurements of two dimensional
trace gas distribution, Ph.D. thesis, Universit ¨at Heidelberg, Germany, 2005. 528
Irie, H., Kanaya, Y., Akimoto, H., Iwabuchi, H., Shimizu, A., and Aoki, K.: First retrieval of tro-pospheric aerosol profiles using MAX-DOAS and comparison with lidar and sky radiometer
10
measurements, Atmos. Chem. Phys., 8, 341–350, 2008, http://www.atmos-chem-phys.net/8/341/2008/. 538
Khelif, D., Burns, S. P., and Friehe, C. A.: Improved Wind Measurements on Research Aircraft, J. Atmos. Ocean. Tech., 16, 860–875 1999. 529
Kraus, S.: DOASIS – A Framework Design for DOAS, Shaker, 2006. 528
15
Lohmann, U., Leaitch, W. R., Barrie, L., Law, K., Yi, Y., Bergmann, D., Bridgeman, C., Chin, M., Christensen, J., Easter, R., Feichter, J., Jeuken, A., Kjellstr ¨om, E., Koch, D., Rasch, P., and Roelofs, G.-J.: Vertical distributions of sulfur species simulated by large scale atmospheric models in COSAM: comparison with observations, Tellus B, 53(5), 646–672, 2001. 533 Martinsson, B. G., Brenninkmeijer, C. A. M., Carn, S. A., Hermann, M., Heue, K.-P., van
20
Velthoven, P. F. J., and Zahn, A.: Influence of the 2008 Kasatochi volcanic eruption on sulfurous and carbonaceous aerosol constituents in the lower stratosphere, Geophys. Res. Lett., 36, L12813, doi:10.1029/2009GL038735, 2009. 525, 532, 539, 541
Nguyen, H. N., Gudmundsson, A., and Martinsson, B. G.: Design and calibration of a multi-channel aerosol sampler for tropopause region studies from the CARIBIC platform, Aerosol
25
Sci. Tech., 40, 649–655, 2006. 526
Platt, U. and Stutz, J.: Differential Optical Absorption Spectroscopy, Principles and Applications, Springer Berlin Heidelberg, 2008. 525, 526, 530
Richter, A., Wittrock, F., Sch ¨onhardt, A., and Burrows, J. P.: Quantifying volcanic SO2 emis-sions using GOME-2 measurements, Poster presentation: EGU General Assembly,
Vi-30
ACPD
10, 523–558, 2010CARIBIC and GOME-2 comparison
of the Kasatochi plume observations
K.-P. Heue et al.
Title Page
Abstract Introduction
Conclusions References
Tables Figures
◭ ◮
◭ ◮
Back Close
Full Screen / Esc
Printer-friendly Version
Interactive Discussion
Saunders, R.: Radiative properties of Mount Pinatubo volcanic aerosols over the tropical At-lantic, Geophys. Res. Lett., 20, 137–140, 1993. 538
Scheele, M. P., Siegmund, P. C., and van Velthoven, P. F. J.: Sensitivity of trajectories to data resolution and its dependence on the starting point: in or outside a tropopause fold, Meteorol. Appl., 3, 267–273, 1996. 525, 529
5
Schuck, T. J., Brenninkmeijer, C. A. M., Slemr, F., Xueref-Remy, I., and Zahn, A.: Green-house gas analysis of air samples collected on board the CARIBIC passenger aircraft, At-mos. Meas. Tech., 2, 449–464, 2009,
http://www.atmos-meas-tech.net/2/449/2009/. 526
Stohl, A., Haimberger, L., Scheele, M. P., and Wernli, H.: An intercomparison of results from
10
three trajectory models, Meteorol. Appl., 8, 127–135, 2001. 525, 529
Theys, N., van Roozendael, M., Dils, B., Hendrick, F., Hao, N., and De Maziere, M.: First satel-lite detection of volcanic bromine monoxide emission after the Kasatochi eruption, Geophys. Res. Lett., 36, L03809, doi:10.1029/2008gl036552, 2009. 531
van Roozendael, M., Loyola, D., Spurr, R., Balis, D., Lambert, J.-C., Livschitz, Y., Valks, P.,
15
Ruppert, T., Kenter, P., Fayt, C., and Zehner, C.: Ten years of GOME/ERS-2 total ozone data-The new GOME data processor (GDP) version 4: 1. Algorithm description, J. Geophys. Res., 111, D14311, doi:10.1029/2005JD006375, 2006. 530
Wagner, T., Dix, B., von Friedeburg, C., Frieß, U., Sanghavi, S., Sinreich, R., and Platt, U.: MAX-DOAS O4 measurements: A new technique to derive information on
atmo-20
spheric aerosols – Principles and information content, J. Geophys. Res., 109, D22205, doi:10.1029/2004JD004904, 2004. 528, 538
Wagner, T., Beirle, S., and Deutschmann, T.: Three-dimensional simulation of the Ring effect in observations of scattered sun light using Monte Carlo radiative transfer models, Atmos. Meas. Tech., 2, 113–124, 2009,
25
ACPD
10, 523–558, 2010CARIBIC and GOME-2 comparison
of the Kasatochi plume observations
K.-P. Heue et al.
Title Page
Abstract Introduction
Conclusions References
Tables Figures
◭ ◮
◭ ◮
Back Close
Full Screen / Esc
Printer-friendly Version
Interactive Discussion
0 2 4 6 8 10 12 14 16
0 2 4 6 8 10 0 2 4 6 8 10
-10°
Box AMF
A
lt
it
u
d
e
[
k
m]
Cloud Top Altitude 11 km
6 km no clouds
+10°
Box AMF
Flight altitude
Fig. 1. Box-AMF for the CARIBIC DOAS instrument for two different cloud top altitudes and
ACPD
10, 523–558, 2010CARIBIC and GOME-2 comparison
of the Kasatochi plume observations
K.-P. Heue et al.
Title Page
Abstract Introduction
Conclusions References
Tables Figures
◭ ◮
◭ ◮
Back Close
Full Screen / Esc
Printer-friendly Version
Interactive Discussion
310 312 314 316 318 320 322 324 326 328 330 332
0 20 40 60 80 100
Wavelength [nm] 312-330 nm
Fitted SO
2 cross section
Fit + residual
Spectrum B2000319 15 August 2008 5:43:32-5:48:37
SCD = 4.47⋅10
17molec/cm
2Fig. 2.Example fit for SO2, (sum of 10 spectra) recorded between 05:43:32 and 05:48:37 UTC
ACPD
10, 523–558, 2010CARIBIC and GOME-2 comparison
of the Kasatochi plume observations
K.-P. Heue et al.
Title Page
Abstract Introduction
Conclusions References
Tables Figures
◭ ◮
◭ ◮
Back Close
Full Screen / Esc
Printer-friendly Version
Interactive Discussion
Fig. 3.Distribution of the Kasatochi SO2plume (mostly north of 40◦) one week after the eruption
ACPD
10, 523–558, 2010CARIBIC and GOME-2 comparison
of the Kasatochi plume observations
K.-P. Heue et al.
Title Page Abstract Introduction Conclusions References Tables Figures ◭ ◮ ◭ ◮ Back Close
Full Screen / Esc
Printer-friendly Version Interactive Discussion 0.6 0.8 1.0 1.2 1.4 1.6 1.8 2.0
15.08.2008 04:00 15.08.2008 05:00 15.08.2008 06:00
0.6 0.8 1.0 1.2 1.4 1.6 1.8 2.0
15.08.2008 04:00 15.08.2008 05:00 15.08.2008 06:00
-4 -2 0 2 4 6 8 -4 -2 0 2 4 6 8 -10° R a d ia n c e r e la ti v e t o t h e r e fe re n c e roll roll roll
Radiance 322 nm Radiance 360 nm roll R a d ia n c e r e la ti v e t o t h e r e fe re n c e
Date Time [UTC]
S O2 d S C D [ 1 0 1
7 m
o le c /c m 2]
Date Time [UTC]
-4000 -3500 -3000 -2500 -2000 -1500 -1000 -500 0 500 1000 O4 d S C D * [1 0 4
0 m
o le c 2/c m 5] S O2 d S C D [ 1 0 1
7 m
o le c /c m 2]
SO2 dSCD O4 dSCD*
+10° -800 -700 -600 -500 -400 -300 -200 -100 0 100 200 300 400 500 O 4 d S C D * [1 0 4
0 m
o le c 2/c m 5]
Fig. 4.left: Time series of SO2and O4dSCDs for the two viewing directions−10◦(bottom) and
ACPD
10, 523–558, 2010CARIBIC and GOME-2 comparison
of the Kasatochi plume observations
K.-P. Heue et al.
Title Page
Abstract Introduction
Conclusions References
Tables Figures
◭ ◮
◭ ◮
Back Close
Full Screen / Esc
Printer-friendly Version
Interactive Discussion
Fig. 5.Picture of the cloud cover at 05:17 UTC (the time shown is local time in Frankfurt). Like
ACPD
10, 523–558, 2010CARIBIC and GOME-2 comparison
of the Kasatochi plume observations
K.-P. Heue et al.
Title Page Abstract Introduction Conclusions References Tables Figures ◭ ◮ ◭ ◮ Back Close
Full Screen / Esc
Printer-friendly Version Interactive Discussion Frankfurt Chennai Prostejov Kümmersbruck Prague Vienna Poprad-Ganovce Udine
Longitude (o
E) L a ti tu d e ( oN ) Budapest
Flight #247 Chennai -> Frankfurt, August 14-15, 2008
P o t. V o rt ici ty [P V U ] A lt it u d e [ km ] C O [ p p b ] P re ssu re [m b a r] T e m p e ra tu re [° C ] L o n g it u d e ( oE ) O zo n e [p p b ] Ae ro so ls > 1 2 n m [1 0 3 /cm -3 ]
Date Time [UTC]
S O 2 [1 0 1 7 m o le c/ cm 2 ] W in d sp e e d [ kn o ts] H u m id ity / C lo u d w a te r
Fig. 6. Overview of the CARIBIC flight track and selected measurements for 04:00 to
ACPD
10, 523–558, 2010CARIBIC and GOME-2 comparison
of the Kasatochi plume observations
K.-P. Heue et al.
Title Page
Abstract Introduction
Conclusions References
Tables Figures
◭ ◮
◭ ◮
Back Close
Full Screen / Esc
Printer-friendly Version
Interactive Discussion 0
2 10 12 14 16 18
0 20 40 60 80 100
Mixing ratio [ppb]
A
lt
it
u
d
e
[
k
m
]
11-12 km, AMF=8.29
11-12.5 km, AMF=7.09
11-13 km, AMF=6.46
11-14 km, AMF=5.8
SCD = 5.9 10
17molec/cm
2Fig. 7.SO2box profiles, that lead to the observed SCD of 5.9×10¹⁷molec/cm2. The black line
ACPD
10, 523–558, 2010CARIBIC and GOME-2 comparison
of the Kasatochi plume observations
K.-P. Heue et al.
Title Page
Abstract Introduction
Conclusions References
Tables Figures
◭ ◮
◭ ◮
Back Close
Full Screen / Esc
Printer-friendly Version
Interactive Discussion
0 5 10 15 20 25 30 35
40 42 44 46 48 50 52 54 56 58
L
a
ti
tu
d
e
G
O
M
E
-2
C
e
n
tr
e
Longitude GOME-2 Centre
0 1 2 3 4 5 6 7 8 9 10
VCD 1016
Fig. 8. GOME-2 and CARIBIC DOAS SO2 vertical column density. No time correction is
ACPD
10, 523–558, 2010CARIBIC and GOME-2 comparison
of the Kasatochi plume observations
K.-P. Heue et al.
Title Page Abstract Introduction Conclusions References Tables Figures ◭ ◮ ◭ ◮ Back Close
Full Screen / Esc
Printer-friendly Version
Interactive Discussion
0 10 20 30
40 42 44 46 48 50 52 54 56 58
10 15 20 25 30
-1 0 1 2 3 4 5 6 7 8 9 10
GOME-2 and CARIBIC SO2 on 15 Aug. 2008 CARIBIC Data shift along TRAJKS trajectories to 8:50
L a ti tu d e G O M E -2 C e n te r
Longitude GOME-2 Center
0 1 2 3 4 5 6 7 8 9 10
VCD 1016
CARIBIC GOME-2 S O2 V C D [ 1 0 1
6 m
o le c /c m 2]
Longitude [°East]
Fig. 9. Similar to Figure 8 but the CARIBIC SO2 data are shifted relative to the flight track
ACPD
10, 523–558, 2010CARIBIC and GOME-2 comparison
of the Kasatochi plume observations
K.-P. Heue et al.
Title Page Abstract Introduction Conclusions References Tables Figures ◭ ◮ ◭ ◮ Back Close
Full Screen / Esc
Printer-friendly Version
Interactive Discussion
10 15 20 25 30
0 20 40 60 80 100 120 W in d s p e e d [ k n o ts ] Longitude [°East] CARIBIC Radiosondes KNMI Trajectories Optimized wind speed
B u d a p e s t P o p ra d -G a n v o c e K ü mme rs b ru c k P ra g u e V ie n n a U d in e P ro s te jo v
Fig. 10. Wind speed on 15 August 2008 observed by CARIBIC and by radio soundings
ACPD
10, 523–558, 2010CARIBIC and GOME-2 comparison
of the Kasatochi plume observations
K.-P. Heue et al.
Title Page Abstract Introduction Conclusions References Tables Figures ◭ ◮ ◭ ◮ Back Close
Full Screen / Esc
Printer-friendly Version
Interactive Discussion
0 10 20 30
40 42 44 46 48 50 52 54 56 58
10 15 20 25 30
-1 0 1 2 3 4 5 6 7 8 9 10 11 L a ti tu d e G O M E -2 C e n tr e
$#!'(GOME-2 Centre
0 1 2 3 4 5 6 7 8 9 10
VCD 1016
GOME-2 and CARIBIC SO2 on 15 Aug. 2008 CARIBIC Data shift along corrected wind to 8:50
CARIBIC GOME-2 S O2 V C D [ 1 0 1
6 m
o le c /c m 2]
Longitude [°East]
Fig. 11. Similar to Figs. 8 and 9 but the CARIBIC SO2 data are shifted relative to the flight
ACPD
10, 523–558, 2010CARIBIC and GOME-2 comparison
of the Kasatochi plume observations
K.-P. Heue et al.
Title Page
Abstract Introduction
Conclusions References
Tables Figures
◭ ◮
◭ ◮
Back Close
Full Screen / Esc
Printer-friendly Version
Interactive Discussion
10 15 20 25 30
-2 0 2 4 6 8 10
GOME-2 geometrical
GOME-2 (k=0.1 ω=0.8 different clouds) CARIBIC (k=0.1 ω=0.8 different clouds)
S
O 2
V
C
D
[
1
0
1
6 m
o
le
c
/c
m
2 ]
Longitude [° East] thin cloud dense
cloud
Fig. 12. Comparison of CARIBIC DOAS and GOME-2 SO2 vertical column densities. Beside
ACPD
10, 523–558, 2010CARIBIC and GOME-2 comparison
of the Kasatochi plume observations
K.-P. Heue et al.
Title Page
Abstract Introduction
Conclusions References
Tables Figures
◭ ◮
◭ ◮
Back Close
Full Screen / Esc
Printer-friendly Version
Interactive Discussion
-2 0 2 4 6 8 10
-2 0 2 4 6 8 10
1/ )(+&#. (0
+
),-& 2
+0&.$&-0 2 *,)&$$*
$,+'(%&+$& )&1&)
S
O 2
V
C
D
G
O
M
E
-2
[
1
0
1
6 m
o
le
c
/c
m
2 ]
!
*,)&$$*"
Fig. 13.Correlation plot of SO2vertical columns observed by GOME-2 vs. averaged CARIBIC