ACPD
13, 11357–11394, 2013δ13C of toluene in the lower troposphere
J. Wintel et al.
Title Page
Abstract Introduction
Conclusions References
Tables Figures
◭ ◮
◭ ◮
Back Close
Full Screen / Esc
Printer-friendly Version
Interactive Discussion
Discussion
P
a
per
|
Dis
cussion
P
a
per
|
Discussion
P
a
per
|
Discussio
n
P
a
per
|
Atmos. Chem. Phys. Discuss., 13, 11357–11394, 2013 www.atmos-chem-phys-discuss.net/13/11357/2013/ doi:10.5194/acpd-13-11357-2013
© Author(s) 2013. CC Attribution 3.0 License.
Atmospheric Chemistry and Physics
Open Access
Discussions
Geoscientiic Geoscientiic
Geoscientiic Geoscientiic
This discussion paper is/has been under review for the journal Atmospheric Chemistry and Physics (ACP). Please refer to the corresponding final paper in ACP if available.
Stable carbon isotope ratios of toluene in
the boundary layer and the lower free
troposphere
J. Wintel, E. H ¨osen, R. Koppmann, and M. Krebsbach
Physics Department, University of Wuppertal, Wuppertal, Germany
Received: 25 March 2013 – Accepted: 18 April 2013 – Published: 26 April 2013
Correspondence to: J. Wintel (wintel@uni-wuppertal.de)
ACPD
13, 11357–11394, 2013δ13C of toluene in the lower troposphere
J. Wintel et al.
Title Page
Abstract Introduction
Conclusions References
Tables Figures
◭ ◮
◭ ◮
Back Close
Full Screen / Esc
Printer-friendly Version
Interactive Discussion
Discussion
P
a
per
|
Dis
cussion
P
a
per
|
Discussion
P
a
per
|
Discussio
n
P
a
per
|
Abstract
Measurements of stable carbon isotope ratios in VOC are a powerful tool to identify sources or to track both dynamical and chemical processes.
During the field campaign ZEPTER-2 in autumn 2008 whole air samples were col-lected on board a Zeppelin NT airship in the planetary boundary layer and the lower
5
free troposphere over south-west Germany. These samples were analysed with re-spect to VOC mixing ratios and stable carbon isotope ratios using a gas chromato-graph combustion isotope ratio mass spectrometer. In this study we present the results for toluene, one of the major anthropogenic pollutants.
In the boundary layer we observed rather fresh emissions mixing into the background
10
and derived a toluene source isotope ratio ofδ13C=−28.2±0.5 ‰. Using the concept of the effective kinetic isotope effect, we were able to separate the effects of dilution processes and photochemical degradation in the free troposphere. We estimated the photochemical age of toluene in the atmosphere in two different ways (using isotope ratios and mixing ratios, respectively). The results differ strongly in the planetary
bound-15
ary layer, probably due to mixing processes, but are compatible with each other in the free troposphere.
1 Introduction
Despite their low concentrations, volatile organic compounds (VOC) play an important role in atmospheric (especially tropospheric) chemistry. The majority of anthropogenic
20
VOC emissions stems from fossil fuel use and is emitted predominantly during road transport and oil production. The most abundant species being emitted in this context, are toluene and benzene (e.g. Williams and Koppmann, 2007; Reimann and Lewis, 2007).
Rudolph et al. (1997) presented a method to determine stable carbon isotope
ra-25
ACPD
13, 11357–11394, 2013δ13C of toluene in the lower troposphere
J. Wintel et al.
Title Page
Abstract Introduction
Conclusions References
Tables Figures
◭ ◮
◭ ◮
Back Close
Full Screen / Esc
Printer-friendly Version
Interactive Discussion
Discussion
P
a
per
|
Dis
cussion
P
a
per
|
Discussion
P
a
per
|
Discussio
n
P
a
per
|
isotope ratio mass spectrometry (GC-C-IRMS). They proposed that measurements of the isotopic composition of VOC, beside measurements of their concentrations, would lead to valuable additional information on atmospheric processes, e.g. photochemical degradation. This initial methodology has been followed by a number of studies on this subject (see e.g. the review of Goldstein and Shaw, 2003, and references therein).
5
Stable carbon isotope ratios in VOC were measured in various regions, affected by different amounts of air pollution (Tsunogai et al., 1999; Rudolph et al., 2002; Redeker et al., 2007; Nara et al., 2007; Saito et al., 2009; Spahn, 2009). Rudolph et al. (2002) measured isotope ratios in atmospheric VOC close to their anthropogenic sources. Several laboratory studies investigated the kinetic isotope effects for reactions between
10
VOC and different reactants (Anderson et al., 2003, 2004a,b; Iannone et al., 2008, 2009; Farkas et al., 2003; Rudolph et al., 2000). By applying the concept of the hydro-carbon clock on VOC isotopologues, stable carbon isotope ratios have also been used to determine the photochemical age of VOC in the atmosphere (Rudolph and Czuba, 2000; Rudolph et al., 2003; Saito et al., 2002, 2009).
15
2 Theoretical background for the interpretation of isotope ratios
All isotope ratios given in this paper are expressed in theδ-notation, relative to the Vienna-Peedee Belemnite (V-PDB) standard for stable carbon isotope analysis. Theδ
value is defined as the relative deviation from the standard’s isotope ratio (Craig, 1957).
δ13C= 13
C/12C
sample−
13
C/12C
V-PDB
13C/12C
V-PDB
×1000 ‰ (1)
20
13C/12C
V-PDB=0.0112372 (2)
A necessary requirement for the interpretation of isotope ratios is the knowledge of the
ACPD
13, 11357–11394, 2013δ13C of toluene in the lower troposphere
J. Wintel et al.
Title Page
Abstract Introduction
Conclusions References
Tables Figures
◭ ◮
◭ ◮
Back Close
Full Screen / Esc
Printer-friendly Version
Interactive Discussion
Discussion
P
a
per
|
Dis
cussion
P
a
per
|
Discussion
P
a
per
|
Discussio
n
P
a
per
|
the relative difference between the rate coefficientsk of two different isotopologues of the same compound. For example, the KIE (with respect to stable carbon isotopes) for the dominant reaction of toluene with OH is (Rudolph, 2007):
εOH=
kOH
12
C7H8
kOH 13C12C6H8
−1
×1000 ‰=5.95±0.28 ‰ (3)
5
In many atmospheric situations an air parcel is affected not only by chemical reactions but also by dilution processes. The concept of theeffective kinetic isotope effect εeff
includes both: a chemical loss reaction (with OH in this case) with the kinetic isotope effect εOH and the time constant τOH, as well as a dilution process (by mixing with
“zero” background air) with the time constant τdil, which does not result in isotopic 10
fractionation.
εeff=
εOH/τOH
1/τOH+1/τdil
(4)
For a substance emitted at time t=0, the following equation can be derived, which relates the changes in the VOC mixing ratio c to the changes in the isotope ratio δ
15
(Rudolph, 2007).
δ(t)=δ(0)−εeffln
c(t) c(0)
(5)
If air masses are mixed, which contain “fresher” and “older” amounts of the same sub-stance, respectively, Eq. (5) is invalid. In these cases, provided that chemical
process-20
ACPD
13, 11357–11394, 2013δ13C of toluene in the lower troposphere
J. Wintel et al.
Title Page
Abstract Introduction
Conclusions References
Tables Figures
◭ ◮
◭ ◮
Back Close
Full Screen / Esc
Printer-friendly Version
Interactive Discussion
Discussion
P
a
per
|
Dis
cussion
P
a
per
|
Discussion
P
a
per
|
Discussio
n
P
a
per
|
(V1≪V2), the resulting isotope ratioδ and the VOC concentrationcare linked to each
other by the following equation (Rudolph, 2007):
δ=δ1+
(δ2−δ1)c2
c (6)
The photochemical age (see Parrish et al., 1992) of a certain compound in an air
5
mass is a measure for the degree of photochemical processing this compound has experienced since it has been released to the atmosphere. It is defined as
[OH]avgt=
t Z
0
[OH] dt′ (7)
and can be derived from isotopic measurements (Rudolph and Czuba, 2000) via:
10
[OH]avgt=
δ(t)−δ(0)
εOHkOH (8)
Even in cases when air masses mix, which contain different “ages” of the same com-pound, Eq. (8) can be applied and gives a concentration-weighted mean photochemical age, provided thatδ(0) is the same for both air masses (Rudolph and Czuba, 2000).
15
Also, if two compounds (aandb) with different reaction constants (kOHa andkOHb)
are emitted from the same source in a certain known ratio (ca(0)/cb(0)), their photo-chemical age can be calculated from their concentrations (ca(t) andcb(t)) at a given
timet. This is the “conventional” way to calculate the photochemical age (see Roberts et al., 1984; Rudolph and Johnen, 1990; Parrish et al., 1992).
20
[OH]avgt=
1
kOHb−kOHa
ln
c a(t) cb(t)
−ln
c a(0) cb(0)
(9)
It should be mentioned, that photochemical ages derived from Eq. (9), may be strongly biased if air masses of different ages mix (see e.g. Rudolph and Johnen, 1990; McKeen et al., 1990, 1996; Rudolph and Czuba, 2000; Saito et al., 2009).
ACPD
13, 11357–11394, 2013δ13C of toluene in the lower troposphere
J. Wintel et al.
Title Page
Abstract Introduction
Conclusions References
Tables Figures
◭ ◮
◭ ◮
Back Close
Full Screen / Esc
Printer-friendly Version
Interactive Discussion
Discussion
P
a
per
|
Dis
cussion
P
a
per
|
Discussion
P
a
per
|
Discussio
n
P
a
per
|
3 Experiment
3.1 Measurement campaign
The ZEPTER-2 campaign took place in the Lake Constance region in south-west Ger-many, a rural site with small townships and no large industries, in autumn 2008. The main objective of the campaign was to study the photochemical transformation of VOC
5
and NOx due to free radicals (OH, HO2), the production of ozone as well as the for-mation and aging of secondary aerosol in the lower troposphere, i.e. the planetary boundary layer and the free troposphere directly above.
AZeppelin NT airship served as the measurement platform. It consists of a helium-filled envelope with a volume of about 8400 m3 covering an internal lightweight, rigid
10
structure. Most of the scientific instruments were installed inside the cabin in the gon-dola beneath. Four propellers (three of them mounted pivoted) allow a full maneuver-ability at low speed or even stagnation. Depending on the environmental conditions, the Zeppelin can reach a maximum height of about 3000 m and a maximum speed of about 115 km h−1. The maximum scientific payload is about 1 t (ZLT Zeppelin Luftschifftechnik
15
GmbH & Co KG). Due to these features the Zeppelin NT is an excellent platform for atmospheric measurements in the lower troposphere.
The Zeppelin was equipped, in different configurations, with instruments for the mea-surement of CO, NOx, O3, HONO, CH2O, particles, VOC, OH, column densities and
photolysis frequencies of several trace gases. The instruments were operated by J ¨ulich
20
Research Centre, University of Heidelberg and University of Wuppertal. In addition, meteorological parameters were measured.
The airborne measurements were supported by groundbased measurements using a mobile laboratory (a modified van, equipped with instruments for the measurement of particles, NOx, CO, O3 and VOC), which gave information about particle and trace 25
gas sources on the ground.
ACPD
13, 11357–11394, 2013δ13C of toluene in the lower troposphere
J. Wintel et al.
Title Page
Abstract Introduction
Conclusions References
Tables Figures
◭ ◮
◭ ◮
Back Close
Full Screen / Esc
Printer-friendly Version
Interactive Discussion
Discussion
P
a
per
|
Dis
cussion
P
a
per
|
Discussion
P
a
per
|
Discussio
n
P
a
per
|
the European Air Pollution Dispersion (EURAD) model (for more information about ZEPTER-2 and the Zeppelin NT also see H ¨aseler et al., 2009; Urban, 2010).
3.2 Whole air sampler
Ambient whole air samples were collected using the ZEBIS (ZEppelin Based Isotope Sampler) instrument and afterwards analysed in the laboratory using a GC-C-IRMS
5
system. ZEBIS consists of a swing piston compressor (NPK09 DC, KNF Neuberger), a custom-made electrical control unit and two canister modules, each containing four evacuated SilcoCanTM canisters (Restek GmbH, Bad Homburg, Germany) with a vol-ume of 6 L (see Fig. 1).
The compressor is operated continuously during a flight. At times when no canister
10
is being pressurized, the exhaust valve at the end of the sample line is opened and the compressor provides a flow of∼8 Ln min−1, thus flushing the system. Each canister is locked by a normally closed solenoid valve (Clippard Europe, S.A., Louvain-la-Neuve, Belgium), which can be switched both manually or automatically. To fill a certain can-ister, the corresponding solenoid valve is opened and the exhaust valve at the end of
15
the sample line is closed simultaneously. When a pressure of 4 bar is reached, both valves are switched again, thereby closing the canister and allowing the sample line to be flushed. During ZEPTER-2 it took ∼3–5 min to fill one canister, depending on the flight level.
The samples were taken from the meteorology mast in front of the Zeppelin NT
gon-20
dola using a 10 m inlet line (1/4′′ FEP hose, 3 mm ID, Bohlender GmbH, Gr ¨unsfeld, Germany). Particles, OH, ozone, H2O and CO2 might corrupt the measurements of carbon isotopes in VOC. The inlet was equipped with a particle filter (Bohlender GmbH) that removes particles larger than 10 µm. OH radicals are destroyed by col-lision with the line wall. A special ozone-removing device did not seem to be
neces-25
ACPD
13, 11357–11394, 2013δ13C of toluene in the lower troposphere
J. Wintel et al.
Title Page
Abstract Introduction
Conclusions References
Tables Figures
◭ ◮
◭ ◮
Back Close
Full Screen / Esc
Printer-friendly Version
Interactive Discussion
Discussion
P
a
per
|
Dis
cussion
P
a
per
|
Discussion
P
a
per
|
Discussio
n
P
a
per
|
(7±4)×10−23cm3molecule−1s−1 (Atkinson and Lloyd, 1984). H2O is removed in the
laboratory system prior to analysis, CO2 is separated chromatographically from the
VOC sample (see Sect. 3.3).
In total, 25 flights were carried out on 14 days between 17 October 2008 and 8 November 2008 at different times of day (including the night), taking off from
5
Friedrichshafen (47◦39′N , 9◦28′E ). The ZEBIS whole air sampler was operated on
board during 11 flights between 25 October 2008 and 7 November 2008. The individ-ual flights passed over several regions of different landuse, the Lake Constance, two forests (Altdorf forest and Tettnang forest), grassland and the city of Ravensburg. In this paper we present data of samples gathered during five flights (see Table 1).
10
3.3 Laboratory system
The air samples were analysed using a commercial gas chromatograph combustion isotope ratio mass spectrometer (GC-C-IRMS), consisting of: (i) a thermal desorption system (TDS) with water traps for sample preparation, combined with a cold injection system (CIS) to transfer the sample to the gas chromatograph, (ii) a gas chromatograph
15
(GC), equipped with a cold trapping system (CTS) to cryo-focus the sample at the beginning of the column, (iii) a combustion furnace to oxidize the VOC to CO2 and
H2O, followed by a water trap to remove the produced H2O, and (iv) an isotope ratio
mass spectrometer (IRMS) to determine the13C/12C ratios of the individual VOC. The GC-IRMS used in this study is very similar to the system described by Iannone et al.
20
(2007). Therefore, the individual parts of the system are described only briefly here. The TDS (TDSG Large, Gerstel GmbH&Co. KG, M ¨uhlheim a.d. Ruhr, Germany) is used to cryogenically extract the VOC from the whole air sample, to remove the sample humidity and to determine the sample volume. The flow rate during preconcentration was set to 1 Ln min−1. The water traps are Silcosteel treated (Restek GmbH, Bad
Hom-25
burg, Germany) stainless steel tubes operated at a temperature of−20◦C. Thorough
ACPD
13, 11357–11394, 2013δ13C of toluene in the lower troposphere
J. Wintel et al.
Title Page
Abstract Introduction
Conclusions References
Tables Figures
◭ ◮
◭ ◮
Back Close
Full Screen / Esc
Printer-friendly Version
Interactive Discussion
Discussion
P
a
per
|
Dis
cussion
P
a
per
|
Discussion
P
a
per
|
Discussio
n
P
a
per
|
removed sufficiently from the sample and most of the less volatile organic compounds pass through the trap without a significant loss. The preconcentration trap is packed with glass beads (mesh 60/80) and is operated at−150◦C. For desorption the trap is heated to 230◦C at a rate of 40◦C min−1. Following the desorption the VOC sample is dried in two additional water traps, which are also operated at a temperature of−20◦C.
5
Finally, the VOC are cryo-focussed again in the CIS at a temperature of−150◦C. The CIS (KAS 4, Gerstel GmbH&Co. KG) is a glass tube packed with glass beads (mesh 80/100). For desorption of the sample the CIS is heated to 250◦C at a rate of
12◦C s−1.
The VOC are separated from each other and also from CO2 using a partial two-10
dimensional gas chromatography technique. VOC separated on a non-polar J&W DB-5 ms column (30 m×0.5 µm film×0.32 mm ID) are transferred to a polar J&W DB-624 column (30 m×1.8 µm film×0.32 mm ID) for additional separation during a single mea-surement. Prior to compound separation, the VOC sample is cryo-focussed once again in the CTS (Gerstel GmbH&Co. KG). During focussing the CTS is kept at−150◦C,
dur-15
ing desorption the CTS is heated to 250◦C at a rate of 12◦C s−1.
The GC temperature programme starts with a 4 min isothermal phase at−20◦C
fol-lowed by a temperature ramp of 4◦C min−1to 200◦C, followed by a ramp of 10◦C min−1 to 250◦C, and is helt isothermal for 10 min. The average flow velocity of the He carrier gas is set to 40 cm s−1.
20
After separation, the VOC eluting from the GC flow through a commercially available combustion interface (Model GC5-MK1, GV Instruments Ltd., Manchester, UK), where they are oxidised quantitatively to CO2and H2O. The combustion interface consists of a quartz tube partially situated in a heated zone of 350◦C and, further downstreams, within a furnace kept at 850◦C. The part of the quartz tube within the combustion
25
ACPD
13, 11357–11394, 2013δ13C of toluene in the lower troposphere
J. Wintel et al.
Title Page
Abstract Introduction
Conclusions References
Tables Figures
◭ ◮
◭ ◮
Back Close
Full Screen / Esc
Printer-friendly Version
Interactive Discussion
Discussion
P
a
per
|
Dis
cussion
P
a
per
|
Discussion
P
a
per
|
Discussio
n
P
a
per
|
The gas flow then passes through a cold trap where water generated during the combustion process is removed. The cold trap consists of a coiled capillary, kept at
−100◦C, as suggested by Leckrone and Hayes (1998).
The CO2 is transferred to the source of an Isoprime IRMS (GV Instruments Ltd.,
Manchester, UK) through an open split. The three ion beams comprisingm/z 44, 45
5
and 46 are detected by Faraday cup collectors.
At the beginning and the end of each measurement run, pulses of a certified CO2
reference standard gas (Air Liquide Deutschland GmbH, D ¨usseldorf, Germany) are introduced as a calibration gas. Theδ13C value of the standard gas is−25.80±0.2 ‰, determined through comparison with an accurately knownδ13C V-PDB value.
10
Data processing (e.g. peak integration, calibration, correction according to Santrock et al., 1985) is accomplished using theContinuous Flow Data Processingsoftware (GV Instruments Ltd.).
3.4 Calibration/characterisation
A custom-made dynamic gas dilution system (for details see Hembeck, 2008) was
15
used to dilute VOC gas standards at ppm levels with dry or humidified N2to produce
working standards with different VOC volume mixing ratios at typical ambient levels (ranging from ∼100 ppt to some ppb in the case of toluene and benzene) and with different humidities. These working standards were used to calibrate and characterise the GC-C-IRMS system.
20
A stable mixture of VOC in air (hereafter referred to as “standard A”), diluted down to typical atmospheric mixing ratios (0.7 ppb of benzene and 0.2 ppb of toluene), was measured every day during the canister measurements to determine the reproducibility of the measurements (major ion peak areas, isotope ratios) and to identify possible drifts.
25
ACPD
13, 11357–11394, 2013δ13C of toluene in the lower troposphere
J. Wintel et al.
Title Page
Abstract Introduction
Conclusions References
Tables Figures
◭ ◮
◭ ◮
Back Close
Full Screen / Esc
Printer-friendly Version
Interactive Discussion
Discussion
P
a
per
|
Dis
cussion
P
a
per
|
Discussion
P
a
per
|
Discussio
n
P
a
per
|
linearity of the system, to investigate the impact of sample humidity on both major ion (m/z44) peak areas and isotope ratios, and to calibrate the detector’s response (major ion peak areas) on VOC mixing ratios.
3.4.1 Detector response and linearity
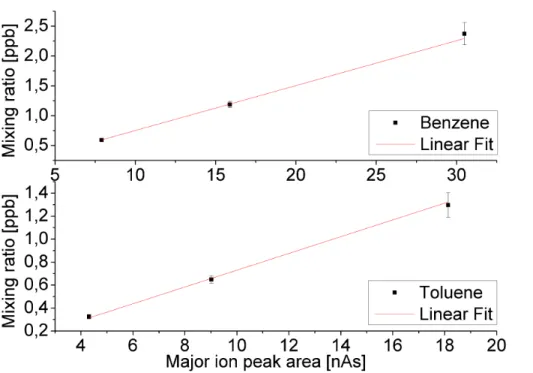
Since the present study focusses on toluene and benzene, only the calibration of these
5
compounds will be presented here. Standard B contains a toluene mixing ratio of 184±5 ppb and a benzene mixing ratio of 335±4 ppb. 16 measurements of the di-luted standard B at three different levels of VOC mixing ratios (0.3–1.3 ppb of toluene and 0.6–2.4 ppb of benzene) and at a constant relative humidity of∼50 % were taken into account for the calibration.
10
We found response curves of the type y(x)=ax (Pearson R >0.999) for both compounds (see Fig. 2). The sample volume was 25 Ln for all standard measure-ments. Since the detector signal at a given mixing ratio is proportional to the sam-ple volume, the derived parameters a (benzene: a=75.2±0.7 ppt nAs−1; toluene:
a=73.0±1.2 ppt nAs−1) can be used to calculate the toluene and benzene mixing
ra-15
tios in samples of any given volume.
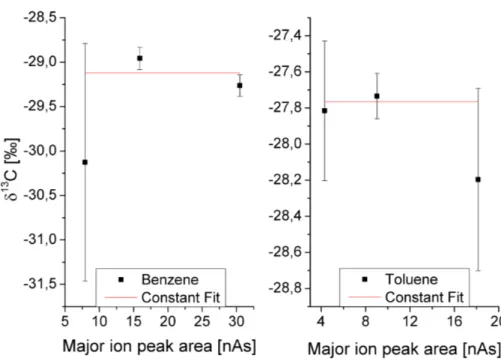
It was also checked whether the δ13C values depend on the peak size. Figure 3 shows the averaged isotope ratios of benzene and toluene versus the averaged ma-jor ion (m/z 44) peak areas for the three dilution steps, the error bars represent the corresponding standard deviations. A constant fity(x)=cwas applied to the data. All
20
δ13C values of toluene agree well with each other within the range of their standard deviations. For benzene this is not the case, but allδ13C values agree with each other in the range of 1.3σ. Since the standard deviations were calculated from maximum six values and therefore have an uncertainty of∼30 % themselves, we assume in the following that for both substances the peak size does not affect the isotope ratios.
ACPD
13, 11357–11394, 2013δ13C of toluene in the lower troposphere
J. Wintel et al.
Title Page
Abstract Introduction
Conclusions References
Tables Figures
◭ ◮
◭ ◮
Back Close
Full Screen / Esc
Printer-friendly Version
Interactive Discussion
Discussion
P
a
per
|
Dis
cussion
P
a
per
|
Discussion
P
a
per
|
Discussio
n
P
a
per
|
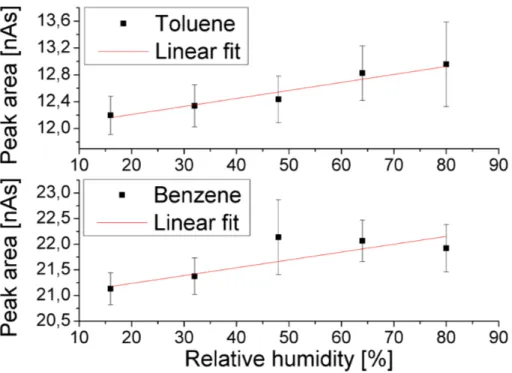
3.4.2 Influence of sample humidity
If water is not removed from the sample prior to the GC-C-IRMS measurements, it is known to cause a number of problems. It may influence the cryo-enrichment of VOC and thereby the peak areas. It may disturb the gas chromatography which results in unstable retention times. Additionally, if water molecules reach the IRMS, they may
5
form1H12C16O2+ions which have the same mass as13C16O+2 ions and therefore corrupt the isotope ratio measurements (see Leckrone and Hayes, 1998).
To determine the effectivity of the water traps in use and to estimate the impact of the residual water in the sample, 23 measurements of humidified dilutions of standard B were carried out. The VOC mixing ratios were kept constant (2.9 ppb of benzene and
10
1.6 ppb of toluene), the relative humidity (RH) level was varied in five steps between 16 % and 80 %. The sample humidity is hard to control with the gas dilution system and changes during sample enrichment, we estimate the error of the sample humidity to be
∼5 % RH.
We found the peak areas to increase with increasing sample humidity (see Fig. 4).
15
For toluene, the peak area changes by less than 7 % over the whole humidity range, for benzene the effect is even smaller. Since the mixing ratio calibration (see Sect. 3.4.1) was carried out with standard B dilutions containing 50 % RH, we estimate 3.5 % to be the upper limit for the humidity-induced error of the measured peak areas. This worst-case estimation is also valid for the ZEPTER-2 samples.
20
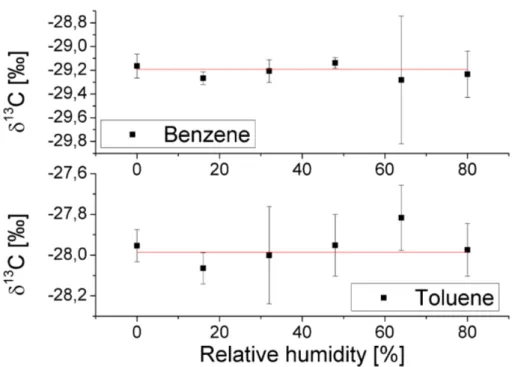
Figure 5 shows averagedδ13C values for the five different sample RH levels men-tioned above and also for dry samples. No systematic drift can be seen in the data, also the values for dry samples agree well with all the other values. We therefore conclude, that the isotope ratio measurements are not corrupted by the sample humidity.
3.4.3 Precision of the results
25
ACPD
13, 11357–11394, 2013δ13C of toluene in the lower troposphere
J. Wintel et al.
Title Page
Abstract Introduction
Conclusions References
Tables Figures
◭ ◮
◭ ◮
Back Close
Full Screen / Esc
Printer-friendly Version
Interactive Discussion
Discussion
P
a
per
|
Dis
cussion
P
a
per
|
Discussion
P
a
per
|
Discussio
n
P
a
per
|
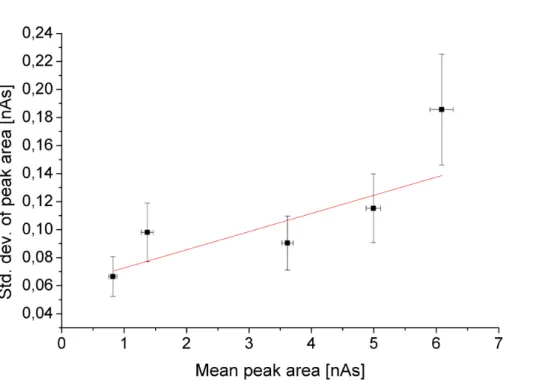
the peak size, we selected five well-separated peaks of different sizes (including the benzene and toluene peaks), calculated the standard deviations of theδ13C valuesσδ
and the peak areasσA and plotted these standard deviations versus the mean peak areasA. We estimated the uncertainties of the standard deviations via
∆σ=√σ
2n (10)
5
wherenis the number of measurements.
Figure 6 showsσAplotted versusA, both given in nAs. We applied a linear fit (Pear-sonR=0.81) to the data and derived the following function
σA=0.06 nAs+1.3 %×A (11)
10
which was later used to estimate the precision of the ZEPTER-2 peak areas.
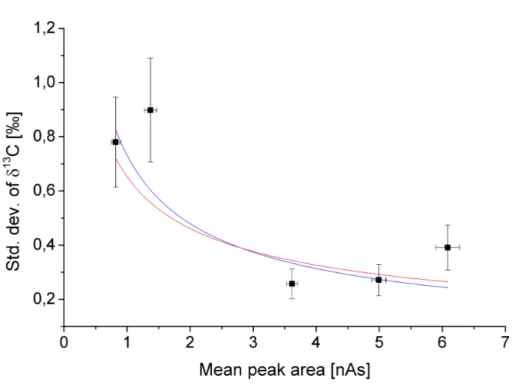
The precisionσδ of the measured isotope ratiosδnaturally depends on the amount
of carbon available for the isotope analysis, i.e. the peak size. Based on counting statis-tics, one would expect a dependency of the following form (see Brand, 2004, and the
15
references therein):
σδ∝
1
√
A (12)
Figure 7 showsσδ (in ‰) plotted versusA(in nAs). Fitting a function of the form
y(x)=axb (13)
20
to the data yields an exponent ofb=−0.6±0.2, which is in agreement with the theory,
i.e. Eq. (12). Therefore we fixed the exponentbto the theoretical value ofb=−0.5 and
derived the following function to estimate the precision of the ZEPTER-2 isotope ratios:
σδ=q0.65 ‰ A/1 nAs
(14)
ACPD
13, 11357–11394, 2013δ13C of toluene in the lower troposphere
J. Wintel et al.
Title Page
Abstract Introduction
Conclusions References
Tables Figures
◭ ◮
◭ ◮
Back Close
Full Screen / Esc
Printer-friendly Version
Interactive Discussion
Discussion
P
a
per
|
Dis
cussion
P
a
per
|
Discussion
P
a
per
|
Discussio
n
P
a
per
|
3.4.4 Accuracy of the isotope ratios
The IRMS is calibrated during every run with ten peaks of a certified CO2 reference
gas (see Sect. 3.3). The error of the mean of the measured isotope ratios for these ten reference gas peaks (expressed as aδ13C value) was always smaller than 0.1 ‰, the uncertainty of the reference gasδ13C value is specified to be 0.2 ‰. Combining these
5
two errors, we estimate the accuracy of the IRMSδ13C measurements to be 0.22 ‰. It is important to mention, that this is only the accuracy of the last step of the analy-sis, the isotope ratio measurement of the CO2gas that reaches the IRMS. During other
steps of the analysis, for example during the sample enrichment, some isotopic frac-tionation may occur. To estimate the accuracy of the measurement process in whole,
10
a VOC standard gas with known VOCδ13C values would be required. Such a standard gas was not available during the measurements reported in this paper, therefore there might be an additional error in the absoluteδ13C values.
4 Results
Unfortunately, we found the benzene peak to overlap with a much smaller peak of a so
15
far unidentified substance in the ZEPTER-2 chromatograms. It turned out, that this peak overlap corrupts the measuredδ13C values of benzene, so we do not use them in the discussion. However, the effect on the benzene mixing ratios is small. A very conservative estimation, based on the maximum peak size of the small peak, yields a maximum error induced on the benzene peak areas of 0.2 nAs).
20
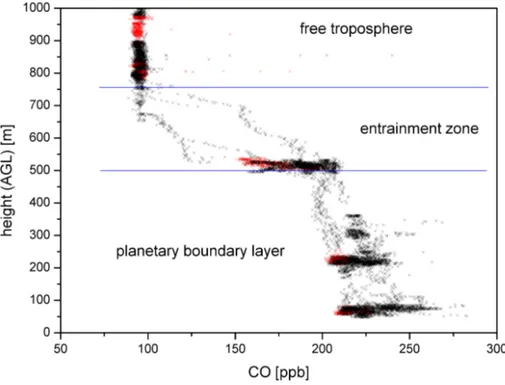
For every flight presented, we determined the height of the planetary boundary layer (PBL) based on in-situ CO measurements with a time resolution of 1 s. As an example, Fig. 8 shows the vertical profile of CO, measured on 25 October 2008. Below 500 m height a.g.l. the CO mixing ratio ranges from 200 to 250 ppb, this height regime is inter-preted as the well mixed PBL. Between 500 and 750 m a very sharp decrease from 200
25
ACPD
13, 11357–11394, 2013δ13C of toluene in the lower troposphere
J. Wintel et al.
Title Page
Abstract Introduction
Conclusions References
Tables Figures
◭ ◮
◭ ◮
Back Close
Full Screen / Esc
Printer-friendly Version
Interactive Discussion
Discussion
P
a
per
|
Dis
cussion
P
a
per
|
Discussion
P
a
per
|
Discussio
n
P
a
per
|
Above 750 m a relatively constant CO mixing ratio of 100 ppb characterises the free troposphere.
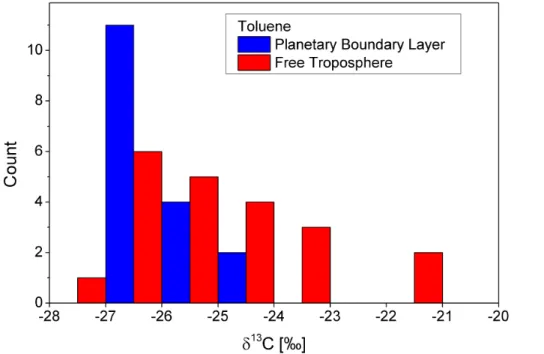
The histogram in Fig. 9 gives an overview of the toluene isotope ratios measured during ZEPTER-2. The total number of samples is 38, 17 taken in the PBL and 21 in the free troposphere. The mean error of theδ13C values is 0.6 ‰. The distributions are
5
strongly asymmetric, indicating that photochemical and/or dynamical processes took place in the air mass history. The most frequentδ13C values of the distributions (be-tween−27 ‰ and−26 ‰) are in the vicinity of source values reported in the literature, e.g.:−26.5 ‰ (v. Czapiewski et al., 2002), between −28.4 ‰ and−27.1 ‰ (Rudolph et al., 2002), −26.1 ‰ and −27.2 ‰ (Thompson, 2003). As expected, we find higher
10
δ13C values in the free troposphere than in the PBL, since more positiveδ13C values correspond to “older” air masses.
The observed volume mixing ratios range from 17 to 690 ppt in the case of toluene and from 96 to 730 ppt in the case of benzene.
5 Discussion
15
5.1 δ13C source value
In the data gathered on 25 October 2008, both volume mixing ratios (VMR) andδ13C values of toluene show a pronounced vertical profile in the planetary boundary layer (see Fig. 10). This may be due to fresh emissions from the ground, mixing into the boundary layer background air. If we assume this hypothesis to be true and neglect
20
the influence of chemical processing, we can use the concept of two-endpoint-mixing to estimate theδ13C source value of toluene (see Sect. 2). Figure 11 shows theδ13C values versus the inverse volume mixing ratios. A linear fit yields a tolueneδ13C source value of δ0=−28.2±0.5 ‰. This value is in the range of previously reported source
values, although it is close to the lower limit (see Sect. 4).
ACPD
13, 11357–11394, 2013δ13C of toluene in the lower troposphere
J. Wintel et al.
Title Page
Abstract Introduction
Conclusions References
Tables Figures
◭ ◮
◭ ◮
Back Close
Full Screen / Esc
Printer-friendly Version
Interactive Discussion
Discussion
P
a
per
|
Dis
cussion
P
a
per
|
Discussion
P
a
per
|
Discussio
n
P
a
per
|
5.2 Effective KIE: dilution and photochemical degradation in the free troposphere
For the interpretation of data collected in the free troposphere we assume the follow-ing, simplified situation: (i) the PBL is well-mixed and therefore quite homogeneous and constant with respect to toluene mixing ratios and isotope ratios; (ii) the toluene
5
background concentration in the free troposphere is zero. In other words, all air parcels in the free troposphere, containing toluene in significant amounts, stem from the same source (the PBL) and undergo only dilution and photochemical processing (reactions with the OH radical). Assuming this, we can use Eq. (5) to calculate the effective KIE
εeff, which contains information about the time constants of dilution and photochemical
10
degradation.
To do so, we plot the tolueneδ13C values measured in the free troposphere versus the logarithm of the corresponding toluene VMR (see Fig. 12). Since we do not know the value ofc(0), characterising the “source”, and since this value does not influence the calculation ofεeff, we just setc(0)=1 ppb to get rid of the units. Four data points
15
are excluded from the analysis, because the amounts of toluene in the samples are lower than the lowest values in the calibration and therefore our error estimates are not reliable. We excluded one more data point from the analysis which we regard as an outlier (itsδvalue is about 3 ‰ higher than those of the neighbouring data points from the same flight, although the mixing ratios are almost the same).
20
We apply two linear fits, one to the whole data set and one only to the data points from 2 November 2008, the day on which most of the free tropospheric samples were taken. Both fits yield a high correlation coefficient (Pearson R=−0.90 and −0.94,
respectively), indicating that the data follow the theory nicely and the assumptions above are justified. For the whole data set we findεeff=5.10±0.76 ‰ and for the data
25
from 2 November 2008εeff=4.1±1.1 ‰. These values match within theirσ-intervals,
ACPD
13, 11357–11394, 2013δ13C of toluene in the lower troposphere
J. Wintel et al.
Title Page
Abstract Introduction
Conclusions References
Tables Figures
◭ ◮
◭ ◮
Back Close
Full Screen / Esc
Printer-friendly Version
Interactive Discussion
Discussion
P
a
per
|
Dis
cussion
P
a
per
|
Discussion
P
a
per
|
Discussio
n
P
a
per
|
change much over the time period from 26 October 2008 to 7 November 2008 and that the results we gain by using the whole data set are quite representative for this period. If we consider the error bars, εeff=5.10±0.76 ‰ equals εOH=5.95±0.28 ‰ (see
Sect. 2). In other words, our results show no significant influence of dilution in the lower free troposphere during the time period we span with our measurements. Decreases of
5
the toluene concentration may be caused only by reactions with OH. Since the free tro-posphere is much less turbulent than the boundary layer and photochemistry generally plays a dominant role there, our findings seem to be plausible.
5.3 Photochemical age
As described in Sect. 2 there are two ways to estimate the photochemical age [OH]avgt 10
of the studied compounds in an air mass: on the one hand, based on the VMR ratio of two compounds with different lifetimes and a known emission ratio; on the other hand, based on the isotope ratio δ of a single compound with a known source iso-tope ratioδ0. To distinguish between the two methods we want to refer to the results based on volume mixing ratios as ([OH]avgt)VMR and to the results based on isotope 15
ratios as ([OH]avgt)δ. In the further discussion we assume that toluene and benzene
share the same sources (e.g. traffic), so we may use these two compounds to calculate ([OH]avgt)VMRand compare the results to ([OH]avgt)δ derived from tolueneδvalues.
The VMR emission ratios c0(toluene)/c0(benzene) reported in the literature range
from about two to about four (e.g. Roberts et al., 1984; Gelencs ´er et al., 1997; Kourtidis
20
et al., 2002; de Gouw et al., 2005; Warneke et al., 2007). During ZEPTER-2 ground-based measurements yielded a ratio of 1.8 in the city of Ravensburg (Urban, 2010). Therefore we estimate the emission ratio to be c0(toluene)/c0(benzene)≈1.8; the
sourceδvalue of toluene is estimated to beδ0=−28.2 ‰ (see Sect. 5.1).
Figure 13 shows the photochemical ages, based on these source values, for all data
25
ACPD
13, 11357–11394, 2013δ13C of toluene in the lower troposphere
J. Wintel et al.
Title Page
Abstract Introduction
Conclusions References
Tables Figures
◭ ◮
◭ ◮
Back Close
Full Screen / Esc
Printer-friendly Version
Interactive Discussion
Discussion
P
a
per
|
Dis
cussion
P
a
per
|
Discussion
P
a
per
|
Discussio
n
P
a
per
|
just rough estimates and therefore may produce an offset between ([OH]avgt)VMRand ([OH]avgt)δ.
Two separate linear fits are applied, to the PBL data and to the free troposphere data, which give slopes of 2.55±0.58 and 0.91±0.29, respectively. A slope unequal to one cannot be explained by inappropriate source values, since these do not influence
5
the slope. As already mentioned (see Sect. 2), we would expect the two methods to give different results, if air masses of different ages have mixed. Obviously, in this case, heavy mixing in the PBL distorted ([OH]avgt)VMR.
The slope of the free troposphere data does not deviate significantly from one. This result supports the assumption we made in Sect. 5.2, i.e. that the PBL acts as a more
10
or less uniform VOC emission source for the free troposphere above, and it agrees well with the finding, that mixing plays a minor role in the free troposphere.
The strong scatter of the data is not surprising, either. Air mass exchanges between the PBL and the free troposphere mainly occur in the form of single, localised events, e.g. due to rising thermals. The PBL can therefore only on average be regarded as
15
a homogenious VOC emission source (reflected by the “correct” slope of the fit line).
6 Summary and outlook
During ZEPTER-2 whole air samples were collected in the PBL and the lower free troposphere using the whole air sampler ZEBIS on board the Zeppelin NT and were afterwards analysed in the laboratory. The GC-C-IRMS in use was carefully calibrated
20
and characterised in order to identify possible problems and to estimate the measure-ment errors.
During one flight (25 October 2008) we sampled rather fresh emissions of toluene in the PBL. Using the concept of two-endpoint-mixing, we derived a toluene source isotope ratio ofδ0=−28.2±0.5 ‰.
25
ACPD
13, 11357–11394, 2013δ13C of toluene in the lower troposphere
J. Wintel et al.
Title Page
Abstract Introduction
Conclusions References
Tables Figures
◭ ◮
◭ ◮
Back Close
Full Screen / Esc
Printer-friendly Version
Interactive Discussion
Discussion
P
a
per
|
Dis
cussion
P
a
per
|
Discussion
P
a
per
|
Discussio
n
P
a
per
|
more by chemical degradation than by dilution processes. In the free troposphere we found no evidence for dilution.
Furthermore, we calculated the photochemical age of air masses in two different ways (based on toluene and benzene mixing ratios and toluene isotope ratios, respec-tively) and compared the results. As expected, the two methods yielded quite different
5
results in the PBL, probably due to strong mixing, but similar results in the free tropo-sphere.
Our results show, that it is possible to measure VOC mixing ratios and isotope ratios in the PBL and the free troposphere with sufficient precision to gain meaningful infor-mation about the state of the atmosphere. Therefore, our study is an important proof of
10
concept for further activities. As an outlook, we want to mention that ZEBIS was modi-fied and took part in another campaign (VERDRILLT) in spain aboard a CASA 212 AR aircraft (Linke, 2012). A new whole air sampler (MIRAH) for deployment on the Ger-man research aircraft HALO has been developed and successfully tested during the aircraft campaigns TECHNO and TACTS. The laboratory system has been improved
15
(e.g. better chromatographic separation, additional mass spectrometer for compound identification).
Acknowledgements. We gratefully thank M. Gallus and the Atmospheric Chemistry Group at
the University of Wuppertal for measuring VOC mixing ratios in standard B and F. Rohrer, Institute for Energy and Climate Research (IEK-8, Troposphere), Research Centre J ¨ulich, for
20
providing the CO data. Special thanks go to F. B ¨uhler, H.-P. Heuser, P. Knieling, C. Linke, and H. Spahn for their support during ZEPTER-2 and to C. Linke and D. Offermann for many helpful discussions during the preparation of this paper. The ZEPTER-2 project was financially supported by the German Federal Ministry of Education and Research under grant number 01LP0803A.
ACPD
13, 11357–11394, 2013δ13C of toluene in the lower troposphere
J. Wintel et al.
Title Page
Abstract Introduction
Conclusions References
Tables Figures
◭ ◮
◭ ◮
Back Close
Full Screen / Esc
Printer-friendly Version
Interactive Discussion
Discussion
P
a
per
|
Dis
cussion
P
a
per
|
Discussion
P
a
per
|
Discussio
n
P
a
per
|
References
Anderson, R., Czuba, E., Ernst, D., Huang, L., Thompson, A., and Rudolph, J.: Method for mea-suring carbon kinetic isotope effects of gas-phase reactions of light hydrocarbons with the hydroxyl radical, J. Phys. Chem. A, 107, 6191–6199, doi:10.1021/jp034256d, 2003. 11359 Anderson, R., Iannone, R., Thompson, A., Rudolph, J., and Huang, L.: Carbon kinetic isotope
5
effects in the gas-phase reactions of aromatic hydrocarbons with the OH radical at 296±4 K, Geophys. Res. Lett., 31, L15108, doi:10.1029/2004GL020089, 2004a. 11359
Anderson, R., Huang, L., Iannone, R., Thompson, A., and Rudolph, J.: Carbon kinetic isotope effects in the gas phase reactions of light alkanes and ethene with the OH radical at 296± 4 K, J. Phys. Chem. A, 108, 11537–11544, doi:10.1021/jp0472008, 2004b. 11359
10
Atkinson, R. and Lloyd, A.: Evaluation of kinetic and mechanistic data for modelling of photo-chemical smog, J. Phys. Chem. Ref. Data, 13, 315–444, doi:10.1063/1.555710, 1984. 11364 Brand, W. A.: Mass spectrometer hardware for analyzing stable isotope ratios, in: Handbook of Stable Isotope Analytical Techniques, Vol. 1, edited by: de Groot, P. A., Elsevier B.V., Amsterdam, The Netherlands, 835–856, 2004. 11369
15
Craig, H.: Isotopic standards for carbon and oxygen and correction factors for mass-spectrometric analysis of carbon dioxide, Geochim. Cosmochim. Ac., 12, 133–149, 1957. 11359
de Gouw, J. A., Middlebrook, A. M., Warneke, C., Goldan, P. D., Kuster, W. C., Roberts, J. M., Fehsenfeld, F. C., Worsnop, D. R., Canagaratna, M. R., Pszenny, A. A. P., Keene, W. C.,
20
Marchewka, M., Bertman, S. B., and Bates, T. S.: Budget of organic carbon in a polluted atmosphere: results from the New England Air Quality Study in 2002, J. Geophys. Res., 110, D16305, doi:10.1029/2004JD005623, 2005. 11373
Farkas, E., Szil ´agyi, I., D ´ob ´e, S., B ´erces, T., and M ´arta, F.: Kinetic isotope effect in the reaction of OH radical with acetone-D6, React. Kinet. Catal. L., 80, 351–358,
25
doi:10.1023/B:REAC.0000006145.52881.dc, 2003. 11359
Gelencs ´er, A., Siszler, K., and Hlavay, J.: Toluene-Benzene concentration ratio as a tool for characterizing the distance from vehicular emission sources, Environ. Sci. Technol., 31, 2869–2872, doi:10.1021/es970004c, 1997. 11373
Goldstein, A. and Shaw, S.: Isotopes of volatile organic compounds: an emerging
ap-30
ACPD
13, 11357–11394, 2013δ13C of toluene in the lower troposphere
J. Wintel et al.
Title Page
Abstract Introduction
Conclusions References
Tables Figures
◭ ◮
◭ ◮
Back Close
Full Screen / Esc
Printer-friendly Version
Interactive Discussion
Discussion
P
a
per
|
Dis
cussion
P
a
per
|
Discussion
P
a
per
|
Discussio
n
P
a
per
|
H ¨aseler, R., Brauers, T., Holland, F., and Wahner, A.: Development and application of a new mobile LOPAP instrument for the measurement of HONO altitude profiles in the plane-tary boundary layer, Atmos. Meas. Tech. Discuss., 2, 2027–2054, doi:10.5194/amtd-2-2027-2009, 2009. 11363
Hembeck, L.: Aufbau eines dynamischen Gasmischsystems, B.Sc. thesis, University of
Wup-5
pertal, Wuppertal, Germany, 2008. 11366
Iannone, R., Koppmann, R., and Rudolph, J.: A technique for atmospheric measurements of stable carbon isotope ratios of isoprene, methacrolein and methyl vinyl ketone, J. Atmos. Chem., 58, 181–202, doi:10.1007/s10874-007-9087-5, 2007. 11364
Iannone, R., Koppmann, R., and Rudolph, J.: The stable-carbon kinetic isotope effects of the
10
reactions of isoprene, methacrolein and methyl vinyl ketone with ozone in the gas phase, Atmos. Environ., 42, 8728–8737, doi:10.1016/j.atmosenv.2008.08.035, 2008. 11359 Iannone, R., Koppmann, R., and Rudolph, J.:12C/13C kinetic isotope effects of the gas-phase
reactions of isoprene, methacrolein and methyl vinyl ketone with OH radicals, Atmos. Envi-ron., 43, 3103–3110, doi:10.1016/j.atmosenv.2009.03.006, 2009. 11359
15
Kourtidis, K. A., Ziomas, I., Zerefos, C., Kosmidis, E., Symeonidis, P., Christophilopoulos, E., Karathanassis, S., and Mploutsos, A.: Benzene, toluene, ozone, NO2 and SO2 measure-ments in an urban street canyon in Thessaloniki, Greece, Atmos. Environ., 34, 5355–5364, doi:10.1016/S1352-2310(02)00580-0, 2002. 11373
Leckrone, K. J. and Hayes, J. M.: Water-induced errors in continuous-flow carbon isotope ratio
20
mass spectrometry, Anal. Chem., 70, 2737–2744, doi:10.1021/ac9803434, 1998. 11366, 11368
Linke, C.: Entwicklung und Anwendung von Analysemethoden und Auswertealgorithmen zur Untersuchung von Verh ¨altnissen stabiler Kohlenstoffisotope in atmosph ¨arischen le-ichtfl ¨uchtigen organischen Verbindungen, Ph.D. thesis, University of Wuppertal, Wuppertal,
25
Germany, 2012. 11375
McKeen, S. A., Trainer, M., Hsie, E. Y., Tallamraju, R. K., and Liu, S. C.: On the indirect de-termination of atmospheric OH radical concentrations from reactive hydrocarbon measure-ments, J. Geophys. Res., 95, 7493–7500, doi:10.1029/JD095iD06p07493, 1990. 11361 McKeen, S. A., Liu, S. C., Hsie, E.-Y., Lin, X., Bradshaw, J. D., Smyth, S., Gregory, G. L., and
30
ACPD
13, 11357–11394, 2013δ13C of toluene in the lower troposphere
J. Wintel et al.
Title Page
Abstract Introduction
Conclusions References
Tables Figures
◭ ◮
◭ ◮
Back Close
Full Screen / Esc
Printer-friendly Version
Interactive Discussion
Discussion
P
a
per
|
Dis
cussion
P
a
per
|
Discussion
P
a
per
|
Discussio
n
P
a
per
|
Nara, H., Toyoda, S., and Yoshida, N.: Measurements of stable carbon isotopic composi-tion of ethane and propane over the western North Pacific and eastern Indian Ocean: A useful indicator of atmospheric transport processes, J. Atmos. Chem., 56, 293–314, doi:10.1007/s10874-006-9057-3, 2007. 11359
Parrish, D. D., Hahn, C. J., Williams, E. J., Norton, R. B., Fehsenfeld, F. C., Singh, H. B.,
Shet-5
ter, J. D., Gandrud, B. W., and Ridley, B. A.: Indications of photochemical histories of Pacific air masses from measurements of atmospheric trace species at Point Arena, California, J. Geophys. Res., 97, 15883–15901, doi:10.1029/92JD01242, 1992. 11361
Redeker, K. R., Davis, S., and Kalin, R. M.: Isotope values of atmospheric halocarbons and hydrocarbons from Irish urban, rural and marine locations, J. Geophys. Res., 112, D16307,
10
doi:10.1029/2006JD007784, 2007. 11359
Reimann, S. and Lewis, A. C.: Anthropogenic VOCs, in: Volatile Organic Compounds in the At-mosphere, edited by: Koppmann, R., Blackwell Publishing, Oxford, UK, 33–81, 2007. 11358 Roberts, J. M., Fehsenfeld, F. C., Liu, S. C., Bollinger, M. J., Hahn, C., Albritton, D. L., and Sievers, R. E.: Measurements of aromatic hydrocarbon ratios and NOxconcentrations in the
15
rural troposphere: observation of air mass photochemical aging and NOx removal, Atmos. Environ., 18, 2421–2432, doi:10.1016/0004-6981(84)90012-X, 1984. 11361, 11373
Rudolph, J.: Gas Chromatography-Isotope Ratio Mass Spectrometry, in: Volatile Organic Com-pounds in the Atmosphere, edited by: Koppmann, R., Blackwell Publishing, Oxford, UK, 388– 466, 2007. 11360, 11361
20
Rudolph, J. and Czuba, E.: On the use of isotopic composition measurements of volatile organic compounds to determine the “photochemical age” of an air mass, Geophys. Res. Lett., 27, 3865–3868, doi:10.1029/2000GL011385, 2000. 11359, 11361
Rudolph, J. and Johnen, F. J.: Measurements of light atmospheric hydrocarbons over the Atlantic in regions of low biological activity, J. Geophys. Res., 95, 20583–20591,
25
doi:10.1029/JD095iD12p20583, 1990. 11361
Rudolph, J., Lowe, D. C., Martin, R. J., and Clarkson, T. S.: A novel method for compound specific determination of δ13C in volatile organic compounds at ppt levels in ambient air, Geophys. Res. Lett., 24, 659–662, doi:10.1029/97GL00537, 1997. 11358
Rudolph, J., Czuba, E., and Huang, L.: The stable carbon isotope fractionation for reactions
30
ACPD
13, 11357–11394, 2013δ13C of toluene in the lower troposphere
J. Wintel et al.
Title Page
Abstract Introduction
Conclusions References
Tables Figures
◭ ◮
◭ ◮
Back Close
Full Screen / Esc
Printer-friendly Version
Interactive Discussion
Discussion
P
a
per
|
Dis
cussion
P
a
per
|
Discussion
P
a
per
|
Discussio
n
P
a
per
|
Rudolph, J., Czuba, E., Norman, A. L., Huang, L., and Ernst, D.: Stable carbon isotope com-position of nonmethane hydrocarbons in emissions from transportation related sources and atmospheric observations in an urban atmosphere, Atmos. Environ., 36, 1173–1181, doi:10.1016/S1352-2310(01)00537-4, 2002. 11359, 11371
Rudolph, J., Anderson, R. S., v. Czapiewski, K., Czuba, E., Ernst, D., Gillespie, T., Huang, L.,
5
Rigby, C., and Thompson, A. E.: The stable carbon isotope ratio of biogenic emis-sions of isoprene and the potential use of stable isotope ratio measurements to study photochemical processing of isoprene in the atmosphere, J. Atmos. Chem., 44, 39–55, doi:10.1023/A:1022116304550, 2003. 11359
Saito, T., Tsunogai, U., Kawamura, K., Nakatsuka, T., and Yoshida, N.: Stable carbon
10
isotopic compositions of light hydrocarbons over the western North Pacific and im-plication for their photochemical ages, J. Geophys. Res., 107, ACH 2-1–ACH 2-9, doi:10.1029/2000JD000127, 2002. 11359
Saito, T., Kawamura, K., Tsunogai, U., Chen, T.-Y., Matsueda, H., Nakatsuka, T., Gamo, T., Ue-matsu, M., and Huebert, B. J.: Photochemical histories of nonmethane hydrocarbons inferred
15
from their stable carbon isotope ratio measurements over east Asia, J. Geophys. Res., 114, D11303, doi:10.1029/2008JD011388, 2009. 11359, 11361
Santrock, J., Studley, S. A., and Hayes, J. M.: Isotopic analyses based on the mass spectrum of carbon dioxide, Anal. Chem., 57, 1444–1448, doi:10.1021/ac00284a060, 1985. 11366 Spahn, H.: Untersuchungen der Verh ¨altnisse stabiler Kohlenstoffisotope in atmosph ¨arisch
rel-20
evanten VOC in Simulations- und Feldexperimenten, Ph.D. thesis, University of Wuppertal, Wuppertal, Germany, 2009. 11359
Thompson, A. E.: Stable carbon isotope ratios of nonmethane hydrocarbons and halocarbons in the atmosphere, Ph.D. thesis, York University, Toronto, Canada, 2003. 11371
Tsunogai, U., Yoshida, N., and Gamo, T.: Carbon isotopic compositions of C2-C5hydrocrabons
25
and methyl chloride in urban, coastal, and maritime atmospheres over the western North Pacific, J. Geophys. Res., 104, 16033–16039, doi:10.1029/1999JD900217, 1999. 11359 Urban, S.: Charakterisierung der Quellverteilung von Feinstaub und Stickoxiden in l ¨andlichem
und st ¨adtischem Gebiet, Ph.D. thesis, University of Wuppertal, Wuppertal, Germany, 2010. 11363, 11373
30
ACPD
13, 11357–11394, 2013δ13C of toluene in the lower troposphere
J. Wintel et al.
Title Page
Abstract Introduction
Conclusions References
Tables Figures
◭ ◮
◭ ◮
Back Close
Full Screen / Esc
Printer-friendly Version
Interactive Discussion
Discussion
P
a
per
|
Dis
cussion
P
a
per
|
Discussion
P
a
per
|
Discussio
n
P
a
per
|
Warneke, C., McKeen, S. A., de Gouw, J. A., Goldan, P. D., Kuster, W. C., Holloway, J. S., Williams, E. J., Lerner, B. M., Parrish, D. D., Trainer, M., Fehsenfeld, F. C., Kato, S., Atlas, E. L., Baker, A., and Blake, D. R.: Determination of urban volatile organic com-pound emission ratios and comparison with an emissions database, J. Geophys. Res., 112, D10S47, doi:10.1029/2006JD007930, 2007. 11373
5
ACPD
13, 11357–11394, 2013δ13C of toluene in the lower troposphere
J. Wintel et al.
Title Page
Abstract Introduction
Conclusions References
Tables Figures
◭ ◮
◭ ◮
Back Close
Full Screen / Esc
Printer-friendly Version
Interactive Discussion
Discussion
P
a
per
|
Dis
cussion
P
a
per
|
Discussion
P
a
per
|
Discussio
n
P
a
per
|
Table 1.Overview of the analysed flights.
Date MEZ Flight area Flight profile
1 25 Oct 2008 14:25–17:40 Lake Constance 47◦40′N 9◦11′E vertical profile
2 26 Oct 2008 12:45–16:45 Altdorf forest 47◦51′N 9◦41′E vertical profile
4 2 Nov 2008 12:00–15:30 Tettnang forest 47◦38′N 9◦34′E constant altitude
5 2 Nov 2008 16:10–19:00 Tettnang forest 47◦38′N 9◦34′E constant altitude
ACPD
13, 11357–11394, 2013δ13C of toluene in the lower troposphere
J. Wintel et al.
Title Page
Abstract Introduction
Conclusions References
Tables Figures
◭ ◮
◭ ◮
Back Close
Full Screen / Esc
Printer-friendly Version
Interactive Discussion
Discussion
P
a
per
|
Dis
cussion
P
a
per
|
Discussion
P
a
per
|
Discussio
n
P
a
per
|
Fig. 1.Gas flow system of the whole air sampler ZEBIS; one canister is shown as an example,
ACPD
13, 11357–11394, 2013δ13C of toluene in the lower troposphere
J. Wintel et al.
Title Page
Abstract Introduction
Conclusions References
Tables Figures
◭ ◮
◭ ◮
Back Close
Full Screen / Esc
Printer-friendly Version
Interactive Discussion
Discussion
P
a
per
|
Dis
cussion
P
a
per
|
Discussion
P
a
per
|
Discussio
n
P
a
per
|
Fig. 2.VOC mixing ratios versus detector response for three dilution steps of standard B; each
ACPD
13, 11357–11394, 2013δ13C of toluene in the lower troposphere
J. Wintel et al.
Title Page
Abstract Introduction
Conclusions References
Tables Figures
◭ ◮
◭ ◮
Back Close
Full Screen / Esc
Printer-friendly Version
Interactive Discussion
Discussion
P
a
per
|
Dis
cussion
P
a
per
|
Discussion
P
a
per
|
Discussio
n
P
a
per
|
Fig. 3.Isotope ratios of benzene and toluene versus major ion peak areas for three dilution
ACPD
13, 11357–11394, 2013δ13C of toluene in the lower troposphere
J. Wintel et al.
Title Page
Abstract Introduction
Conclusions References
Tables Figures
◭ ◮
◭ ◮
Back Close
Full Screen / Esc
Printer-friendly Version
Interactive Discussion
Discussion
P
a
per
|
Dis
cussion
P
a
per
|
Discussion
P
a
per
|
Discussio
n
P
a
per
|
Fig. 4.Averaged major ion peak areas of benzene and toluene for different sample
ACPD
13, 11357–11394, 2013δ13C of toluene in the lower troposphere
J. Wintel et al.
Title Page
Abstract Introduction
Conclusions References
Tables Figures
◭ ◮
◭ ◮
Back Close
Full Screen / Esc
Printer-friendly Version
Interactive Discussion
Discussion
P
a
per
|
Dis
cussion
P
a
per
|
Discussion
P
a
per
|
Discussio
n
P
a
per
|
Fig. 5. Averaged isotope ratios for different sample humidities; the error bars represent the
ACPD
13, 11357–11394, 2013δ13C of toluene in the lower troposphere
J. Wintel et al.
Title Page
Abstract Introduction
Conclusions References
Tables Figures
◭ ◮
◭ ◮
Back Close
Full Screen / Esc
Printer-friendly Version
Interactive Discussion
Discussion
P
a
per
|
Dis
cussion
P
a
per
|
Discussion
P
a
per
|
Discussio
n
P
a
per
|
Fig. 6. Standard deviations of the peak area versus the mean peak area for five peaks of
ACPD
13, 11357–11394, 2013δ13C of toluene in the lower troposphere
J. Wintel et al.
Title Page
Abstract Introduction
Conclusions References
Tables Figures
◭ ◮
◭ ◮
Back Close
Full Screen / Esc
Printer-friendly Version
Interactive Discussion
Discussion
P
a
per
|
Dis
cussion
P
a
per
|
Discussion
P
a
per
|
Discussio
n
P
a
per
|
Fig. 7.Standard deviations of theδ13C values versus the mean peak areas for five peaks of
ACPD
13, 11357–11394, 2013δ13C of toluene in the lower troposphere
J. Wintel et al.
Title Page
Abstract Introduction
Conclusions References
Tables Figures
◭ ◮
◭ ◮
Back Close
Full Screen / Esc
Printer-friendly Version
Interactive Discussion
Discussion
P
a
per
|
Dis
cussion
P
a
per
|
Discussion
P
a
per
|
Discussio
n
P
a
per
|
Fig. 8.CO mixing ratios, measured on 25 October 2008; the time resolution is 1 s. Data points
ACPD
13, 11357–11394, 2013δ13C of toluene in the lower troposphere
J. Wintel et al.
Title Page
Abstract Introduction
Conclusions References
Tables Figures
◭ ◮
◭ ◮
Back Close
Full Screen / Esc
Printer-friendly Version
Interactive Discussion
Discussion
P
a
per
|
Dis
cussion
P
a
per
|
Discussion
P
a
per
|
Discussio
n
P
a
per
|
Fig. 9.Histogram of all tolueneδ13C values measured during ZEPTER-2; the mean error is
ACPD
13, 11357–11394, 2013δ13C of toluene in the lower troposphere
J. Wintel et al.
Title Page
Abstract Introduction
Conclusions References
Tables Figures
◭ ◮
◭ ◮
Back Close
Full Screen / Esc
Printer-friendly Version
Interactive Discussion
Discussion
P
a
per
|
Dis
cussion
P
a
per
|
Discussion
P
a
per
|
Discussio
n
P
a
per
|
Fig. 10.Vertical profiles (height a.g.l.) of toluene volume mixing ratios andδ13C values in the
ACPD
13, 11357–11394, 2013δ13C of toluene in the lower troposphere
J. Wintel et al.
Title Page
Abstract Introduction
Conclusions References
Tables Figures
◭ ◮
◭ ◮
Back Close
Full Screen / Esc
Printer-friendly Version
Interactive Discussion
Discussion
P
a
per
|
Dis
cussion
P
a
per
|
Discussion
P
a
per
|
Discussio
n
P
a
per
|
Fig. 11.δ13C values of toluene versus the inverse volume mixing ratio; a linear fit (Pearson