BGD
5, 2049–2073, 2008POC in pore water in fens
S. Fiedler et al.
Title Page
Abstract Introduction
Conclusions References
Tables Figures
◭ ◮
◭ ◮
Back Close
Full Screen / Esc
Printer-friendly Version
Interactive Discussion
Biogeosciences Discuss., 5, 2049–2073, 2008 www.biogeosciences-discuss.net/5/2049/2008/ © Author(s) 2008. This work is distributed under the Creative Commons Attribution 3.0 License.
Biogeosciences Discussions
Biogeosciences Discussionsis the access reviewed discussion forum ofBiogeosciences
The relevance of particulate organic
carbon (POC) for carbon composition in
the pore water of drained and rewetted
fens of the “Donauried” (South-Germany)
S. Fiedler1, B. S. H ¨oll2, A. Freibauer3, K. Stahr1, M. Dr ¨osler4, M. Schloter5, and H. F. Jungkunst6
1
Institute of Soil Science and Land Evaluation, Univ. of Hohenheim, Emil-Wolff-Strasse 27, 70599 Stuttgart, Germany
2
Ludwig-Maximilians Univ., Dept. of Geography, Luisenstr. 37, 80333 Munich, Germany
3
Max-Planck-Institute for Biogeochemistry, Postfach 100164, 07701 Jena, Germany
4
Vegetation Ecology, Techn. Univ. of Munich, Am Hochanger 6, 85350 Freising, Germany
5
BGD
5, 2049–2073, 2008POC in pore water in fens
S. Fiedler et al.
Title Page
Abstract Introduction
Conclusions References
Tables Figures
◭ ◮
◭ ◮
Back Close
Full Screen / Esc
Printer-friendly Version
Interactive Discussion
6
Landscape Ecology, Institute of Geography, University of G ¨ottingen, Goldschmidtstr. 5, 37077 G ¨ottingen, Germany
Received: 12 February 2008 – Accepted: 7 April 2008 – Published: 15 May 2008
BGD
5, 2049–2073, 2008POC in pore water in fens
S. Fiedler et al.
Title Page
Abstract Introduction
Conclusions References
Tables Figures
◭ ◮
◭ ◮
Back Close
Full Screen / Esc
Printer-friendly Version
Interactive Discussion
Abstract
Numerous studies have dealt with carbon (C) concentrations in Histosols, but there are no studies quantifying the relative importance of all individual C components in pore waters. For this study, measurements were made of all the carbon components (i.e., particulate organic carbon, POC; dissolved organic carbon, DOC; dissolved
inor-5
ganic carbon, DIC; dissolved methane, CH4) in the soil pore water of a calcareous fen
under three different water management regimes (re-wetted, deeply and moderately drained). Pore water was collected weekly or biweekly (April 2004 to April 2006) at depths between 10 and 150 cm.
The main results obtained were: (1) DIC (94–280 mg C l−1) was the main
C-10
component. (2) POC and DOC concentrations in the pore water (14–125 mg C l−1
vs. 41–95 mg C l−1) were pari passu. (3) Dissolved CH4 was the smallest C component
(0.005–0.9 mg C l−1). Interestingly, about 30% of the POM particles were colonized by microbes indicating that they are active in the internal C transfer in the soil profile (“C-Shuttles”). Consequently, it was concluded that POC is at least as important as DOC
15
for internal soil C turnover. There is no reason to assume significant biochemical dif-ferences between POC and DOC as they only differ in size. Therefore, both POC and DOC fractions are essential components of C budgets of peatlands. Furthermore dis-solved CO2in all forms of DIC apparently is an important part of peatland C-balances.
1 Introduction
20
The carbon (C) storage in ecosystems and the C balance between the atmosphere and terrestrial ecosystems is vulnerable to changes in environmental conditions (global change). Soils hold the largest C pool of terrestrial ecosystems (IPCC, 2007). To fully understand soil C dynamics and potential feedbacks with the atmosphere, greater insight into the soil internal C dynamics (turnover and pathways) is needed.
25
pre-BGD
5, 2049–2073, 2008POC in pore water in fens
S. Fiedler et al.
Title Page
Abstract Introduction
Conclusions References
Tables Figures
◭ ◮
◭ ◮
Back Close
Full Screen / Esc
Printer-friendly Version
Interactive Discussion
dominately water. Total carbon (TC) in pore water is composed of dissolved organic carbon (DOC), dissolved inorganic carbon (DIC=CO2in all dissociation species),
dis-solved methane (CH4), and particulate organic carbon (POC). Organic matter (OM) in
pore water is differentiated by size: Particulate organic matter (POM), and in parallel POC, is defined as organic matter in water samples larger than 0.45µm and dissolved
5
organic matter (DOM), linked to DOC, is defined as organic matter in water samples smaller than 0.45µm (Zsolnay, 2003).
Most studies on carbon concentrations in Histosols concentrated on DOM and DIC (Billett et al., 2004; Worrall et al., 2005; Fiedler et al., 2006) and POM seems to be the forgotten component. Therefore, the importance of POM is potentially
underesti-10
mated but there is no study that allowed an estimation of the relative importance of the individual C components in the soil pore water of Histosols. Wet ecosystems can lose a significant fraction of the net carbon uptake via leaching (Neal and Hill, 1994; Waddington and Roulet, 1997; Pastor et al., 2003; Worrall et al., 2003) but it is un-known how much C may be lost via leaching of POC. However, studies about POC
15
in aquatic systems highlight peatlands as a major POC source to the flanking aquatic systems (Bouchard, 2007; Dawson et al., 2004; Laudon et al., 2004). It can be as-sumed that POC is an important component of the pore waters of Histosols, since it must originate from there, i.e. moving from the peat to the pore water and then to the stream water. Consequently, the objective of this study was to evaluate the temporal
20
and spatial patterns of the individual C components (POC, DOC, DIC and dissolved CH4) in the pore water profiles of a fen throughout the year along a gradient of water
BGD
5, 2049–2073, 2008POC in pore water in fens
S. Fiedler et al.
Title Page
Abstract Introduction
Conclusions References
Tables Figures
◭ ◮
◭ ◮
Back Close
Full Screen / Esc
Printer-friendly Version
Interactive Discussion
2 Material and Methods
2.1 Environmental settings
The study site is located in the Donauried fen area near Ulm, Germany (Table 1). The Donauried area extends over 472 km2and includes the largest coherent peatland area (30 km2) in southern Germany. The peatland is fed by productive karst springs (1100–
5
8800 l s−1) originating from the flanking Swabian Alb (Geyer and Gwinner, 1986). The mean annual air temperature of the study area is 7.7◦C, and the mean annual precipi-tation is 744 mm.
The historical peat layer, which was approximately 7 m thick, has gradually dimin-ished due to anthropogenic interventions over the last 200 years, i.e. lowering of the
10
groundwater level and direct peat removal. Between 1951 and 1990, the average loss of peat was 7.2 mm a−1, (Flinsbach et al., 1997) which is equivalent to 5.67 t C ha−1a−1. In 1966, certain areas within the peatland were protected. Since 1984, an area of approximately 0.5 km2 has been flooded by regulating water inflow and outflow (11– 24 l s−1). For this study, three anthropogenically affected peatlands (previously used as
15
peat cuts) were investigated (Table 1):
1. a deeply drained fen site (48◦29′7.48′′N, 10◦11′29.03′′E) with a mean groundwa-ter level (GWL) of−99±37 cm,
2. a moderately drained fen site (48◦28′59.63′′N, 10◦12′19.50′′E) with a mean GWL of−22±16 cm, and
20
3. a long-term re-wetted fen site (48◦28′59.15′′N, 10◦11′51.92′′E), rewetted for ∼20 years, with a mean GWL of−5±12 cm (H ¨oll, 2007).
BGD
5, 2049–2073, 2008POC in pore water in fens
S. Fiedler et al.
Title Page
Abstract Introduction
Conclusions References
Tables Figures
◭ ◮
◭ ◮
Back Close
Full Screen / Esc
Printer-friendly Version
Interactive Discussion Carex spec. and Equisetum spec. were found on the re-wetted fen, the plant
com-munity of the deeply and moderately drained areas were characterised as meadow species (Lolium perenneL,Poa pratensisandFestuca ovina,Bromus erectus).
2.2 Sampling
Sampling of freely drained pore water was carried out at weekly (DOC, DIC, CH4) and
5
biweekly (POC) intervals between April 2004 and April 2006. Samples were collected at different depths (from 10 to 150 cm, Table 1) at the respective sites using slotted PVC wells (3 replicates per depth). Whenever the given soil depth was below the ground-water level, pore ground-water could be collected. The PVC well (10 cm long, outer diameter of 2.5 cm; Stockmann, Warendorf, Germany) was sealed at both ends and coated with
10
filter gauze (32–60 PP, Eijkelkamp, Giesbeek, Netherlands) in order to prevent coarse particles (>2 mm) from entering. A stainless steel capillary (3×0.5 mm; Hero, Berlin, Germany) was inserted from the top of the centre of the tube. The end of the capillary was closed using a three-way stop-cock (Fleischhacker, Schwerte, Germany).
The pore-water samplers were inserted to pre-defined depths using a stab drill.
15
The hollow space above the well was filled with a mixture of peat and coarse sand. In order to determine DIC and dissolved CH4, the samples were introduced through the three-way stop-cock using evacuated N2- rinsed vacutainer (22.5 ml; Altmann-Analysentechnik, Holzkirchen, Germany). This technique is specific for the sampling of freely drained pore water under water-saturated conditions. The carbonates were
20
converted to CO2 by the injection of 0.5 ml H2SO4 (10%) into the vacutainer being half filled with sample solution. Pore water was subsequently removed with a syringe (Omnifix, 50 ml; VWR, Bruchsal, Germany) in order to determine TOC and DOC. On return to the laboratory all samples were shaken and half of these samples were fil-tered (0.45µm pore size, PET45/25; Macherey-Nagel, D ¨uren, Germany) to determine
25
BGD
5, 2049–2073, 2008POC in pore water in fens
S. Fiedler et al.
Title Page
Abstract Introduction
Conclusions References
Tables Figures
◭ ◮
◭ ◮
Back Close
Full Screen / Esc
Printer-friendly Version
Interactive Discussion
Water samples for straining POC particles were taken twice in autumn at the moder-ately drained fen at 20, 40 and 60 cm depth.
Additionally samples were collected for analysis of size distribution of POM (July, August and November 2006) at the moderately drained fen and re-wetted fen at depths between 10 and 60 cm.
5
The samples for theδ13CDIC were collected in April 2005. The δ 13
C of CO2in the
unsaturated soil pores was collected in evacuated vacutainers (more details see H ¨oll, 2007). The DIC was converted to CO2by acidification with 85% H3PO4and stored
un-der N2. For sampling groundwater and water from the karst aquifer we could kindly use
the deep wells of the local water supply company (Zweckverband
Landeswasserver-10
sorgung). Theδ13CDICwas determined in the same way asδ13C of CO2.
2.3 Analyses
CH4and DIC as CO2were analysed in the headspace of the vacutainers by gas
chro-matography (CH4: FlD, CO2: ECD and FID with methanizer; PE Autosystem XL Gas
Chromatograph, Perkin Elmer, Wellesky, MA, USA). External standards for CH4 and
15
CO2were used to calibrate the system at 1, 101, 1024 ppm CH4; 293, 14890, 2983 ppm
CO2. The volume-related back calculation (mg l− 1
) was made using the Bunsen solu-bility coefficient (Clever and Young, 1986, for more details see Fiedler et al., 2006).
Organic carbon of pore water (with and without filtration) was analysed using a DIMA-TOC 100 (Dimatec, Essen, Germany). All samples were continuously homogenised by
20
a magnetic stirrer during the measurement. Two external standards for TOC were used to calibrate the system.
The size distribution (0.45µm to 2000µm) was measured using a laser diff ractome-ter (Coulractome-ter LS200; Fa. Beckmann, Krefeld, Germany). The sum frequency distribution was made on the assumption that all particles were spherical (Coulter Software, Vers.
25
3.01).
BGD
5, 2049–2073, 2008POC in pore water in fens
S. Fiedler et al.
Title Page
Abstract Introduction
Conclusions References
Tables Figures
◭ ◮
◭ ◮
Back Close
Full Screen / Esc
Printer-friendly Version
Interactive Discussion
al., 1990) were slightly modified, according to Assmus et al. (1995). Filters were trans-ferred to a fixation buffer (4% paraformaldehyde in PBS) and fixed for 2 h at 28◦C. The samples were washed and dehydrated in 50, 80, and 96% ethanol (5 min each). Filters were stained with the DNA-specific dye DAPI (Sigma, Germany). DAPI was stored in a 0.35 mg ml−1
aqueous stock solution at 4◦C. For staining, the stock solution was diluted
5
500-fold in distilled water and 20 ml of the working solution was applied to each filter. After incubation for 10 min at room temperature, the filters were rinsed with distilled water and air dried. Afterwards the filters were transferred to slides and mounted in antifading solution (Johnson et al., 1981). Epifluorescence microscopy was performed with an Axioplan microscope (Zeiss, Germany) supplying an excitation wavelength at
10
365 nm.
For isotope measurements, samples were injected in gas tight flasks (volume 1 ml). Theδ13C-ratios were determined on a continuous flow isotope ratio mass spectrometer (IRMS), (DELTAplus XP, Thermo Finnigan, Bremen, Germany) which was equipped with a GasBench II for automatically analysing dissolved inorganic carbon (DIC) and
15
gases at the Max-Planck Institute for Biogeochemistry (Jena, Germany).
2.4 Statistical Analyses
Non-parametric analyses were used since the data were not normally distributed (Sharpo-Wilks’ W Test) and could not be transformed. The Mann-Whitney (U) Test was used to detect significant (α=1%) differences between individual sites and depths.
20
BGD
5, 2049–2073, 2008POC in pore water in fens
S. Fiedler et al.
Title Page
Abstract Introduction
Conclusions References
Tables Figures
◭ ◮
◭ ◮
Back Close
Full Screen / Esc
Printer-friendly Version
Interactive Discussion
3 Results
3.1 Distribution of C components
3.1.1 Spatial pattern
The site specific position of the groundwater level did not affect the concentrations of total carbon (TC) (around 300 mg C l−1) in pore waters.
5
The mean POC concentrations ranged from 14 to 125 mg l−1 (Table 1). No statis-tically significant trends in sites and depths were found, even though concentrations tended to be lower with increasing soil depth (moderately drained and re-wetted fen). The highest concentrations were systematically found at the depth of the site-specific mean groundwater table (deeply drained−150 cm, 125 mg C l−1; moderately drained,
10
between −20 and −40 cm, 67–74 mg C l−1; re-wetted fen −10 cm, 72 mg C l−1). The POC fraction of TC varied between 15 and 30% (Fig. 1). In the re-wetted and moder-ately drained peatland, the POC proportion was similar to DOC. In the deeply drained fen POC tended to be lower than DOC.
Generally, POC concentrations tended to be lower with increasing distance to the
15
overlying water table.
DOC concentrations decreased with increasing wetness of the site, i.e., DOC con-centrations were lowest in the re-wetted fen (around 50 mg C l−1
). The mean DOC concentrations in drained areas ranged between 72 and 95 mg C l−1 and were irregu-larly distributed in depth.
20
At all sites, the most important C component of pore water (up to 280 mg C l−1
) was dissolved inorganic carbon. The DIC proportion increased with increasing wetness of the site i.e., deeply drained (50–60%)<moderately drained (up to 70%)<re-wetted fen (75% of TC) and increasing depth (Fig. 1). DIC concentrations significantly increased with soil depth (Table 1), where in some cases DIC concentrations were two-fold higher
25
than in the upper horizon (189 vs. 94 mg C l−1in moderately drained fen).
BGD
5, 2049–2073, 2008POC in pore water in fens
S. Fiedler et al.
Title Page
Abstract Introduction
Conclusions References
Tables Figures
◭ ◮
◭ ◮
Back Close
Full Screen / Esc
Printer-friendly Version
Interactive Discussion
in pore waters). The mean CH4 concentrations ranged from 0.005 to 0.006 mg C l− 1
(deeply drained fen), 0.005 to 0.196 mg C l−1 (moderately drained fen), and 0.363 to 0.175 mg C l−1(re-wetted fen), respectively.
3.1.2 Temporal pattern
Neither the total C concentrations nor the POC, DOC, and DIC concentrations revealed
5
a statistically significant dependence on soil temperature, precipitation or groundwater level. Dependence was particularly expected at the upper soil layers. However, ground-water tables tended to be low when air temperatures were high. Consequently, the number of samples and the temporal coverage of the topsoil levels for higher tempera-tures were significantly lower than for lower temperatempera-tures. Additionally, the temperature
10
amplitude in greater depths with constant water saturation was dampened.
Beside irregular seasonal dynamics distinct but non-significant trends between the two years of study were found. In both years, the rainfall was lower than the long-term mean of 744 mm (580 mm from April 2004 to March 2005, and 685 mm from April 2005 to March 2006). The lower precipitation in the first study period led to considerably
15
lower groundwater levels compared to the second year (GWL: re-wetted fen−9, pe-riod 2004/2005 vs. 0 cm, pepe-riod 2005/2006); moderately drained fen−29 vs. −19 cm, deeply drained fen−125 vs. −75 cm). The deeper the drainage, the larger were the differences in mean groundwater tables between the two years.
Relatively high TC concentrations were measured in both years (300 mg C l−1). In the
20
re-wetted fen mean POC concentrations were mostly around 50 mg C l−1, with the ex-ception in 10 cm depth where mean concentrations ranged between 75 mg C l−1(wetter period) and 105 mg C l−1(drier period). Lower mean POC concentrations in the wetter period than in the drier period were also found in all depths of the moderately drained fen (37 to 73 mg C l−1, period 2005/2006 vs. 56 to 114 mg C l−1, period 2004/2005).
25
BGD
5, 2049–2073, 2008POC in pore water in fens
S. Fiedler et al.
Title Page
Abstract Introduction
Conclusions References
Tables Figures
◭ ◮
◭ ◮
Back Close
Full Screen / Esc
Printer-friendly Version
Interactive Discussion
The inter-annual variation for DOC concentrations was similar to POC. In the wetter period, higher DOC concentrations were found in the deeply drained fen (except in 150 cm depth), while lower concentration were observed in the moderately drained (66 to 87 mg C l−1, period 2005/2006 vs. 81 to 92 mg C l−1, period 2004/2005) and rewetted fen (37 to 49 mg C l−1vs. 52 to 64 mg C l−1).
5
In the wetter year, the proportion of DIC of TC in the pore water was higher (51–79%) at all sites and depths than in the drier year (26 to 73%). In the moderately drained fen this trend was more pronounced than in the rewetted and deeply drained fen.
The δ13C values of DIC ranged between −16.7±0.6 and −18.4±0.6, and were lower than those in the aquatic system (karst spring−14.3±0.1, surface water −11.7
10
to −13.0±0.8), but higher than those of the CO2 of the gaseous phase in pores
(−23.9±1.3 to−26.6±0.4) (Table 2).
3.2 Characterization of POM
3.2.1 Particle size distribution of the POM fraction
The particle size distribution of POM at the re-wetted fen was rather uniform regardless
15
of sampling depth or time (Fig. 2a). In the re-wetted fen, 75–95% of all particles were smaller than 1µm. The moderately drained fen (Fig. 2b) had larger particles (60– 100%>1µm) than the re-wetted fen. In particular the rewetting of the area after a longer dry period (see Fig. 2b, 20 cm, August) led to very large particles of >20µm (100%) in the pore waters.
20
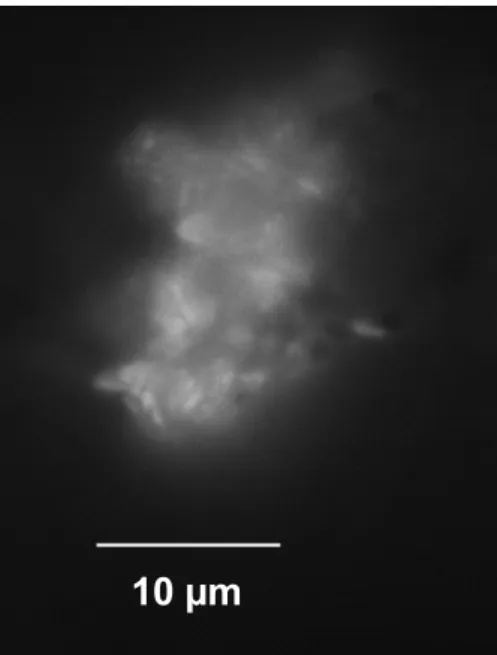
3.2.2 Colonization by microbes
Microbes could be detected on about 30% of the POM particles>1µm. A rough calcu-lation based on the microscopic images revealed different colonization patterns in rela-tion to the depth of the particles. In tendency more particles from the upper layers were colonized by microbes compared to deeper layers. In contrast the number of microbes
BGD
5, 2049–2073, 2008POC in pore water in fens
S. Fiedler et al.
Title Page
Abstract Introduction
Conclusions References
Tables Figures
◭ ◮
◭ ◮
Back Close
Full Screen / Esc
Printer-friendly Version
Interactive Discussion
per particle was more related to the size of the particles than to the depth. Smaller particles were colonized by 5–10 microbes, whereas on larger particles (>10µm) more microbes could be localized. Most of the microbes localized on the POM particles were rod shaped and single cells, which formed microcolonies, indicative of bacteria or Ar-chaea. Typical filamentous fungi were not observed. An example of a colonized POM
5
particle is given in Fig. 3.
4 Discussion
4.1 POC and DOC are pari passu
The first simple “take-home-message” of this study is that POC occurs in similar con-centrations as DOC in the pore waters. Therefore it is potentially important for internal
10
C turnover. The mean DOC concentrations of the investigated peat sites exhibit con-centrations that are in the same range of published data for drained (81 to 129 mg l−1; Moore and Clarkson, 2007) and re-wetted peatlands (70–100 mg C l−1; Glatzel et al., 2003). Therefore, the Donauried study site does not appear to be an exceptional site and POC values could represent common values. Because of a lack of data from other
15
peat pore waters, we can only compare our data with POC data from open aquatic systems for which DOC/POC ratios from 0.4 to 17 have been reported (Zhang et al., 1992; Dawson et al., 2004; Raymond et al., 2004; Guo and MacDonald, 2006; Bouillon et al., 2007). The mean DOC/POC ratios of the present study ranged between 0.4 and 2.8. This appears rather comparable but since samples from open aquatic systems
20
are taken at some distance from the peat source it can be expected that POC is more depleted in rivers than DOC due to the faster sedimentation of larger heavier particles. Consequently, POC concentrations of aquatic systems reported in the literature were mainly 10 to 1000 times lower (Richey and Victoria, 1993; Hope et al., 1997; Dawson et al., 2002) than the POC concentrations determined in the pore water of our peatland
25
BGD
5, 2049–2073, 2008POC in pore water in fens
S. Fiedler et al.
Title Page
Abstract Introduction
Conclusions References
Tables Figures
◭ ◮
◭ ◮
Back Close
Full Screen / Esc
Printer-friendly Version
Interactive Discussion
only in estuaries (134 mg C l−1, Zhang et al., 1992) and in rivers during floods (up to 75 mg C l−1, Meybeck and Helmer, 1989).
4.1.1 Definition of POC
For future investigations we suggest a global agreement on defining DOM<0.45µm and POM>0.45µm (Zsolnay, 2003) which would guarantee a direct comparison of the
5
data between DOC studies. Past studies sometimes defined POC as particles>0.7µm (Hope et al., 1997; Billett et al., 2004; Dawson et al., 2004; Kardjilov et al., 2006) or
>0.8µm (Raymond et al., 2004). The use of 0.7µm filter pore size for this study would have reduced the results for POC concentrations by 20 to 85%.
Other studies also defined an upper limit for the size of POC, e.g. Chow et al. (2005)
10
proposed 1.2µm and Michalzik and Stadler (2005) used 2 mm as an upper limit. Our study demonstrated that flooding of soil horizons releases large particles and that par-ticle sizes may vary over a wide range. Therefore, we propose that no upper size limit of POC is defined since an important mobile C fraction would be missed in the pore water dynamics of peat. For instance, 10 to 100% of the POC in our study was too
15
large to fit in the definition range of Chow et al. (2005).
4.1.2 Origin and biochemical composition of POM and DOM
Both DOM and POM are composed of aggregated colloids, organic filaments, cell fragments, microbial biomass (e.g., algae and bacteria) (Ranville and Schmiermund, 1998). POM may form from aggregation of DOM (Kerner et al., 2003). Consequently,
20
there is no reason to assume that DOM and POM differ substantially in their biochemi-cal composition. The preferential presence of large particles (>20µm) after re-wetting and generally higher POC concentrations in the zone of intensive dry / wet cycles sug-gest that POM of this study mainly originated from mechanical ablation of the peat. However, high and relatively constant POC concentrations in the permanently
water-25
BGD
5, 2049–2073, 2008POC in pore water in fens
S. Fiedler et al.
Title Page
Abstract Introduction
Conclusions References
Tables Figures
◭ ◮
◭ ◮
Back Close
Full Screen / Esc
Printer-friendly Version
Interactive Discussion
play an important role in POM dynamics. Polysaccharide producing microbes can lead to the formation of particles>2µm. According to Petry (2004), this can lead to a POC increase of 8–72% in waters. Using a DAPI stain it was possible to detect microbes on the particles. Interestingly, only one third of the particles was colonized by microbes, suggesting differences in substrate quality of the POM. However, DAPI staining does
5
not differentiate between active, inactive or dead cells. It is therefore still unclear if the microbes detected on the POM particles were actively metabolizing and function-ally important for POM turnover. Therefore, the activity status of microbes colonizing POM particles and consequently the significance of bacteria fungi and Archaea for the stability of POM has to be investigated in further experiments using molecular tools.
10
Nevertheless our results suggest that POM may function as an important internal shut-tle for C and associated organisms.
4.2 Sources of DIC – the largest component of TC
DIC was the largest C component of the investigated pore waters. The high DIC concentrations resulted from a surplus of CO2 derived from the feeding karst waters 15
(geogenic carbon) and the accumulation of biogenic CO2. The distribution of δ 13
C values shows the expected distinct variations among the samples. Theδ13C values determined for CO2in the gaseous phase (from−23.0 to−25.1) in the Histosols were close to the isotopic signature of decomposed C-3 vegetation in soils (−25) (Deines, 1980). Signatures of the different samples of the aquatic systems were comparable to
20
those reported from other aquatic systems, including streams (−13.9), springs (−14.2), groundwater (−13.7), and soil water (−16.3) (Pan et al., 2002; Marfia et al., 2004). Theδ13C values for DIC of the pore waters (−16.7 to−18.4) were lower than values of aquatic system and higher than CO2 of the gaseous phase of pore space (up to −26.6±0.4). This reveals that the DIC of the pore waters in our site does not
exclu-25
sively originate from accumulated CO2 of in situ microbial activity but also from the
BGD
5, 2049–2073, 2008POC in pore water in fens
S. Fiedler et al.
Title Page
Abstract Introduction
Conclusions References
Tables Figures
◭ ◮
◭ ◮
Back Close
Full Screen / Esc
Printer-friendly Version
Interactive Discussion
signal into the two sources, since we neither know the production rates of CO2 in the soils nor could we determine the proportion of the karst water that really reaches the measurement plots.
The mean DIC concentrations (94–280 mg C l−1) of the pore waters investigated were higher than concentrations found in soil solutions of other studies (30–
5
113 mg C l−1, Marfia et al., 2004; Sigfusson et al., 2006) or aquatic systems (<15 mg C l−1, Hoffer-French and Hermann, 1989; Huttunen et al., 2002, Billett et al., 2004; Dawson et al., 2004). In this study, the highest DIC concentrations were ob-served in the re-wetted fen in the permanently water-saturated horizons. We attribute a significant share of the DIC to the use of DIC-rich karst water for re-wetting because
10
DIC in the re-wetted fen showed the highestδ13C values (−16.7±0.6).
4.3 CH4– the smallest and most dynamic component
Dissolved CH4exhibited the lowest concentrations of all C components varying around
0.1% of TC in pore waters. Nevertheless, the values represent super-saturation of CH4 of up to 100 000 fold compared to atmospheric equilibrium concentration. Methane
15
amounts might not be important for sub-surface C-budgets, but CH4concentrations are
highly variable in time and space. Fiedler et al. (2005) reported CH4concentrations in pore water of hydric soils of up to 1.8 mg C l−1. Consequently, CH
4must be considered
for the understanding of C turnover in peat soils. Small CH4 pools in the soil solution
measured synchronously to net CH4 emissions at the soil surface (data not shown) 20
also point to fast escape from the production zone to the atmosphere or indicate high turnover rates.
5 Conclusions
There is a sharp discrepancy in the attention that is brought about to DOC as compared to POC that was hardly considered. This study exhibited that POC and DOC were at
BGD
5, 2049–2073, 2008POC in pore water in fens
S. Fiedler et al.
Title Page
Abstract Introduction
Conclusions References
Tables Figures
◭ ◮
◭ ◮
Back Close
Full Screen / Esc
Printer-friendly Version
Interactive Discussion
least equally relevant for the carbon composition in the pore water of the studied His-tosols. Independent of water management the POC fraction reached means of up to 30% of TC while DOC had means of up to 35% of TC in pore waters. Our results fur-thermore suggest that DOC and POC represent a size continuum of the same organic matter and need to be studied together to understand their ecological function in the
5
ecosystem. From both a quantitative and qualitative point of view, results suggest that POC is an essential C fraction for internal soil C turnover. However, the POC fraction is a black box up to now. It is only certain that POM particles were colonized by mi-crobes and therefore it is highly likely that it is part of the more labile active carbon pool that is essential for rapid carbon turnover. For this study, it was impossible to derive
10
a mechanistic model explaining POM concentration dynamics because neither spa-tial nor temporal patterns were significantly correlated with environmental parameters such groundwater level, soil temperature or precipitation. Given the importance of POM within the C budget of peatlands, more data sets over a longer period than two years are needed. The ultimate fate of POM in pore waters of Histosols demands greater
15
consideration when calculating C budgets, particularly the extent to which POM is ex-ported to aquatic systems, or undergoes degradation and returns to the atmospheric C pool.
Acknowledgements. This study was funded by the Deutsche Forschungsgemeinschaft (DFG) and was integrated in the graduate college “strategies to reduce the emission of greenhouse
20
gases and environmental toxic agents from agriculture and land use”.
References
Amann, R. I., Krumholz, L., and Stahl D. A.: Fluorescent oligonucleotide probing of whole cells for determinative, phylogenetic, and environmental studies in microbiology, J. Bacteriol., 172, 762–770, 1990.
25
BGD
5, 2049–2073, 2008POC in pore water in fens
S. Fiedler et al.
Title Page
Abstract Introduction
Conclusions References
Tables Figures
◭ ◮
◭ ◮
Back Close
Full Screen / Esc
Printer-friendly Version
Interactive Discussion
rRNA-Targeted Oligonucleotide Probes and Scanning Confocal Laser Microscopy, Appl. Env. Microb., 61, 1013–1019, 1995.
Billett, M. F., Palmer, S. M., Hope, D., Deacon, C., Storeton-West, R., Hargreaves, K. J., Flechard, C., and Fowler, D.: Linking land-atmosphere-stream carbon fluxes in a lowland peatland system, Global Biogeochem. Cy., 18, GB1014, doi:10.1029/2000GB002058, 2004.
5
Bouchard, V.: Export of organic matter from a coastal freshwater wetland to Lake Erie: an extension of the outwelling hypothesis, Aquat. Ecol., 41, 1–7, 2007.
Bouillon, S., Dehairs, F., Schiettecatte, L.-S., and Borges, A. V.: Biogeochemistry of the Tana estuary and delta (northern Kenya), Limnol. Oceanogr., 52, 46–59, 2007.
Chow, A.T., Gio, F., Gao, S., Breuer, R. and Dahlgren, R.A.: Filter pore size selection for
10
characterizing dissolved organic carbon and trihalomethane precursors from soils, Water Res., 39, 1255-1264, 2005.
Clever, H. L. and Young, C. L.: IUPAC – solubility data series, Methane. Vol. 27/28, Pergamon, Oxford, UK, 1986.
Dawson, J. J. C., Billet, M. F., Hope, D., Palmer, S. M., and Deacon, C. M.: Sources and sinks
15
of aquatic carbon in a peatland stream continuum, Biogeochemistry, 70, 71–92, 2004. Dawson, J. J. C., Billet, M. F., Neal, C., and Hill, S.: A comparison of particulate, dissolved
and gaseous carbon in two contrasting upland streams in the UK, J. Hydrol., 257, 226–246, 2002.
Deines, P.: The terrestrial environment, in: Handbook of Environmental Isotope Geochemistry,
20
edited by: Fritz, P. and Fontes, J. C., Elsevier, Amsterdam, The Netherlands, 75–140, 1980. Fiedler, S., H ¨oll, B. S., and Jungkunst, H. F.: Discovering the importance of dissolved carbon
dioxide export from a temperate spruce forest ecosystem, Sci. Total Environ., 368, 909–915, 2006.
Fiedler, S., H ¨oll, B. S., and Jungkunst H. F.: Methane budget of a forest catchment in relation
25
to soil pattern, Biogeochemistry, 76, 1–20, 2005.
Flinsbach, D., Haakh, F., Locher, A., M ¨ack, U., R ¨ohrle, B., Scheck, R., Schloz, W., Steiner, H., and Weinzierl, W.: Das w ¨urttembergische Donauried, Seine Bedeutung f ¨ur Wasserversorgung, Landwirtschaft und Naturschutz, Zweckverband Landeswasserver-sorgung, Stuttgart, Germany, 1997.
30
Geyer, O. F. and Gwinner, M. P.: Geologie von Baden-W ¨urttemberg, Schweizerbart‘sche Ver-lagsbuchhandlung, Stuttgart, Germany, 1986.
BGD
5, 2049–2073, 2008POC in pore water in fens
S. Fiedler et al.
Title Page
Abstract Introduction
Conclusions References
Tables Figures
◭ ◮
◭ ◮
Back Close
Full Screen / Esc
Printer-friendly Version
Interactive Discussion
relationship to carbon dioxide efflux from restored peat bogs, Geoderma, 113, 397-411, 2003.
Guo, L. and MacDonald, R. W.: Sources and transport of terrigenous organic matter in the upper Yukon river: evidence from isotope (delta 13C, delta 14C, and delta 15N) composi-tion of dissolved, colloidal, and particulate phase, Global. Biogeochem. Cy., 20, GB2011,
5
doi:10.1029/2005GB002593, 2006.
Hoffer-French, K. J. and Herman, J. S.: Evaluation of hydrological and biological influences on CO2-fluxes from a karst system, J. Hydrol., 198, 189–212, 1989.
H ¨oll, B. S.: Die Rolle des Porenraums im Kohlenstoffhaushalt anthropogen beeinflusster Niedermoore des Donaurieds, PhD, University of Hohenheim, Institute of Soil Science,
10
http://opus.ub.uni-hohenheim.de/volltexte/2007/187/, 2007.
Hope, D., Billett, M., and Cresser, M. S.: Exports of organic carbon in two river systems in NE Scotland, J. Hydrol., 193, 61–82, 1997.
Huttunen, J. T., V ¨ais ¨anen, T. S., Heikkinen, M., Hellsten, S., Nyk ¨anen, H., Neonen, O., and Martikainen, P. J.: Exchange of CO2, CH4, and N2O between the atmosphere and two ponds
15
with catchments dominated by peatlands or forest, Plant Soil, 242, 137-146, 2002.
IPCC: Fourth Assessment Report, Climate Change,http://www.ipcc.ch/pdf/assessment-report/
ar4/syr/ar4 syr topic1.pdf, 2007.
Johnson, G. D. and Nogueira Araujo, G. M. de C.: A simple method of reducing the fading of immunofluorescence during microscopy, J. Immunol. Methods, 43, 349–350, 1981.
20
Kardjilov, M. I., Gisladottir, G., and Gislason, S. R.: Land degradation in northeastern Iceland: present and past carbon fluxes, Land Degrad. Dev., 17, 401–417, 2006.
Kerner, M., Hohenhberg, H., Ertl, S., Reckermann, M. and Spitzy, A.: Self-organization of dissolved organic matter to micelle-like microparticles in river water, Nature, 422, 150–153, 2003.
25
Laudon, H., K ¨ohler, S., and Buffam, I.: Seasonal TOC export from seven boreal catchments in northern Sweden, Aquat. Sci., 66, 223–230, 2004.
Marfia, A. M., Krishnamurthy, R. V., Atekwama, E. A., and Panton, W. F.: Isotopic and geo-chemical evolution of ground and surface waters in a karst dominated geological setting: a case study from Belize, Central America, Appl. Geochem., 19, 937–946, 2004.
30
Meybeck, M. and Helmer, R.: The quality of rivers: from pristine stage to global pollution, Global Planet. Change, 1, 283–309, 1989.
BGD
5, 2049–2073, 2008POC in pore water in fens
S. Fiedler et al.
Title Page
Abstract Introduction
Conclusions References
Tables Figures
◭ ◮
◭ ◮
Back Close
Full Screen / Esc
Printer-friendly Version
Interactive Discussion
organic matter fluxes to the forest floor, Geoderma, 127, 227–236, 2005.
Moore, T. R. and Clarkson, B. R.: Dissolved organic carbon in New Zealand peatlands, New Zeal. J. Mar. Fresh., 41, 137–141, 2007.
Neal, C. and Hill, S.: Dissolved inorganic and organic carbon in moorland and forest streams: Plynlimon, mid Wales, J. Hydrol., 153, 231–243, 1994.
5
Pan, G., Shiyi, H., Jianhua, C., Yuxiang, T., and Yuhua, S.: Variation ofδ13C in karst soil in Yaji Karst Experiment Site, Guilin. Chin. Sci. Bull., 47, 500–503, 2002.
Pastor, J., Solin, J., Bridgham, S. D., Updegraff, K. Harth, C., Weishampel, W., and Dewey, B.: Global Warming and the export of dissolved organic carbon from boreal peatlands, Oikos, 100, 380–386, 2003.
10
Petry, C.: Mikrobieller Abbau von partikul ¨arem organischen Materialien der tiefen Wassers ¨aule. Ph.D. thesis, Leibnitz-Institut f ¨ur Ostseeforschung, Meereswissenschaftliche Beitr ¨age 61, Warnem ¨unde, Germany, 2004.
Ranville, J. F. and Schmiermund, R. L.: An overview of environmental colloids. In Perspectives in Environmental Chemistry, edited by: Macalady, D. L., Oxford University Press, New York,
15
USA, 25–56, 1998.
Raymond, P. A., Bauer, J. E., Caraco, N. F., Cole, J. J., Longworth, B., and Petsch, S. T.: Controls on the variability of organic matter and dissolved inorganic carbon ages in northeast US rivers, Mar. Chem., 92, 353–366, 2004.
Richey, J. W. and Victoria, R. L.: C, N, and P export dynamics in the Amazon Rivers, in:
20
Interaction of C, N, P, and S, Biogeochemical Cycles and Global Change, edited by: Wollast, R., MacKenzie, F. T., and Chou, L., Springer, NATO ASI (14), 163–193, 1993.
Sigfusson, B., Paton, G. I., and Gislason, S. R.: The impact of sampling techniques on soil pore water carbon measurements in an Icelandic Histic Andosol, Sci. Total Environ., 396, 203–219, 2006.
25
Waddington, J. M. and Roulet, N. T.: Groundwater flow and dissolved carbon movement in a boreal peatland, J. Hydrol., 191, 122–138, 1997.
Worrall, F., Burt, T., and Adamson, J.: Fluxes of dissolved carbon dioxide and inorganic carbon from an upland peat catchment: implications for soil respiration, Biogeochemistry, 73, 515– 539, 2005.
30
Worrall, F., Reed, M., Warburton, J., and Burt, T.: Carbon budget for a British upland peat catchment, Sci. Total Environ., 312, 133–146, 2003.
BGD
5, 2049–2073, 2008POC in pore water in fens
S. Fiedler et al.
Title Page
Abstract Introduction
Conclusions References
Tables Figures
◭ ◮
◭ ◮
Back Close
Full Screen / Esc
Printer-friendly Version
Interactive Discussion
its estuary, Mar. Chem., 38, 53–68, 1992.
BGD
5, 2049–2073, 2008POC in pore water in fens
S. Fiedler et al.
Title Page
Abstract Introduction
Conclusions References
Tables Figures
◭ ◮
◭ ◮
Back Close
Full Screen / Esc
Printer-friendly Version
Interactive Discussion
Table 1. Descriptive statistics of C components in pore water and characteristics of the
His-tosols of the Donauried study site. The sampling period was 1 April 2004 to 31 March 2006. Means, standard deviations (SD) and sample numbers (n) of all measured values are shown; statistically significant differences between sites and depth for each carbon component are indicated by different letters (p<1%), n.d.=not defined.
Depth [cm] BD H CaCO3 Corg Nt Time with TOC POC DOC DIC
water (DOC+POC) mean±SD (n) mean±SD (n) mean±SD (n) saturation mean±SD(n)
[g cm−3
] [g kg−1
] [%] [mg C l−1
] Deeply drained fen (Foli-Calcic Histosol); extensive grassland since about 25 years
−10 0.31 H10 69 407 28 0 n.d. n.d. n.d. n.d.
−20 0.29 H9-10 84 397 26 0 n.d. n.d. n.d. n.d.
−40* 0.22 − 820 189 2.5 5 90±23 (9)b,d,h 14±14 (9)A,B 86±34 (17)A,B 126±76 (21)h,k
−60 0.18 H6 70 451 25 16 101±39 (26)c,d,e 30
±39 (26)A,B 81
±27 (49)A,C 152
±77 (91)g,h
−80** 0.39 − 22 86 5.0 33 132±40 (44)g,h 45±36 (44)A 95±25 (68)A 176±71 (74)e,f
−150*** − − − − − 87 130±74 (61)d,f,h 125±166 (61)A 72±30 (97)A 280±111 (212)a Moderately drained fen, (Calcari-Fibric Histosol); extensive sheep pasture, nature protection area since 1992
−10 0.24 H9 62 406 36 29 115±59 (15)d,c,h 55±63 (15)A,B 73±30 (41)A,B 94±46 (78)k
−20 0.21 H6 49 425 27 52 141±94 (52)d,h 74±94 (52)A 79±29 (81)B,C 152±78 (121)f,h
−40 0.13 H5 41 465 24 86 138±122 (56)h 67±121 (56)A 88±33 (104)B,C 173±85 (177)f,g
−60 0.17 H5 29 469 23 97 104±41 (79)d,f 38±36 (79)A,B 76±29 (129)B 189±69 (212)e Re-wetted fen, (Calcari-Sapric Histosol); nature protection area since 1972
−10 0.17 H9 57 398 31 91 107±89 (53)c,b,f 72±87 (53)A 41±21 (80)D 193±72 (116)d,e
−20 0.20 H9 56 414 33 94 90±53 (65)b,e,g 46±53 (65)A,B 50±24 (121)D 222±88 (201)c,d
−40 0.21 H7 47 407 32 97 81±53 (55)a,b 46±26 (55)A,B 52±34 (117)D 249±79 (188)a,b
−60 0.16 H7 51 498 27 100 73±51 (57)a 37±52 (57)B 55±41 (126)D 231±66 (208)b,c
BGD
5, 2049–2073, 2008POC in pore water in fens
S. Fiedler et al.
Title Page
Abstract Introduction
Conclusions References
Tables Figures
◭ ◮
◭ ◮
Back Close
Full Screen / Esc
Printer-friendly Version
Interactive Discussion
Table 2. Isotopic ratios of dissolved inorganic carbon and CO2 of gaseous phase (average
above all depth,n=sample numbers).
δ13C-ratios [‰]
Deeply drained fen Moderately drained fen Re-wetted fen Hydrosphere
Pore water −17.9±0.7 (n=10) −18.4±0.6 (n=10) −16.7±0.6 (n=10)
Groundwater −11.8±0.2 (n=3)
Karst groundwater −12.4±0.1 (n=3)
Karst spring −14.3±0.1 (n=3)
Drainage ditch −16.7±0.6 (n=10)
BGD
5, 2049–2073, 2008POC in pore water in fens
S. Fiedler et al.
Title Page Abstract Introduction Conclusions References Tables Figures ◭ ◮ ◭ ◮ Back Close
Full Screen / Esc
Printer-friendly Version
Interactive Discussion
1
% of total dissolved carbon 0 20 40 60 80
(4)
(10)
(18)
% of total dissolved carbon 0 20 40 60 80
DIC
POC
DOC
0 20 40 60 80
20 cm 40 cm 60 cm 150 cm 80 cm 10 cm
deeply drained fen (DDF) moderately drained fen (MDF) re-wetted fen (RWF)
(22) (32) (23) (21) (7) (26) (28) (25) (24) a a a a b b b b a a b c a c b a b c a b b a b b b b b b b b a a a
deeply drained fen (DDF) moderately drained fen (MDF) re-wetted fen (RWF) DIC POC DOC DIC POC DOC
Fig. 1. Relative contribution of each C-component [%] with regard to the overall annual
BGD
5, 2049–2073, 2008POC in pore water in fens
S. Fiedler et al.
Title Page
Abstract Introduction
Conclusions References
Tables Figures
◭ ◮
◭ ◮
Back Close
Full Screen / Esc
Printer-friendly Version
Interactive Discussion
0.4 1 2 4 6 8 10 20 40 ´ 100 200µm
C
u
mulativ
e
distribution of
p
artic
le size
[
%
]
(a)
(b) July 2006
± 10 cm  20 cm - 40 cm | 60 cm August 2006
+ 10 cm { 20 cm 40 cm 60 cm November 2006
z 20 cm 40 cm
August 2006 z 20 cm 40 cm + 60 cm November 2006 { 20 cm 40 cm 60 cm
Fig. 2. Sum curves [cumulative %] of particle size in the POM fraction (>0.45µm) at different
BGD
5, 2049–2073, 2008POC in pore water in fens
S. Fiedler et al.
Title Page
Abstract Introduction
Conclusions References
Tables Figures
◭ ◮
◭ ◮
Back Close
Full Screen / Esc
Printer-friendly Version
Interactive Discussion
10 µm
Fig. 3. DAPI staining POC particle (>0.45µm) from water sample collected from moderately

![Fig. 1. Relative contribution of each C-component [%] with regard to the overall annual dis- dis-solved C content (numbers in brackets are dates of measurements)](https://thumb-eu.123doks.com/thumbv2/123dok_br/18390455.357484/23.918.232.475.59.533/relative-contribution-component-overall-content-numbers-brackets-measurements.webp)
![Fig. 2. Sum curves [cumulative %] of particle size in the POM fraction (>0.45 µm) at di ff erent managed peatlands of the Donauried (Germany), (a) re-wetted fen, (b) moderately drained fen at distinct sampling depths and times.](https://thumb-eu.123doks.com/thumbv2/123dok_br/18390455.357484/24.918.185.533.93.501/cumulative-particle-fraction-peatlands-donauried-germany-moderately-distinct.webp)