M
ayoral quality and Municipal perforMance inB
razilian local governMentsClaudia N. Avellaneda* Ricardo Corrêa Gomes**
Abstract
W
e test the inluence of managerial quality on organizational performance using a panel data set on 827 (out of 853) Brazilian municipalities of the state of Minas Gerais over a six-year period (2005-2010). The intra-country and intra-state comparison controls for potential institutional, historical, and cultural variables. Local managerial quality is assessed in terms of mayoral education and experience (public and reelection), and municipal performance is operationalized as property tax collected per capita and property tax collected as a percentage of total revenue. The study covers the four years of the 2005-2008 mayoral administration and the irst two years of the 2009-2012 administration. After testing the efect of political, economic, and ideological factors and controlling for other municipal factors, we ind, contrary to our expectations, that mayoral quality fails to explain variance in property tax collection. Rather, political factors (legislature support and electoral cycle) seem to be more strongly correlated with municipal property tax collection. Speciically, municipalities in which the mayor enjoys more partisan support on the city council tend to collect more property tax. Moreover, compared to the irst three years of mayoral administration, in the last year of mayoral administration – that is, during the mayoral election year – municipalities tend to reduce their property tax collection.Keywords: Performance in public organizations. Mayors. Minas Gerais. IPTU.
c
apacidade gerencial dos prefeitos e odeseMpenho de Municípios Brasileiros
Resumo
N
ós testamos a influência da capacidade gerencial no desempenho organizacional empregando dados em painel de 827 (dentre 853) cidades brasileiras do Estado de Minas Gerais num período de seis anos (2005-2010). A comparação dentro do país e dentro do estado é um controle para potenciais variáveis institucionais, históricas e culturais. Capacidade gerencial local é avaliada em termos do nível educacional e experiência do prefeito (experiência em cargos públicos e reeleição), o desempenho municipal é operacionalizado em termos de arrecadação de IPTU per capta e arrecadação de IPTU em relação ao total da Receita. O estudo compreende os quatro anos da administração 2005-2008 e os dois primeiros anos da administração 2009-2012. Após testar os efeitos dos fatores políticos, econômicos e ideológicos e controlando outros fatores relacionados ao município, nós descobrimos, ao contrário de nossas expectativas, que a capacidade gerencial do prefeito falha em explicar a variância da arrecadação de IPTU. Fatores políticos (suporte legislativo e ciclo eleitoral) parecem ser bem mais fortemente correlacionados com arrecadação de IPTU. Especiicamente, nos municípios em que*PhD. Associate professor, School of Public & Environmental Afairs Governance and Management FacultyChair.FacultyAiliateintheCenterforLatinAmericanandCaribbeanStudies,inthePolitical ScienceDepartmentandintheOstromWorkshoponPoliticalTheoryandPolicyAnalysis,Indiana University.E-mail:[email protected]
o prefeito goza de apoio partidário na Câmara dos Vereadores a arrecadação de IPTU é maior. Além disso, ao comparar com os três primeiros anos da administração, o último ano as prefeituras tendem a reduzir a arrecadação de impostos.
Palavras-chave: Desempenho de organizações públicas. Prefeituras municipais. Minas Gerais. IPTU.
Introduction
A
crisis of conidence in government has encouraged the search for solutions that both recover citizens’ support and improve government performance. To achieve these goals, development eforts have shifted focus from central government to local governments (WORLD BANK, 1997). This shift is grounded in the expectation that local governments are closer to citizens and have better information on citizens’ needs. This irst-hand information is expected to contribute to government eiciency, efectiveness, and responsiveness, which in turn are expected to boost citizens’ support for government. As a result, in those countries whose constitution does not stipulate a formal separation of power for subnational governments (e.g., Colombia, Bolivia), or whose federations are not truly autonomous (e.g., Venezuela), scholars have suggested and practitioners have adopted iscal, political, and/or administrative decentralization (RONDINELLI, 1981). With the adoption of decentralization, a great deal of responsibility has shifted from central to local governments. Municipalities are now responsible for planning and delivering social programs and for collecting and managing taxes to support these programs. Despite the generalized increase in autonomy and responsibility, municipal performance varies considerably. This variance in response leads us to our research question: Whatdrivesmunicipalperformance?The literature on public organizational performance has presented political, economic, and socio-demographic factors to explain variation in organizational performance.Among the political inluences, scholars refer to government ideology (SWANK, 2002), mechanisms of control (SANTISO; BELGRANO, 2004), partisan support (DOIG; HARGROVE, 1987, 1990), divided government (CLINGERMAYER; WOOD, 1995), citizens’ participation (BLAIR, 2000), politicians’ motivation (ANDERSON, 2003; GIBSON; LEHOUCQ, 2003), and electoral competitiveness (HOLBROOK; VAN DUNK, 1993). Among the economic determinants, studies examine budgets, gross domestic production (GDP), and level of development. Finally, as a socio-demographic explanation, scholars point to the size and nature of the target population (DURANT; LEGGE, 1993; AVELLANEDA, 2009a, 2009b; WALKER; DAMANPOUR; AVELLANEDA, 2010). This set of political, economic, and socio-demographic explanations, however, focuses on factors external to the organization (macro level), neglecting the potential inluence of internal factors, such as the elected public manager (micro level). As Pandey and Moynihan (2006, p. 9) state, “no group of political actors is more important to the operation of public agencies than elected oicials”.
To address this research gap, this study seeks to contribute to the literature on local governments, organizational performance, and public management by exploring the efects elected public managers have on municipal performance. Speciically, we suggest that managerial quality inluences municipal performance. Local managerial quality is assessed in terms of mayoral education and experience (age and previous mayoral service), and municipal performance is assessed with two indicators of property tax collection: property tax collected per capita and property tax collected as a percentage of total tax revenue. We test the managerial quality thesis using a panel data set on 827 Brazilian municipalities of the state of Minas Gerais over a six-year period, thus covering the four six-years of the 2005-2008 mayoral administration and the irst two years of the 2009-2012 administration.
they are among the most decentralized and autonomous units in all of Latin America (NICKSON, 1995; COSTA, 1998; SAMUELS, 1998, 2004; TITIUNIK, 2009). Indeed, the strength of Brazil’s subnational governments encourage Brazilian politicians to aspire to governor- and municipal-level positions after serving in congress at the federal level in Brasilia (SAMUELS, 1999, 2000).
After testing the efect of political, economic, and ideological factors, and controlling for other municipal factors, we ind that, contrary to our expectations, mayoral quality fails to explain variance in property tax collection. On the contrary, political factors (legislature support and electoral cycle) seem to more closely correlate with municipal property tax collection. Speciically, municipalities in which the mayor enjoys more partisan support on the city council tend to collect more property tax. Moreover, compared to the irst three years of mayoral administration, in the last year of mayoral administration – that is, during the mayoral election year – municipalities tend to reduce their property tax collection.
By identifying the drivers of municipal performance, this research also seeks to contribute to the literature on governance and development in developing countries, which continues to be understudied (GRINDLE, 1997, 2000, 2009). Finally, far from undermining the explanatory power of existing demographic, socio-economic, and political/institutional factors, this study tests their impact alongside the inluence of managerial quality. In doing so, the study tests the applicability of governance propositions generated in the U.S. organizational context to developing-country municipalities.
Brazilian municipalities
Brazil’s territorial area is 8,514,876 km2, covering more than half of South America. According to 2010 World Development Indicators (WORLD BANK, 2010), Brazil’s gross domestic product was US$2.09 trillion and its estimated population was 195 million. Brazil’s political history is marked by a long period of military involvement. The military governed Brazil in alliance with the civilian economic and social elite between 1964 and 1985. In 1985, the military handed over power to a civilian government, following an indirect election in which a compromise candidate, Tancredo Neves, was chosen.1 However, it was not until 1989 that the irst direct presidential election took place. The Brazilian 1988 constitution provides for federal governments, and Article 30 guarantees the independence of state and local levels of government. As of June 2010, Brazil had 5,562 municipalities across 26 states and a federal district, with populations ranging from 800 to more than 11 million residents and averaging 33,145 inhabitants (see Tables 1 and 2).
Table 1 – Municipal population distribution by region and group of inhabitants.
Group of inhabitants
N. of municipalities
N. of municipalities in the region
North
North-East
Center-West
South-East South
Up to 10,000 2,661 183 662 267 812 737
10,000-20,000 1,292 100 557 104 326 205
20,000-50,000 1,033 115 416 65 289 148
50,000-200,000 448 42 132 26 170 78
200,000-500,000 93 8 15 3 47 20
500,000 and more 35 2 12 2 17 2
Total 5,562 450 1794 467 1,661 1,190
Source: IBGE (2010).
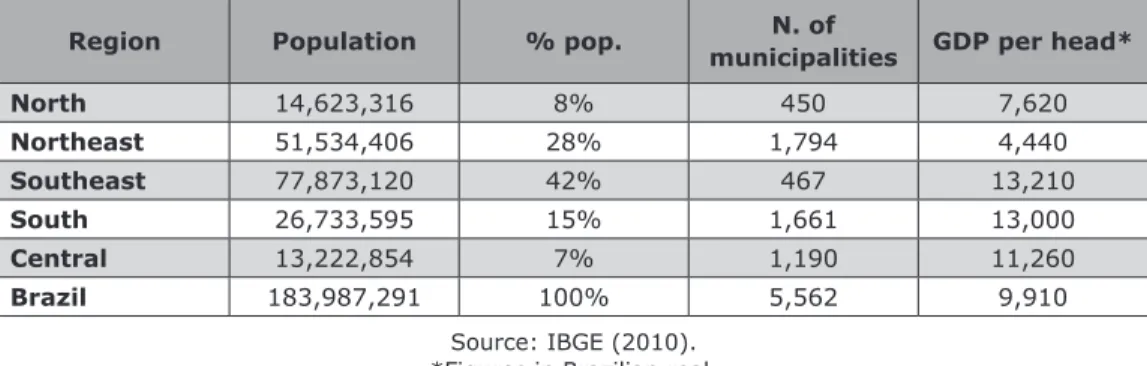
Table 2 – Demographic and economic characteristics of the Brazilian municipalities by region.
Region Population % pop. N. of
municipalities GDP per head*
North 14,623,316 8% 450 7,620
Northeast 51,534,406 28% 1,794 4,440
Southeast 77,873,120 42% 467 13,210
South 26,733,595 15% 1,661 13,000
Central 13,222,854 7% 1,190 11,260
Brazil 183,987,291 100% 5,562 9,910
Source: IBGE (2010). *Figures in Brazilian real.
**The Federal District (Brasília) is not included in these igures.
Brazilian municipalities are economically diverse, and this diversity is mainly a function of the region in which the municipality is located.2 Despite their economic diversity, the concentration of political power at the subnational level encourages federal legislators to consider the federal legislature as a stepping stone to the subnational level, where the real power resides (SAMUELS, 1999, 2000). As a result, the prevailing political ambition among Brazilian politicians is to be governor of their home state or mayor of its capital.
Unlike the United States’ two forms of local government – council-manager and mayor-council – in Brazil, as in most Latin American countries, there is a unique local form: a strong, elected mayor (prefeito). The Brazilian Constitution of 1988 (Article 29) stipulates a legislative body, câmara de vereadores, that oversees a directly elected mayor and whose members are concurrently elected for a four-year term. Based on municipal population, the legislative body consists of no fewer than nine and no more than 45 members (the latter speciied for municipalities with more than 5 million inhabitants).
During military rule from 1964 to 1985, direct elections for mayors continued in many small and medium-sized municipalities. In state capitals and other important cities, however, the military prevented mayoral elections (SAMUELS, 2000, 2004). These continuous-but-partial mayoral elections, along with the efective suspension of the states’ intermediary role between municipal and national executive governments, led local politicians to claim credit for the implementation of municipal projects. Consequently, municipal political autonomy increased during the period of military rule (TITIUNIK, 2009, LITSCHIG; MORRISON, 2009, SAMUELS, 2000).
In 1985, the party of the dictatorship, Partido Democrático Social (PDS), lost the presidency to the major opposition party, Partido de Movimiento Democrático Brasileño (PMDB), though the election was indirect rather than popular. Following this decision in 1985, mayoral elections were held again in the state capitals. The 1988 elections subsequently became the irst in over two decades in which all municipalities elected their own mayors (LITSCHIG; MORRISON, 2009). In 1989, the irst direct presidential elections took place. Since 1996, both the mayor and the municipal legislature have been elected in general elections every four years.
Brazilian mayors are elected for a four-year term and may be reelected in only two consecutive elections. To serve as mayor, the constitution requires candidates to be Brazilian citizens older than 21 years (versus 18 years for the legislative body), and to reside in the electoral circumscription and ailiate with a political party. Mayors perform both political and administrative functions. In cities with more than 200,000 inhabitants, mayoral elections require the winner to obtain more than 50 percent of the
vote, often requiring the use of run-of elections.3 However, according to the calculations of the Instituto Brasileiro de Administração Municipal (IBGE, 2010), municipalities with fewer than 20,000 inhabitants make up 71 percent of total Brazilian municipalities4 (see Table 1), so most municipalities do not have this 50 percent requirement. Local elections are not concurrent with state, presidential, and congressional elections; they are held in the second year between the state and national elections.
Brazilian municipalities receive most of their funds from federal and state transfers, which make up, on average, 75 percent of municipal revenues. However, depending on municipal iscal capability and regional development, transfers can account for as much as 99 percent (e.g., Nova Palmeira in Paraiba State) or as little as 20 percent (e.g., Bertioga in São Paulo State) of the municipal revenue (National Treasury Secretary 2010). Municipalities also collect their own revenues from sources such as property tax, sales tax, royalties, and propertytransfer tax (see Table 3).
Table 3 – Federal and state transfers and local revenues of Brazilian municipalities.
Federal transfers State transfers Local revenue
• 22.5% of income tax • 25% of tax on industrial
products (IPI)
• 50% of rural property tax • 70% of tax on gold and
inancial operations (Gold/IPF)
• 25% of value-added
tax (ICMS)
• 50% of vehicle
registration tax (IPVA)
• Service tax (ISS) • Urban property tax • Frontage tax
• Property transfers (ITBI)
Source: IBGE (2010).
In the Brazilian Constitution of 1988, Article 30, Chapter IV establishes municipal responsibilities, which include preserving natural resources and cultural heritage as well as parceling land and providing local services, such as public transportation. Municipalities also share responsibility with the federal and state authorities to provide basic education (covering pupils from 6 to 15 years old) and health services (IBGE, 2001, 2002, 2004). In 2000, the Cardoso administration passed the Fiscal Responsibility Law (FRL). This law makes public oicials legally liable for any infractions and requires state and municipal authorities to: 1) restrict their deicits, and 2) disclose revenue, spending accounts, borrowing, and budget allocations. As in Colombia, but in contrast to some other Latin American countries (most notably Chile), Brazilian municipalities may borrow from commercial banks on a short-term basis and under certain circumstances. Municipalities may spend up to 60 percent of their net revenue on operational costs (SOUZA, 2002). Municipalities must spend at least 25 percent of transferred monies, which derive from federal income tax, on education (FUNDEF)5, and 15 percent on health services (the Uniied Health System).
The next section addresses the drivers of organizational performance to derive the pertinent hypotheses.
Explaining public organizational performance
Existing explanations for government performance have emerged from organizational studies conducted in the United States’ context. The present study tests their applicability when transferred to the municipal level in developing contexts. Factors understood to inluence performance are grouped into three categories: political/institutional, demographic, and socio-economic.
3Eachofthe27governorsmustalsoachievemorethan50percentofthevote,leadingtoarun-of betweenthetoptwocandidatesifnecessary.Statelegislatureshaveonlyonechamber.Thedeputies areelectedthroughanopen-listsysteminwhichthestateservesasoneconstituency.
4Brazilhas3953municipalitieswithlessthan20,000inhabitants(IBGE,2010).
Political support
In the public sector, unlike the private sector, political support determines managers’ power and efectiveness (MEIER; O’TOOLE JUNIOR, 2002; FERNÁNDEZ, 2005; RAINEY, 1997). Without political support, public managers are likely to exhibit cautious behavior, avoidance of risk taking, lack of lexibility, and decline in innovation, all of which afect managers’ performance (THOMPSON; RICUCCI, 1998; PANDEY; MOYNIHAN, 2006). Although political support can be manifested through formal and informal mechanisms, such as intergovernmental networks (AGRANOFF; MCGUIRE, 1998; O’TOOLE JUNIOR; MEIER, 2004), formal political support for elected public managers comes primarily from three directions: above (high ranking oicials), parallel (legislative support), and below (electoral support).
Support from above: in settings where the acquisition of extra resources involves great diligence and negotiation with leaders at higher levels, those who enjoy political support at higher levels are likely to be the winners. Ricucci (1995), for example, inds that successful federal executives enjoy strong support from superiors as well as from other key political actors. In school districts, Fernández (2005) also hypothesizes that a school board’s support for the superintendent inluences school performance. In a municipal setting, however, political support from higher-ranking oicials may be a function of party alignment.
In the Brazilian context, the relationships among the president, governors, and mayors are conceived as equal and, given the country’s size, mayors often act as campaigners for both the president and the governors. To expand municipal revenues, mayors rely a great deal upon governors, as do governors with respect to the president. Ailiation with its governor’s and/or president’s party should therefore increase the chance of a municipality receiving additional transfers. Brazilian governors are considered the “power brokers” in Brazil’s legislative and distributive politics due to 1) their control of nominations to the most important oices, 2) their overall control of state-level politics via pork-barrel funds, and 3) their inluence on their state’s congressional delegations through broad clientelistic networks (AMES, 2001a; ABRUCIO, 1998; CAREY; REINHARDT, 2001; MONTERO, 2005; SAMUELS; ABRUCIO, 2000; SAMUELS, 2002). Brazilian governors also control municipal access to substantial resources apart from state transfers, which derive from value-added tax (ICMS) and vehicle registration tax (IPVA) (IBGE, 2010).6 In addition to granting extra funds, governors may also provide mayors with technical and administrative assistance to carry out municipal functions, such as tax collection. The same can be said about aligning politically with the president, as those municipalities may be targeted to receive extra resources. Therefore, governors’ political support for mayors is expected to contribute to municipal performance.
H1:Municipalitieswhosemayor’spoliticalpartyalignswiththatofthegovernorand presidentaremorelikelytoperformhigherintermsofpropertytaxcollectionthan municipalitieswhosemayor,governor,andpresidentdiferinpartyailiation.
Locallegislativesupport: municipal capabilities also depend on partisan support for the mayor in the municipal council. Because council members either approve or reject the mayor’s proposals, the greater the council’s partisan support for the mayor, the more likely it is that his or her proposals will succeed in the legislative agenda. Studies of the U.S. Congress and state legislatures conirm greater success in the passage of proposals among members of the majority party (ELLICKSON, 1992; MOORE; THOMAS, 1991). At the municipal level, council members’ partisan support for the mayor is expected to inluence approval of his or her proposals, such as the implementation of aggressive and innovative mechanisms to avoid tax evasion.
In the Brazilian context, a legislative body similar to a city council, the câmara
devereadores, oversees the directly elected mayor. These municipal legislators are concurrently elected for a four-year period through open-list proportional representation. Given the electoral rules, Brazilian municipal legislators’ partisan support for mayors is unstable. As Stevens (2005) states with regard to Brazilian local politics, “[At] the local level, a number of high proile last minute defections on the part of both mayors and senior council members have increased calls for reforms to prevent candidates switching parties in such a manner” (1).7 Guaranteeing council members’ political support therefore
becomes a priority for mayors. These observations lead us to the following hypothesis: H2: The greater the mayor’s partisan support in the city council, the higher the municipalperformanceintermsofpropertytaxcollection.
Support from below: Doig and Hargrove (1990) claim that successful leadership emerges from constituents’ support. When managers lack political support from the community, their initiatives are unlikely to succeed, no matter how well designed the programs. Therefore, constituents’ support for the elected public manager should also contribute to organizational performance. This view is shared by Fernández (2005) and Meier and O’Toole Junior (2002), who test for the impact of community support in their models of organizational performance in the U.S. context. In both studies, the inluence of community support on organizational performance is positive and statistically signiicant. The inluence of community support on organizational performance may vary across contexts. However, in the Colombian context, Avellaneda (2009a) tests for the inluence of citizens’ support on municipal performance, inding no evidence of it. These inconsistent results suggest that the inluence of community support on organizational performance varies across contexts, calling for more tests.
In Brazil, citizens’ party identiication is very weak, resulting in high electoral volatility (KINZO, 2003; DESPOSATO, 2006). This low party identiication is attributed to the high fractionalization of the party system (KINZO, 1993; SHIDLO, 1998), which leads to party switching (DESPOSATO, 2006), weak party discipline, and a lack of strong ideological platforms (AMES, 2001a, 2001b; MAINWARING, 1991, 1993, 1999; KINZO, 2003). Scholars also point to Brazil’s electoral rules – such as open-list proportional representation and vast at-large statewide districts – as the cause of both candidate-centered (rather than party-centered) competition and a weak party system (MAINWARING, 1991, 1999; KINZO, 2003; DESPOSATO, 2006). As Moisés (1993, p. 577) states, “Brazilians don’t vote for parties, they vote for people”. This weak party loyalty makes citizens’ support for the mayor’s party a valuable asset, which in turn should ease the implementation of mayors’ programs, such as enforcement of tax evasion mechanisms. Therefore,
H3:Thegreaterthemayor’smarginofvictory,thehigherthemunicipalperformance intermsofpropertytaxcollection.
Local government ideology
Other veins of literature suggest that public inance is a function of government ideology. The “government ideology thesis” builds on the idea that parties are not only vote seekers but also oice and policy seekers (PETRY, 1982). Liberals prefer high spending and high taxes while conservatives prefer low spending and low taxes. Studies ind evidence for this thesis at the state and national level. Alt and Lowry (1994), who examined public inance in the U.S., demonstrate that party ailiation inluences spending. Kontopoulos and Perotti (1997) also provide cross-national evidence for these liberal and conservative preferences.
Unlike the United States, but similar to Colombia, Brazilian local politics is characterized by a fractionalized party system. Dissatisfaction with the party system and candidate-centered competition has resulted in the proliferation of new parties. For instance, mayoral elections moved from only two parties winning mayoral oice in 1982, to 16 parties in 1988,8 26 parties in 2000, and 20 parties in 2004 (LITSCHIG; MORRISON, 2009, p. 5-6; TITIUNIK, 2009, p. 6). Although the proliferation of parties makes it diicult to classify them in terms of ideology, the expectation is that parties with more conservative platforms tend to favor lower taxes and may not enforce tax collection.9
H4:Municipalitiesheadedbyconservativemayorsaremorelikelytodecreaseproperty taxcollectionthanmunicipalitieswhosemayorsarenotconservative.
Socio-economic explanations
Complementing the institutional and political explanations, another view focuses on demographic and socio-economic factors to explain organizational performance. Durant and Legge (1993), Lewis-Beck and Alford (1980), and Mazmanian and Sabatier (1989) contend that the success or failure of any organizational policy or program is a function of the size and nature of the target. According to this view, program implementation tends to succeed when the target group is small and homogeneous because it eases identiication and classiication of eligible recipients. Schneider and Ingram’s (1993) “social construction hypothesis” and Lineberry’s (1976) “underclass hypothesis” also refer to the nature of the target, thus itting within the demographic set of explanations for organizational performance. According to these two propositions, governments enforce laws more aggressively on groups with negative social status (due to group bias) and/or perform better in upper or middle class areas (due to class bias). Brazilians’ social, economic, and demographic inequalities are notoriously obvious across their ive regions.10 Brazil’s GDP is most concentrated in the south-east region,11 followed by the south and the center-west, while the north-east and north are the poorest regions.12 Likewise, population is concentrated in the south-east region, followed by north-south-east, south, north, and center-west regions (see Table 2).13 Based on Linberry’s “underclass hypothesis,” municipalities with more favorable
8In1988,Brazil’sinlationratewas1000percent,whichcreateddiscontentandperceptionsofcor-ruption.Thesebeliefstriggereddissatisfactionwiththepartysystem,resultingintheproliferationof “newpartiesseekingdisgruntledvoters”(LITSCHIG;MORRISON,2009,p.6).
9Congressremainshighlyfragmentedbetweendiferentpoliticalparties,themostprominentbeingthe WorkersParty(PT)ontheleft,thecenter-leftBrazilianSocialDemocratParty(PSDB)anditsallies,the center-rightLiberalFrontParty(PFL)andthecentristBrazilianDemocracyMovementParty(PMDB). 10Brazilianstatesalsoexhibitinequalitiesintermsofpoliticalpower.Infact,thestatesofSãoPaulo andMinasGeraishaveprovidedalmostalloftheBrazilianpresidents.Moreover,duringtheperiod ofmilitaryrule(1964-1985),themajorityofpoliticianscamefromthesetwostates.Thisunequal representationisexplainedintermsofSãoPaulo’seconomicpowerandMinasGerais’highnumber ofmunicipalities(863asofSeptember2010).
11WhereRiodeJaneiro(R$17,010)andSãoPaulo(R$15,050)areregardedasthemostimportant statesintermsofwealthcreation.ABrazilianrealequatedto0.58USdollar(asofSeptember2010). 12ThenorthregionincludesthestatesofAcre,Amapá,Amazonas,Pará,Rondônia,Roraima,and Tocantins.ThenortheastregionincludesthestatesofAlagoas,Bahia,Ceará,Maranhão,Paraíba, Pernambuco,Piauí,RioGrandedoNorte,andSergipe.Thecentral-westregionismadeupofthe federaldistrictofBrasilia,andthestatesofGoiás,MatoGrossoDoSul,andMatoGrosso.Thestates ofEspíritoSanto,MinasGerais,RiodeJaneiro,andSãoPauloformthesoutheastregion,andthe statesofParaná,RioGrandeDoSul,andSantaCatarinamakeuptheSouthregion.
socio-economic conditions should perform better. For instance, in terms of tax collection, inhabitants in wealthy localities are more likely to have the monetary resources to pay taxes. Consequently,
H5: The wealthier the population of the municipality, the higher the municipal performanceintermsofpropertytaxcollection.
Managerial quality
Local governments operating under similar political and socio-economic conditions can vary in their performance. This variation suggests that even when accounting for factors external to the organization (political support and socio-demographic conditions), internal factors matter in explaining performance. At the municipal level, a key internal factor is the public manager, the mayor, who politically and administratively manages the municipality. Although governmental performance is a function of collective action, a great deal of its success or failure is also a function of the actions of individual, qualiied managers (COHEN, 1988; COHEN; EIMICKE, 1995; HAASS, 1994; LYNN JUNIOR, 1981, 1987, 1996, 2003). When the qualiications of public leaders are not adequate, as Cohen and Eimicke (1995, p. XVI) state, “most of the public managers are ill-equipped to deliver quality leadership”.
Public managers in the 21st century face complex and shifting challenges, which may be easier to overcome when the manager is qualiied in terms of education and experience. Qualiied mayors can also take advantage of the positive institutional, political, demographic and socio-economic characteristics of the municipality. Even when these contexts are favorable to performance, if the mayor is unable to exploit them, these advantages will remain unrealized opportunities. In developing contexts, however, many municipalities are led by unqualiied mayors who fail to capitalize on opportunities and on human and inancial resources. This lack of competence has led scholars to describe a “management gap” in developing countries: “The term implies that Third World countries, on the whole, manage less efectively, even if they already have individuals and organizations whose performance is high by any standard” (KUBR; WALLACE, 1984, p. 4). In fact, scholars contend that the determining factor in the success or failure of government is public management (BOYNE, 2003, 2004; LYNN JUNIOR, 1981, 1987; MEIER; O’TOOLE JUNIOR, 2002; O’TOOLE JUNIOR; MEIER, 1999). Lynn Junior (2000, p. 15) deines management as “the exercise of judgment or discretion by actors in managerial roles”.However, in developing country municipalities, the lack of managerial judgment and discretion has obstructed efectiveness and performance. Qualiied mayors would be expected to ill this “management gap”. A qualiied mayor, for example, is expected to know whom to hire or to retain to achieve the administration’s goals. Even if the mayor is not proicient in all municipal duties, qualiied mayors are expected to have good judgment in selecting their close advisers. Even under circumstances in which mayors must work with incumbent staf, mayors can adopt other strategies to attain goals, such as innovation, networking, personnel training, reward systems, revenue expansion, enforcement mechanisms, and promotion of citizen participation. In addition, qualiied mayors are more likely to inspire conidence, appropriately structure organizational sub-units, and communicate both clear assignments and operational proceedings to achieve efectiveness.
Although the managerial quality thesis may seem obvious and simplistic, there have been few empirical tests of it. Avellaneda (2009a, 2009b), however, explains Colombian municipal performance as a function of mayoral quality (among other factors). Speciically, Avellaneda inds that the more educated the mayor, the more likely that Colombian municipalities perform higher in terms of provision of education, social spending, and tax property collection. Given the contextual similarity between the Brazilian and Colombian municipalities, such as the level of development, decentralized and fractionalized political power structure, and dual mayoral role as manager and administrator, this study proposes the same expectation. Therefore,
Research design
In this study, the unit of analysis is the municipality. The data cover 96.9 percent of the municipalities of the second most populous Brazilian state, Minas Gerais. Minas Gerais has 853 municipalities with populations ranging from 884 to 2,350,000 inhabitants (Belo Horizonte – the capital), a mean population value of 18,744, and a standard deviation of 40,693. Data availability limited our analysis to 827 municipalities over a six-year period (2005-2012), thus covering the four years of the 2005-2008 mayoral administration and the irst two years of the 2009-2012 administration. A large number of municipalities, like those in the other 25 Brazilian states, are small, with populations below 20,000.
Municipal operations within the State of Minas Gerais relect those of Brazil more generally, and, therefore, serve as a representative sample of the country. Approximately 10 percent of the Brazilian population lives in Minas Gerais, distributed throughout 853 cities. Minas Gerais has the most cities of any Brazilian state, followed by São Paulo with 644. The State’s geographical limits cover 7 percent of the Brazilian territory, corresponding to a demographic density of 33.4 people per km2. According to the most recent data from the Brazilian Institute of Geography and Statistics (IBGE), Minas Gerais contributes 9 percent of the country’s Gross Domestic Product.
With respect to social indicators, the illiteracy rate of the state is 8.31 percent, while the Brazilian average is 9.61 percent. The absolute poverty rate of Minas Gerais is 25.6 percent, which is 11 percent lower than the country as a whole. The life expectancy of the population in Minas Gerais is 75.3 years, compared to 73.8 years for the full Brazilian population. The unemployment rate for the state in 2010 was 10 percent lower than the country rate (6.8 percent and 7.6 percent, respectively). Combining the social and economic conditions of the state, its Human Development Index value is, according to the United Nations Development Programme, 0.727, which is close to that of the whole country at 0.731.
In the realm of public inance, Minas Gerais’ revenues account for 10 percent of all revenues collected by all the states, second only to São Paulo, which collects 27 percent of revenues. In terms of tax collection, Minas Gerais collects approximately 10 percent of the total amount collected, again following São Paulo, which collects 33 percent of nationwide taxes.
Our choice of Minas Gerais as a case study derives from the state’s large number of municipalities and the state’s close resemblance to the national proile with respect to the social indicators described above. Brazilian municipalities are favorable settings in which to test the managerial quality thesis for several reasons. First, Brazilian municipalities exhibit a high degree of autonomy, as they are responsible for the provision of health, education, transportation, and other public services, as well as for tax collection. Second, the 827 Minas Gerais municipalities for which we have data ofer considerable socio-economic and demographic variation. Third, the six-year period under study covers two mayoral administrations, thus allowing for variation in mayor’s qualiications. The result is a unique pooled time series data set.
Data and dependent variables
The data come from several Brazilian institutions: the Brazilian Institute of Geography and Statistics (IBGE), the National Treasury Secretary, the Superior Electoral Tribunal, and the Federal Budget Secretary. To obtain this data, one of the authors visited the agencies.
responsiveness, (BOYNE, 2002). Although Brazilian municipalities are responsible for delivering numerous services, many of these responsibilities are shared with the state and/or the federal government. For example, health care is provided through a combination of municipal, state, and federal eforts, whereas secondary education is the responsibility of the municipality and the state, and tertiary education is the responsibility of the municipality and the federal government. Our approach, therefore, is to assess municipal performance by focusing on a task that is the sole responsibility of the municipality.
We considered municipal expenditure, grant acquisition, and tax collection as potential performance indicators. While we also acknowledge citizens’ assessments as measures of performance, we sought an objective rather than subjective measure. While municipal spending reveals municipal preferences across policy areas, it fails to indicate efectiveness, eicacy, or accountability. Municipal grant acquisition, in contrast, can be used to assess local efectiveness in obtaining additional revenues. However, grant acquisition is tied to intergovernmental relations and organizational capacity, which are beyond the scope of this study. Consequently, this study employs two objective measures of performance that assess municipal efectiveness within the scope of intramunicipal function: the amount of property tax collected per capita and the share of property tax collection as a percentage of total tax revenue.
Brazilian municipal chambers set their municipalities’ property tax rates each year for the year ahead. Despite this system-wide mechanism, there exists a great deal of variation in property tax collection, as many municipalities depend largely on monies transferred from federal and state governments. For example, in 2007, several municipalities collected no revenues from property tax due to either operational diiculties or political practices, such as mayors condoning penalties for unpaid property tax as a strategy to gain political support (DOMINGOS, 2011). Moreover, mayors have full discretion over both changing the property tax rate—in which case, the new rate must be approved by the city council—and implementing strategies to boost property tax collection, which in Brazil is called ImpostosobreaPropriedadePredial eTerritorialUrbana (IPTU). Collection rates also vary because, in the Latin American region in general, both property and income tax collection are central challenges for governments due to an evasion culture, state inefectiveness (BERGMAN, 2009), and the informality of public oices (SMOLKA; DE CESARE, 2006). The variation in tax collection across municipalities makes property tax collection an appropriate indicator for assessing municipal performance.
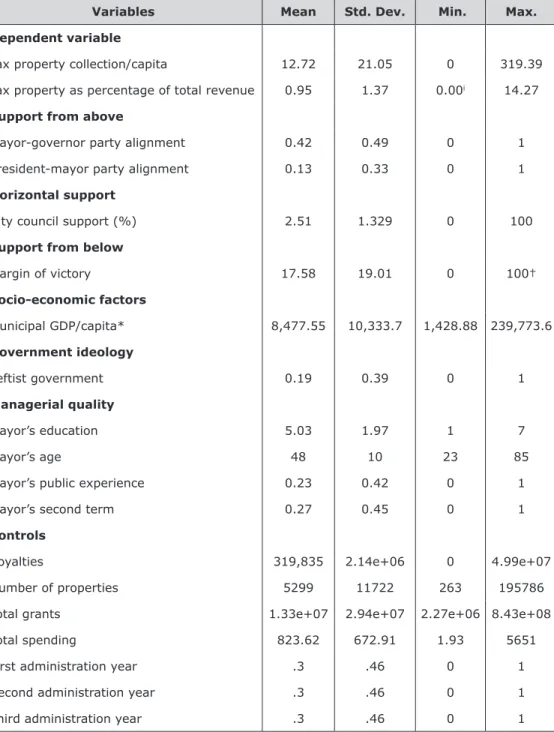
The data for this variable are drawn from the IBGE and the National Treasury Secretary. Values for property tax collection are reported in Brazilian real. We adjust these nominal values for inlation, using the 2008 Consumer Price Index as our delator. These adjusted values are reported per capita in order to make the measure comparable across municipalities. Table 4 provides descriptive statistics for all the variables.
Table 4 – Descriptive statistics.
Variables Mean Std. Dev. Min. Max.
Dependent variable
Tax property collection/capita 12.72 21.05 0 319.39
Tax property as percentage of total revenue 0.95 1.37 0.00i 14.27
Support from above
Mayor-governor party alignment 0.42 0.49 0 1
President-mayor party alignment 0.13 0.33 0 1
Horizontal support
City council support (%) 2.51 1.329 0 100
Support from below
Margin of victory 17.58 19.01 0 100†
Socio-economic factors
Municipal GDP/capita* 8,477.55 10,333.7 1,428.88 239,773.6
Government ideology
Leftist government 0.19 0.39 0 1
Managerial quality
Mayor’s education 5.03 1.97 1 7
Mayor’s age 48 10 23 85
Mayor’s public experience 0.23 0.42 0 1
Mayor’s second term 0.27 0.45 0 1
Controls
Royalties 319,835 2.14e+06 0 4.99e+07
Number of properties 5299 11722 263 195786
Total grants 1.33e+07 2.94e+07 2.27e+06 8.43e+08
Total spending 823.62 672.91 1.93 5651
First administration year .3 .46 0 1
Second administration year .3 .46 0 1
Third administration year .3 .46 0 1
i0.00001 †Due to single candidate
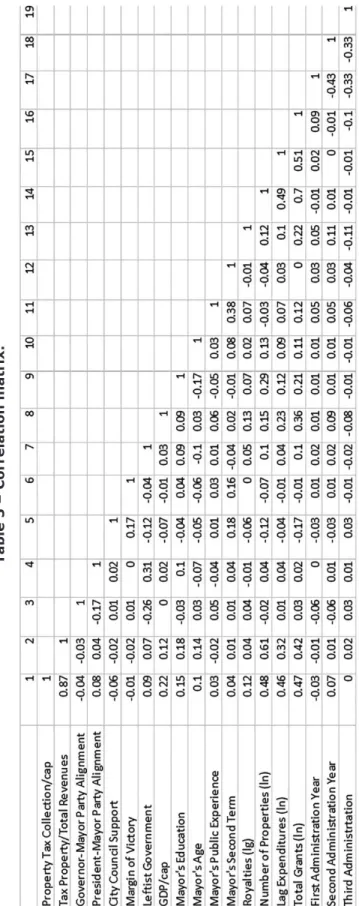
Table 5 – Correlation matrix.
Explanatory variables
Political support: to measure support from above, we employed a dummy variable equal to “1” when the governor’s party ailiation was the same as the mayor’s; otherwise “0” was assigned. We also created a dummy variable equal to “1” when the mayor’s party ailiation aligns with that of the president. Municipal legislative support for the mayor is operationalized as the percentage of elected council members who were of the same political party as the mayor.14 A positive and signiicant coeicient would provide support for the hypothesized relationships. Citizens’ electoral support is operationalized as the margin of victory, in percentage, between the winner and the runner up. However, we do recognize that citizens’s support for tax policies may vary over time. Unfortunately, there are no available data to test for this variation. However, we do control for administration year, which should account for variations across the progression of the administration. Data on citizens’ electoral support are drawn from Brazil’s Superior Electoral Tribunal.
Governmentideology: we begin with the general framework that liberals prefer high spending and high taxes, while conservatives prefer low spending and low taxes. There is empirical evidence for this thesis at both the state and national levels (ALT; LOWRY, 1994; KONTOPOULOS; PEROTTI, 1997). In Brazil, however, the proliferation of parties makes it diicult to clearly divide politicians by ideology to test the government ideology thesis. Therefore, we compare leftist mayors, who may be associated with a more liberal position, against all other mayors. Accordingly, we use a dummy variable, labeled “1” when a mayor’s party is considered leftist, and “0” otherwise. According to Carreirão (2006) and Power and Zucco Junior (2009), the Brazilian parties known by the acronyms PP, PFL, PRN, PDC, PL, PTB, PSC, PRP, PSL, PDS, and PRONA represent the right wing. PMDB and PSDB are regarded as central. PT (President Lula’s Party), PDT, PPS, PCdoB, PSB, PV, PSTU, PCO, and PMN are regarded as left-wing parties. A signiicant and positive coeicient on the leftist ideology would provide support for our H4.
Economicexplanations: municipal GDP per capita is a simple measure. Data derive from the Brazilian Institute of Geography and Statistics (IBGE).
Managerial quality: four indicators assess managerial quality: mayor’s age, education, public sector experience, and reelection for a second consecutive term. Mayoral age, a proxy for experience, is a continuous variable. Given that the Brazilian Constitution, like all other Latin American countries, stipulates no speciic requirements in terms of education and experience for mayoral candidates, mayors come to oice with diverse backgrounds. Brazilian mayors include farmers, vendors, taxi drivers, teachers, priests, lawyers, engineers, physicians, private sector managers, and undergraduate students. A mayor’s education is a categorical variable with values from 1 to 7. Category 1 contains those who can barely read or write their own name (2.81 percent in our sample); Category 2, those who reported having only incomplete primary education (17.09 percent); Category 3, those who completed primary education (8.55 percent); Category 4, those with only incomplete high school degrees (3.79 percent); Category 5, those with high school degrees (25.40 percent); Category 6, those with incomplete undergraduate degrees (3.795); and, inally, Category 7, those mayors who have formal undergraduate degrees (38.58 percent).
Mayors’ public sector experience is measured with a dummy variable, which takes the value of “1” when the mayor had any type of prior public sector employment or appointment (at the local, state, and/or federal level) before taking oice. Data on mayoral age, education, and public sector experience were drawn from the TSE, which compiles background data on mayoral candidates. Whether a mayor is serving in his or her second term is measured with a dummy variable, taking “1” when the mayor has been reelected consecutively; otherwise, “0.”
Control variables: our analysis features ive controls. First, we control for the amount of funding a municipality receives from royalties, as these monies may
discourage municipalities from enforcing tax collection. We log transformed these values to correct for skewness. Data on royalties derive from the National Treasure Database (Finbra).15 Second, we control for the number of properties per municipality as an indicator of property density, log transformed to correct for skewness. These values were obtained from the IBGE website.16 Third, the analysis controls for a municipality’s total spending in the previous year, because the scope of expenditure in the prior year may encourage a municipality to focus on enforcing property tax collection in the following year. Values were log transformed. These data come from National Treasury database. Fourth, we take into account the amount of extra funding a municipality received through grants in the previous year, as these extra resources may discourage municipalities from enforcing tax property collection. These data were also obtained from the National Treasury database, and values were log transformed. Finally, we control for electoral cycles. According to the electoral cycle proposition, performance varies across years because during election years, in order to gain voters, politicians may adopt tax reduction policies (BUCHANAN; TULLOK, 1962; NORDHAUS, 1975). For instance, a mayor may ofer tax discounts during an election year (that is, during the fourth administration year) in order to attain political support for his or her reelection and/or political party. Therefore, we include a dummy variable for irst, second, and third administration year, leaving the fourth administration year, in which local elections are held, as the excluded category.
Methods
Given the nature of the data (unbalanced panel data), we report three sets of estimations speciic to the panel data structure: random-efects, ixed-efects, and Arellano-Bond generalized method of moments (GMM) estimates (ARELLANO; BOND, 1991). Table 6 reports the three estimations for the irst dependent variable, and Table 7 reports the three estimations for the second dependent variable. The Variance Inlation Factor for the two speciication models (given the two dependent variables) suggests that muliticollinerity is not an issue (VIF is 2.75). In addition, the inluence and leverage diagnostics reveal that no single one of the groups (municipalities) overly inluence the estimations; therefore, no municipality-year is excluded.
Table 6 – Explaining property tax collection/capita in Brazilian municipalities (2005-2010).
(1)
Random-efects
(2) Fixed- efects
(3) Arellano-
Bond
Lag property tax collection/cap -0.42***
(0.06)
Governor-mayor party alignment -0.37 -0.21 -0.33
(0.26) (0.26) (0.27)
President-mayor party alignment -0.44 -0.61 -1.83
(0.85) (0.81) (1.59)
City council support 0.67*** 0.63*** 0.44*
(0.20) (0.22) (0.23)
Margin of victory -0.02 -0.02 -0.01
(0.01) (0.01) (0.01)
Leftist government 0.32 0.44 0.30
(0.56) (0.55) (0.55)
15Availablefrom:<www.tesouro.fazenda.gov.br/contas-anuais>. 16Availablefrom:<www.ibge.gov.br>.
(1)
Random-efects
(2) Fixed- efects
(3) Arellano-
Bond
GDP/cap 0.00 0.00 0.00
(0.00) (0.00) (0.00)
Mayor’s education 0.12 0.14 0.04
(0.09) (0.11) (0.13)
Mayor’s age 0.02 0.01 -0.00
(0.02) (0.02) (0.02)
Mayor’s public sector experience -0.65 -0.71 -0.74
(0.54) (0.55) (0.61)
Mayor’s second term 0.08 0.31 0.65
(0.60) (0.60) (0.64)
Royalties (ln) 0.07 0.10 -0.07
(0.15) (0.15) (0.06)
Number of properties (ln) 6.48*** -7.68 -51.88**
(0.96) (8.63) (20.19)
Lag expenditures (ln) 4.47*** 8.53*** -1.53
(1.26) (1.52) (1.38)
Total grants (ln) -0.85 -5.48*** 10.42***
(1.48) (1.85) (3.60)
First administration year 2.32*** 1.46*** 5.69***
(0.33) (0.27) (0.58)
Second administration year 4.73*** 4.34*** 5.39***
(0.38) (0.36) (0.69)
Third administration year 3.01*** 2.20*** 4.95***
(0.34) (0.26) (0.66)
Constant -103.94*** 18.72 284.93***
(15.39) (48.02) (99.33)
Observations 4,632 4,632 2,936
R-squared 0.08
Arellano-Bond test AR(1): p > z 0.90
Arellano-Bond test AR(2): p > z 0.62
Sargan test, p > X2 0.22
Number of municipalities 827 827 810
Source: The authors. Robust standard errors in parentheses *** p < 0.01; ** p < 0.05; * p < 0.1
Table 7 – Property tax collection as a percentage of total municipal revenue (2005-2010).
(1)
Random-efects
(2) Fixed- efects
(3) Arellano-
Bond
Lag property tax collection/cap 0.42***
(0.06)
Governor-mayor party alignment -0.00 -0.00 -0.00
(0.01) (0.01) (0.02)
continued from previous page
(1)
Random-efects
(2) Fixed- efects
(3) Arellano-
Bond
President-mayor party alignment -0.03 -0.03 -0.01
(0.05) (0.05) (0.04)
City council support 0.02*** 0.02** 0.01
(0.01) (0.01) (0.01)
Margin of victory -0.00 -0.00 -0.00
(0.00) (0.00) (0.00)
Leftist government 0.00 0.01 0.03
(0.03) (0.03) (0.03)
GDP/cap 0.00 0.00 -0.00
(0.00) (0.00) (0.00)
Mayor’s education 0.00 0.00 0.00
(0.00) (0.00) (0.01)
Mayor’s age 0.00** 0.00* -0.00
(0.00) (0.00) (0.00)
Mayor’s public sector experience -0.03 -0.03 -0.04
(0.02) (0.02) (0.02)
Mayor’s second term 0.01 0.01 0.05**
(0.02) (0.02) (0.02)
Royalties (ln) -0.01* -0.01 -0.01***
(0.00) (0.00) (0.00)
Number of properties (ln) 0.92*** -0.11 -0.29
(0.06) (0.31) (0.44)
Lag expenditures (ln) -0.17*** -0.05 0.14**
(0.06) (0.06) (0.07)
Total grants (ln) -0.10 -0.10 -0.14
(0.07) (0.09) (0.12)
First administration year 0.14*** 0.14*** 0.14***
(0.02) (0.02) (0.02)
Second administration year 0.11*** 0.11*** 0.09***
(0.01) (0.01) (0.02)
Third administration year 0.10*** 0.09*** 0.08***
(0.01) (0.01) (0.02)
Constant -2.46*** 3.95** 2.81
Observations 4,632 4,632 3,689
R-squared 0.07
Arellano-Bond test AR(1): p > z 0.03
Arellano-Bond test AR(2): p > z 0.70
Sargan test, p > X2 0.20
Number of municipalities 827 827 818
Source: The authors. Robust standard errors in parentheses *** p < 0.01; ** p < 0.05; * p < 0.1
necessary because one year’s tax collection can be afected by the previous year’s tax collection. In other words, we are interested in estimating the parameters of the following model:
Yit= Yit-1γ+xitβ+ μi+εit
As the inclusion of the lag term (Yit-1γ) may be correlated with the unobserved individual-level efect (μi), the estimation irst diferences both sides of the equation and employs generalized method-of-moments (GMM) estimators, yielding the following model equation:
∆Yit= ∆Yit-1γ+ ∆xitβ+∆εit
However, (∆Yit-1γ) can still be correlated with (∆εit ). Nevertheless, the Arellano-Bond statistics report that there is neither irst-order nor second-order autocorrelation of the residuals for the estimation of the irst dependent variable. For the second dependent variable, there is irst but not second-order autocorrelation, suggesting that autocorrelation does not afect the estimation. We would reject the model if there were evidence of second-order, but not irst-order, autocorrelation (ARELLANO; BOND, 1991). In the Arellano-Bond estimation, after taking the irst diference, and lagging both the dependent variable and the endogenous explanatory variable, the number of observations decreases to 2,936 (for 810 municipalities) for the irst dependent variable and 3,689 (for 818 municipalities) for the second dependent variable. In contrast, in the random-efects and ixed-efects estimations, in which no lag of the dependent variable is included, the number of observations for the irst and second dependent variable remains 4,632 across 827 municipalities. Moreover, the Sargan test of model speciication (over-identifying restrictions) reports that the null hypothesis (H0: over-identifying restrictions are valid) cannot be rejected, indicating that our model speciication is correct.
Results
Municipal property tax collection per capita (Table 6)
As we are interested in reporting indings that are robust across the three estimations, we focus on the variables showing robust statistical signiicance and consistent direction across two models. In general, results show high level of consistency in terms of direction and statistical signiicance across the three models. Out of the three variables operationalizing the role of political support, only the coeicient on legislature (city council) support (H2) is positive and statistically signiicant at the 0.01 (random-efects), 0.01 (ixed-efects), and 0.1 (Arellano-Bond) levels. Holding everything else constant, results suggest that the greater a legislature’s partisan support for the mayor, the higher the property tax collection per capita. Therefore, H2 receives support. On the contrary, H3 receives no empirical support, as the coeicient on margin of victory fails to reach statistical signiicance.
Findings provide no support for the “government ideology” hypothesis (H4). Likewise, H5 receives no empirical support, as the coeicient on GDP per capita fails to reach statistical signiicance. Results reveal that no single one of the mayor’s background characteristics shows statistical signiicance, meaning that managerial quality does not contribute to explaining variation in property tax collection in the Brazilian municipalities of Minas Gerais for the 2005-2010 period.
is the baseline/excluded category. Also, after holding everything else constant, as a municipality increase its expenditures in a particular year, its tax property collection in the following year tends to increase, too. Moreover, although the coeicient on total grants is statistically signiicant across two models, the direction of the coeicient in inconsistent. However, if we rely on the ixed-efects estimation, which tends to be more conservative, we could say that as the amount of grants awarded to a municipality increase, its property tax collection tends to decrease, holding everything else constant. Finally, also note that the Arellano-Bond estimation, which reports estimators in irst-diference with robust standard errors, also includes a lag of the dependent variable because, as stated earlier, one year’s tax collection is expected to inluence the next year’s. Indeed, the results show that the coeicient on the lag of the dependent variable is statistically signiicant at the 0.05 level. Because the Arellano-Bond estimation includes a lag of the dependent variable as one of the independent variables, autocorrelation might be an issue. However, the Arellano-Bond statistics suggests there is neither irst nor second-order autocorrelation in the irst diference of the residuals. Lastly, the ixed-efects estimation suggests that the speciication model explains 8 percent of variation in municipal property tax collection per capita.
Property tax collection as a percentage of
total municipal revenue (Table 7)
Again, as we are interested in reporting indings that are robust across the three estimations, we focus on the variables showing robust statistical signiicance and consistent direction across two models for the second dependent variable, tax collection as a percentage of total municipal revenue. As with the irst dependent variable, results from Table 7 show high levels of consistency in terms of direction and statistical signiicance across three estimations. Out of the three variables operationalizing political support, only the coeicient on legislature (city council) support (H2) is positive and statistically signiicant at the 0.01 level for the random- and ixed-efects estimation models. Holding everything else constant, results suggest that the greater a legislature’s partisan support for the mayor, the higher the tax collection as a percentage of total revenue. That is, H2 receives support. Findings provide support for neither the “support from below” hypothesis (H3), the “government ideology” hypothesis (H4), nor for the social-economic hypothesis (H5).
In line with the results for our irst dependent variable, not one of the variables operationalizing managerial quality shows statistical signiicance, except for the coeicient on mayor’s age, which shows statistical signiicance in the random-efects (0.05 level) and ixed-efects (0.1 level) estimation. However, the size of the coeicient is very small, indicating that its impact on tax collection is minimal. Therefore, H6 fails to receive empirical support. From our ive controls, the coeicients on royalties and on the three dummies operationalizing administration cycle (irst, second, and third administration year) are statistically signiicant. Speciically, after holding everything else constant, as the amount of royalties a municipality receives increases, its property tax collection as a percentage of total tax revenue tends to decrease. In addition, results reveal that municipalities tend to collect more property tax as a percentage of total tax revenue in the irst, second, and third mayoral administration years than in the fourth year of the administration, which is the baseline/excluded category.
The ixed-efects estimation suggests that the speciication model explains almost 7 percent of variation in property tax collection as a percentage of total tax revenue. Moreover, given that the Arellano-Bond estimation includes a lag of the dependent variable as one of the independent variables, autocorrelation might be an issue. However, the Arellano-Bond statistics suggest there is irst but not second-order autocorrelation in the irst diference of the residuals.17
Discussion and conclusions
This study assesses the impact of political, economic, and managerial factors on municipal performance in terms of property tax collection. We hypothesize that not only political and socio-economic aspects but also managerial quality afect municipal property tax collection. To test our propositions, we employ six years of data (2005-2010) for 827 municipalities of the Brazilian state of Minas Gerais, covering the four years of the 2005-2008 mayoral administration and the irst two years of the 2009-2012 mayoral administration. Our key proposition, managerial quality, is operationalized as mayoral education, general experience (age), public sector experience, and job-related experience (reelection). Our study employs two diferent indicators of property tax collection: property tax collection per capita and property tax collection as a percentage of total municipal revenue. For each of these two indicators of municipal performance, we run three estimations (random-efects, ixed-efects, and Arellano-Bond) speciic to the panel data structure in order to report indings that are consistent in both statistical signiicance and direction across the models.
In general, results show high levels of consistency across the three model estimations. Contrary to our expectations, we ind no relationship between mayoral (managerial) quality and property tax collection. Evidence from the Brazilian municipalities shows that mayoral age, education, public sector experience, and job related experience (reelection), do not appear to contribute to property tax collection. These indings contrast with those of studies that ind a positive relationship between managerial quality (assessed as superintendents’ quality) and the performance of U.S. school districts (FERNÁNDEZ, 2005; MEIER; O’TOOLE JUNIOR, 2002), between managerial team quality and the performance of municipal organizations in Israel (CARMELI, 2006), and between mayoral quality and property tax collection in Colombian municipalities (AVELLANEDA, 2009b). The contradictory indings may indicate that the four proxies for mayoral quality employed in this study fail to capture other types of experience that would have a stronger efect on a mayor’s ability to devise strategies to promote tax collection. For instance, whether the mayor has private sector experience may be more relevant in explaining variance in tax collection. Unfortunately, data on mayors’ private sector experience were not available.
Contrary to the indings of studies focused on the developed world, government ideology in Brazil is unrelated to property tax collection. We suggest three interpretations for this inding. First, context matters; therefore, propositions developed in the developed world may not apply in developing settings. Second, Brazilians’ weak party ideology and low party discipline (AMES, 2001a; MAINWARING, 1991, 1999; KINZO, 2003) leads to party switching (DESPOSATO, 2006) and weakness of political institutions. Third, the relatively large number of political parties and movements makes politics more personalistic than issue-oriented.
Results provide support for the lying paper efect (HINES; THALER, 1995), as municipalities that receive more grants and royalties tend to collect lower property tax. In other words, results suggest that Brazilian municipalities are discouraged from enforcing property tax collection when they are awarded with additional monies. Future studies should further explore the efect of grants and royalties on municipal performance operationalized across other dimensions.
Findings also provide strong evidence that municipalities collect more property tax during irst, second, and third mayoral administration years than during the last year of mayoral administration, which is the election year. This inding is in line with the expectation that during election years, politicians either fail to enforce tax collection or grant tax cuts in order to gain political support for their campaigns or their parties in the upcoming elections.
Finally, this analysis of Brazilian municipalities adds to the few empirical studies assessing the impact of mayoral quality on local inances in a Latin American setting. By focusing on the mayor, this study blends politics and public management because in Brazil, as in most developing settings, the local political leader and the municipal manager are one and the same. The “strong, elected mayor” is the most common form of local government in Latin American countries. The implications of this study, however, point to the signiicance of both legislative partisan support and the electoral cycle in explaining variance in property tax collection. Although the indings of this study appear to undermine the role of mayoral quality on municipal performance, more studies are needed in which mayoral quality can be operationalized more directly, for example in terms of networking, innovation, and including citizens in the decision-making process.
References
ABRUCIO, F. L. Osbarõesdafederação: o poder dos governadores no Brasil pós-autoritário. São Paulo: Universidade de São Paulo, 1998.
AGRANOFF, R.; MCGUIRE, M. Multinetwork management: collaboration and the hollow state in local economic policy. JournalofPublicAdministrationResearch andTheory, v. 8, n. 1, p. 67-91, 1998.
AMES, B. ThedeadlockofdemocracyinBrazil. Ann Arbor: University of Michigan Press, 2001a.
AMES, B. Party discipline in Brazil’s chamber of deputies. In: MORGENSTERN, S.; NACIF, B. (Ed.). LegislativepoliticsinLatinAmerica. New York: Cambridge University Press, 2011b.
ANDERSON, K. What motivates municipal governments? Uncovering the institutional incentives for municipal governance of forest resources in Bolivia. Journal of Environment & Development, v. 12, n. 1, p. 5-27, 2003.
ALT, J. E.; LOWRY, R. C. Divided government, iscal institutions and budget deicits.
AmericanPoliticalScienceReview, v. 88, n. 4, p. 811-828, 1994.
AVELLANEDA, C. N. Municipal performance: does mayoral quality matter? Journal of
PublicAdministrationResearchandTheory, v. 19, n. 2, p. 285-312, 2009a. AVELLANEDA, C. N. Mayoral quality and local public inance. PublicAdministration Review, May/June, p. 469-486, 2009b.
ARELLANO, M.; BOND, S. Some tests of speciication for panel data: Monte Carlo evidence and an application to employment equations. TheReviewofEconomic Studies, v. 58, p. 277-297, 1991.
BOYNE, G. A. Sources of public service improvement: a critical review and research agenda. JournalofPublicAdministrationResearchandTheory, v. 13, n. 3,
p. 367-394, 2003.
BOYNE, G. A. Explaining public service performance: does management matter?
PublicPolicyandAdministration, v. 19, n. 4, p. 110-117, 2004.
BERGMAN, M. TaxevasionandtheruleoflawinLatinAmerica: the political culture of cheating and compliance in Argentina and Chile. University Park, Pa: Pennsylvania State University Press, 2009.
BLAIR, H. Participation and accountability at the periphery: democratic local governance in six countries. WorldDevelopment, v. 28, p. 21-39, 2000. BUCHANAN, J.; TULLOCK, G. Thecalculusofconsent, logicalfoundationsof constitutionaldemocracy. Ann Arbor, MI: University of Michigan Press, 1962. CAREY, J. M.; REINHARDT, G. Y. Coalitionbrokersorbreakers? Brazilian governors and legislative voting. Working Paper. St. Louis: Washington University, 2001. CARMELI, A. The managerial skills of the top management team and the performance of municipal organizations. LocalGovernmentStudies, v. 32, n. 2, p. 153-176, 2006.
CARREIRÃO, Y. Ideologia e partidos políticos: um estudo sobre coligações em Santa Catarina. OpiniãoPública, v. 12, n. 1, p. 136-63, 2006.
CLINGERMAYER, J. C.; WOOD, B. D. Disentangling patterns of state debt inancing.
AmericanPoliticalScienceReview, v. 89, n. 1, p. 108-120, 1995.
COHEN, S. Theefectivepublicmanager: achieving success in government. San Francisco, CA: Jossey-Bass, 1988.
COHEN, S.; EIMICKE, W. Thenewefectivepublicmanager. San Francisco, CA: Jossey-Bass Publishers, 1995.
COSTA, V. L. C. DescentralizaçãodeeducaçãonoBrasil: as reformas recentes no Ensino Fundamental. Paper presented at the Latin American Studies Meeting, Chicago, 1998.
DESPOSATO, S. W. Parties for rent? Ambition, ideology, and party switching in Brazil’s Chamber of Deputies. American Journal of Political Science, v. 50, n. 1, p. 62-80, 2006.
DOIG, J. W.; HARGROVE, E. C. Leadershipandinnovation: a biographical perspective on entrepreneurs in government. Baltimore, MD: Johns Hopkins University Press, 1987.
DOIG, J. W.; HARGROVE, E. C. Leadershipandinnovation: entrepreneurs in government. Baltimore, MD: Johns Hopkins University Press, 1990.
DOMINGOS, O. P. Implementing local property tax. LandLines, p. 1-8, January 2011. DURANT, R.; LEGGE, J. S. Policy design, social regulation and theory building: lessons from the traic safety policy arena. PoliticalResearchQuarterly, v. 46, p. 641-56, 1993.
ELLICKSON, M. C. Pathways to legislative success: a path analytic study of the Missouri house of representatives. LegislativeStudiesQuarterly, v. 17, p. 285-302, 1992.
FERNÁNDEZ, S. Developing and testing an integrative framework of public sector leadership. JournalofPublicAdministrationResearchandTheory, v. 15,
p. 197-217, 2005.
GIBSON, C. C.; LEHOUCQ, F. E. The local politics of decentralized environmental policy in Guatemala. Journal of Environment & Development, v. 12, n. 1,
GRINDLE, M. S. Gettinggoodgovernment:capacitybuildinginthepublicsectorsof developingcountries. Boston, MA: Harvard University Press, 1997.
GRINDLE, M. S. Audaciousreforms:institutionalinventionanddemocracyinLatin
America. Baltimore, MD: Johns Hopkins, 2000.
GRINDLE, M. S. Goinglocal:decentralization,democratization,andthepromiseof goodgovernance. Princeton University Press, 2009.
HAASS, R. N. Thepowertopersuade. New York: Houghton Milin Company, 1994. HINES, J. R.; THALER, R. H. The lypaper efect. Journal of Economic Perspectives, v. 9, n. 4, p. 217-226, 1995.
HOLBROOK, T. M.; VAN DUNK, E. Electoral competition in the American states.
AmericanPoliticalScienceReview, v. 87, n. 4, p. 955-962, 1993.
IBGE. CensoDemográico2010. Rio de Janeiro: Instituto Brasileiro de Geograia e Estatística, 2010.
IBGE. PesquisadeInformaçõesBásicasMunicipais. Gestão Pública 2001. Rio de Janeiro: Instituto Brasileiro de Geograia e Estatística, 2001.
IBGE. PesquisadeInformaçõesBásicasMunicipais. Gestão Pública 2002. Rio de Janeiro: Instituto Brasileiro de Geograia e Estatística, 2002.
IBGE. ProdutoInternoBrutodosMunicípios. Rio de Janeiro: Instituto Brasileiro de Geograia e Estatística, 2004. (Relatórios Metodológicos, v. 29).
KINZO, M. D. A. G. Consolidation of democracy: governability and political parties in Brazil. In: KINZO, M. D. A. G. (Ed.). Brazil: the challenges of the 1990s. London: British Academic Press, 1993. p. 138-154.
KINZO, M. D. A. G. Parties and elections: Brazil’s democratic experience since 1985. In: KINZO, M. D. A. G.; DUNKERLEY, J. (Ed.). Brazilsince1985: economy, polity and society. University of London: Institute of Latin American Studies, 2003. KONTOPOULOS, Y.; PEROTTI, R. Fragmented Fiscal Policy. Columbia University
Mimeo, 1997.
KUBR, M.; WALLACE, J. Successesandfailuresinmeetingthemanagement challenge: strategies and their implementation. Washington, DC: The World Bank, 1984.
LEWIS-BECK, M. S.; ALFORD, J. R. Can government regulate safety? The coal mine example. AmericanPoliticalScienceReview, v. 74, n. 3, p. 745-56, 1980.
LINEBERRY, R. L. Equality, public policy and public services: the underclass hypothesis and the limits to equality. PolicyandPolitics, v. 4, p. 67-84, 1976. LITSCHIG, S.; MORRISON, K. Electoralefectsofiscaltransfers:
quasi-experimental evidence from local executive elections in Brazil, 1982-1988. Working paper. 2009.
LYNN JUNIOR, L. E. Managingthepublic’sbusiness: the job of the government executive. New York: Basic Books, Inc., Publishers, 1981.
LYNN JUNIOR, L. E. Managingpublicpolicy. Boston: Little, Brown and Company, 1987.
LYNN JUNIOR, L. E. Publicmanagementonart,scienceandprofession. Chatham, NJ: Chatham House, 1996.