Population transitions and temperature
change in Minas Gerais, Brazil:
a multidimensional approach
*Alisson F. Barbieri**
Gilvan R. Guedes***
Kenya Noronha****
Bernardo L. Queiroz*****
Edson P. Domingues******
José Irineu R. Rigotti*******
Glaucia P. da Motta********
Flavia Chein*********
Francisco Cortezzi**********
Ulisses E. Confalonieri***********
Kenia de Souza************
Climate change will exacerbate the vulnerability of places and people around the world in the next decades, especially in less developed regions. In this paper, we investigate future scenarios of population vulnerability to climate change for the next 30 years in 66 regions of the state of Minas Gerais, Brazil. Based upon the Alkire & Foster Index, we integrate simulated and projected dimensions of population vulnerability into a Multidimensional Index, showing how scenarios of temperature change would afect each region’s relative vulnerability in the future. Results suggest that economic and health dimensions are the highest contributors to increases in temperature-related vulnerability, with the poorest and agribusiness regions being the most impacted in decades to come.
Keywords: Climate change. Population vulnerability. Population transitions. Multidimensional index. Minas Gerais.
* Funding for this research was provided by Fundação de Amparo à Pesquisa do Estado de Minas Gerais (Fapemig), grant number PPM-00125-14.
** Faculdade de Ciências Econômicas, Universidade Federal de Minas Gerais (UFMG), Belo Horizonte-MG, Brasil (barbieri@ cedeplar.ufmg.br).
*** Faculdade de Ciências Econômicas, Universidade Federal de Minas Gerais (UFMG), Belo Horizonte-MG, Brasil (grguedes@ cedeplar.ufmg.br).
****Faculdade de Ciências Econômicas, Universidade Federal de Minas Gerais (UFMG), Belo Horizonte-MG, Brasil (knoronha@ cedeplar.ufmg.br).
***** Faculdade de Ciências Econômicas, Universidade Federal de Minas Gerais (UFMG), Belo Horizonte-MG, Brasil (lanza@ cedeplar.ufmg.br).
****** Faculdade de Ciências Econômicas, Universidade Federal de Minas Gerais (UFMG), Belo Horizonte-MG, Brasil (epdomin@ cedeplar.ufmg.br).
******* Faculdade de Ciências Econômicas, Universidade Federal de Minas Gerais (UFMG), Belo Horizonte-MG, Brasil (rigotti@ cedeplar.ufmg.br).
******** Faculdade de Ciências Econômicas, Universidade Federal de Minas Gerais (UFMG), Belo Horizonte-MG, Brasil (glaucia. [email protected]).
********* Faculdade de Economia, Universidade Federal de Juiz de Fora (UFJF), Juiz de Fora-MG, Brasil ([email protected]). ********** Departamento de Geograia, Université Paris IV – Sorbonne, Paris, França ([email protected]).
*********** Fundação Oswaldo Cruz (Fiocruz), Rio de Janeiro-RJ, Brasil.([email protected]).
Introduction
Research shows that climate change will exacerbate the vulnerability of places and people around the world in the next decades, with a disproportionate impact on less developed regions (VÖRÖSMARTY et al., 2000; FIELD et al., 2011), coastal cities, and flood plain areas (McGRANAHAN et al., 2007). Not surprisingly, poor people – especially those residing in rural areas – and localities or regions with weaker social and physical equipment will carry most of the burden associated with climate change, regardless of geographical and geological place-speciic attributes (KURIAKOSE et al., 2013).
In response to the range and damage potential associated with climate shocks, institutions like the United Nations (through the One-UN Social Protection Floor Initiative) and World Bank (through the Social Protection and Labour strategy) have proposed to tackle the negative efects of these changes by means of Social Protection (SP) programmes. Mirroring the structure of inclusive development and economic resilience to inancial crises (WORLD BANK, 2008), the SP framework advocates that “countries that have SP systems in place before a shock hits are better able to launch a more immediate and efective response when such events occur” (KURIAKOSE et al., 2013, p. 20). The explanation is quite simple, but powerful: impoverished areas usually have overlapping vulnerabilities, disproportionately increasing their susceptibility to permanent loss of well-being (FÜSSEL; KLEIN, 2006). For instance, the rural population is more reliant on climate-dependent economic activities, while the urban poor are usually pushed to live in marginal urban areas, where costs are low and geological risks are greater (WILSON et al., 2008). Because they live on the edge of minimum living standards, any additional shock can trigger a sequence of capital depletion, afecting their livelihoods and preventing them from recovering from a lack of investment capacity in the long run (VANWEY et al., 2012).
Kuriakose et al. (2013) state that by promoting social protection initiatives, a given place can position its population to have increased resilience to climate shocks. These initiatives, such as cash transfer programs, a universal pension system, free basic education, and low-cost health systems, have an a priori cushioning efect, absorbing part of the shock (resilience), while a posteriori initiatives, such as infrastructure rebuilding and post-shock aids for the most in need would promote equity. More structural investment eforts in education and health would empower individuals to permanently adapt to inevitable future and uncertain shocks in the long run, reducing risk by promoting individual capabilities (opportunities).
attached to hazardous activities. This social ampliication of risks influences the economic profitability and employment potential of environmentally related economic activities (PIDGEON et al., 2003). Therefore, the globalization of news related to the environment adds another layer to the local impact of global environmental change.
More and more, risk estimation and climate-related human and material losses are mediated by diferences between perceived and objective risk (SLOVIC, 2000). This environmental risk gap is partially explained by the inability of individuals to rationally account for uncertain risk gradients that pose an additional challenge to precise predictions of when, where, and how (HALLEGATTE, 2009). Under this new scenario of increasing uncertainty related to climate shocks and variability, the promotion of social resilience and adaptation is critical.
One of the basic recommendations of the World Bank and the UN is to target places and populations that are vulnerable to climate impacts with a maximum level of precision and information. Reliable, meaningful, and synthetic measures of vulnerability have been developed recently (BOURGUIGON; CHAKRAVARTY, 2003; DEUTSCH; SILBER, 2005; ALKIRE; FOSTER, 2011), but most of them have been applied to economic studies not directly related to climate shocks. The literature on vulnerability to environmental change suggests that some dimensions are key for targeting purposes: health, economy, population processes, governance, and social protection (HELTBERG et al., 2009; KURIAKOSE et al., 2013). In this regard, axiomatic multidimensional measures seem an appropriate choice, especially those accounting for both the level and intensity of deprivation (ALKIRE; FOSTER, 2011). In addition, because of the difuse impact of climate variability and change on the economy in the short term (and on population components in the long run), systems-like modelling approaches are necessary to correctly tackle direct and indirect efects of changes in climate indicators on the population over time.
Taking advantage of the socioeconomic, institutional, demographic, and biotic heterogeneity of the state of Minas Gerais in Brazil, this paper investigates potential scenarios of population vulnerability to climate change in all of the 66 microregions of the state for the period 2010-40. Following an original conceptual and methodological strategy proposed in Barbieri et al. (2010), we irst investigate the multidimensional nature of population vulnerability to climate change through four critical dimensions – demographics, economics, health, and institutions – and their evolution over time. Ultimately, we estimate a Multidimensional Index of Scenarios of Population Vulnerability, based on the Alkire and Foster (AF) methodology (ALKIRE; FOSTER, 2011), in order to evaluate the contribution of each dimension to overall vulnerability before and ater projected temperature changes.
of regions experiencing greater health and economic sensitivity to climate shocks. It should be noted that we use past and future temperature as the sole proxy for climate change. This methodological option will reflect the clustering of impacted regions where temperature-dependent activities are concentrated, as in less urbanized or agriculture-oriented regions. Other climate change markers, such as floods, droughts, and landslides could provide better insights on vulnerability to climate change where urbanization is more intense. Data availability for such markers and the inability to project disasters, however, led our analysis to focus on temperature change only. Despite its limitations in addressing overall spatial vulnerability to climate events, our empirical exercise sheds light on how not only vulnerability, but also climate change is a multidimensional concept that may render diferent expected impacts depending on how it is proxied and where it happens. We conclude the study by discussing the challenges that policymakers must face in terms of fostering an adaptive capacity in following decades.
The next section discusses population transitions in Brazil and their connection to climate-related vulnerability. Next, we describe the geographic area of this study. This is followed by a discussion of how each of the four dimensions of population vulnerability was modelled. Finally, we conclude by presenting scenarios of population vulnerability to climate shock, integrating the results into a synthetic measure.
Population transitions and vulnerability to climate change
The concept of “vulnerability” in this paper refers, in a narrow sense, to the lack of capacity of a given population to prevent, mitigate, or attenuate adverse consequences caused by exposition to hazards, and its relative lack of capacity to respond to them (CUTTER, 1996). Confalonieri and Barata (2011) also discuss this concept based upon the idea that “vulnerability” corresponds to the way in which a given population is exposed to a hazard, its sensitivity, and its response to this hazard. In this sense, the “hazard” results from a combination of three attributes of the population: exposition, sensitivity, and adaptive capacity.
Since vulnerability levels and intensity are determined by several factors (such as economic, demographic, health, and institutional issues), we deine a multidimensional perspective that identiies and combines various relevant elements to explain future vulnerability scenarios under diferent climate shocks. We frame this discussion in terms of how the unfolding demographic, urban, and health transitions, and their association with stages of socioeconomic development in Brazil may create future vulnerabilities, or reproduce and amplify existing ones.
the transformation of an agrarian society into one wherein services and industry constitute the core of the productive sector. In this regard, each stage of modernization is linked to structural transformations in demographic, epidemiologic and spatial features which are themselves related, in speciic ways, to modiications in the environment.
In this regard, the demographic transition aims to characterize the implications of changes in vital events – mortality and fertility – on population growth, size, and age structure. An agrarian society evolves from a low population growth characterized by homeostatic equilibrium (with high mortality and fertility) to a modern, post-industrial society, again characterized by low growth and homeostatic equilibrium (however, with low fertility and mortality levels). Rapid population growth occurs between these two extremes when mortality decreases at a pace faster than fertility (LEE, 2003, 2011).
In addition to population growth, the demographic transition has two other dramatic features: the concentration of population in urban areas, as predicted by modernization theories, and population aging. Indeed, the inal stage of the demographic transition implies below-replacement fertility linked to a predominantly older and urban population (LEE, 2003, 2011).
The steady reduction of Total Fertility Rates (TFR) in Brazil during coming decades will not only reduce population growth, but will also produce an older age structure and transformations in the country’s spatial makeup, as urban concentration continues. Population aging will increase substantially around 2030, challenging the public funds that cover costs of pension beneits and health demands (QUEIROZ; TURRA, 2010). This scenario does not difer from that in our study site.
It is also expected that increasing population mobility in the next decades will continue to favour growth in urban centres, particularly in larger metropolitan areas. Modernization implicitly brings a process of labour reallocation from low-productivity (rural) to high-productivity (urban-based) sectors facilitated by the spread of more eicient communication and transportation systems, as well as by labour allocation to infrastructure development (roads, damns, etc.). The profound transformations in rural and urban spaces are thus a major driver of increasing mobility and urban concentration as development unfolds. In this regard, according to his Theory of Mobility Transition, Zelinsky (1971) suggests that the advancement of socioeconomic development will be related to an increasingly complex mobility pattern, fostering a more intense and complex process of urban occupation.1 This
will demand an adaptive capacity, which translates into heavy investments in adequate urban planning and infrastructure, such as housing quality, water and sanitation access, and institutional arrangements that include the elaboration of municipal contingency plans and Civil Defence Coordination.
Overall, we hypothesize that the combination of population ageing, with its implication for public health and pension systems, coupled with the lack of infrastructure in urban areas may result in the reproduction, persistence or ampliication of vulnerability in the future. This incomplete urban transition is particularly challenging when additional pressures from a changing environment that require larger public budgeting for infrastructure preparedness come into play. We also speculate that other factors may increase resilience and promote an adaptive capacity when faced with future scenarios of climate change, such as higher levels of formal education, increased coverage of public transfers to the most in need, and basic infrastructure expansion. Education, in particular, increases resilience to climate change through a variety of underlying mechanisms, such as by improving individuals’ willingness to adopt climate robust technological innovations (DERESSA et al., 2009; DESSAI; HULME, 2007). A key assumption regarding population transitions is that they will be engendered by the advancement of the “modernization process” and the achievement of an overall increase in societal welfare levels and inequality reduction. In the Brazilian case, a potential contradiction may arise. Diferent from developed countries, population aging here has not been suicient to trigger a complete epidemiological transition. The country experiences an increasing prevalence of chronic diseases, while still facing high rates of communicable diseases, such as dengue, malaria, cholera, and schistosomiasis (OMRAN, 2005). This dual burden implies that the advancement of the demographic transition has not been coupled with the necessary investments to reduce historical poverty, inequality, and a lack of access to water and sanitation by a large share of the population (PRATA, 1992; SCHRAMM et al., 2004).
The incomplete epidemiological transition in Brazil may represent an additional source of stress as climate change comes into play, since it works as a force that holds back the transition of a population still afected by infectious diseases. Vulnerability can increase even further as rural-urban migration, induced by climate-related efects on agro-pastoral areas, translates into the growth of shantytowns characterized by poor sanitation and poverty. The opposite can hold as well. Barbieri et al. (2010) show that out-migration from the Northeast of Brazil will likely increase with climate change, reflecting increased flows of environmental refugees. In this case, as suggested by Tacoli (2009), environmentally-related out-migration could decrease vulnerability as people move out from environmentally affected areas. The persistence of old vulnerabilities may thus interact with future vulnerabilities associated with the population characteristics emerging from incomplete demographic, mobility, urban, and epidemiological transitions.
Study area: the state of Minas Gerais, Brazil
Minas Gerais is a good example of how inequality and heterogeneity of adaptive capacity can pose important challenges in dealing with vulnerability to climate change. The state comprises 853 municipalities, organized into 66 administrative units known as “microregions” (hereater named “regions” for the sake of simplicity), and hosts four distinct biomes: Caatinga (a semi-arid biome), Campo Rupestre de Altitute (high altitude grasslands), Cerrado (a Savannah-like vegetation), and the Atlantic Forest (tropical forest). This biotic heterogeneity is unique in Brazil. Figure 1 shows a map of Minas Gerais indicating its administrative divisions and biomes.2
Minas Gerais has historically been one of the most important states in Brazil in both economic and demographic aspects. In 2010, it was ranked second in population among the 26 Brazilian States (19,5595,309 inhabitants), third in Gross Domestic Product (accounting for 10% of the Brazilian GDP), and fourth in area (586,528 Square Kilometres). The state capital is Belo Horizonte, with 2,357,444 inhabitants.
The choice of Minas Gerais for this study is deliberate. Like Brazil, the state is characterized by large socioeconomic and regional inequalities. On the one hand, the North and Northeast regions of the state are the poorest areas, showing indicators equivalent to African standards. On the other, the South and East host a more dynamic economy, with
high levels of educational and health indicators. This context provides us with interesting possibilities in testing the impacts of climate change within diverse socioeconomic, demographic, and environmental scenarios.
FIGURE 1
Municipalities, regions, and their biomes State of Minas Gerais
Source: Instituto Brasileiro de Geograia e Estatística – IBGE; Centro de Desenvolvimento e Planejamento Regional – Cedeplar, Universidade Federal de Minas Gerais – UFMG.
Temperature change in Minas Gerais
We use historical and projected data on the average annual temperature as a proxy for climate change. Data comes from IPCC’s A1B1 scenario, a regional ETA model, that contains average annual temperatures for South America in grids of 40 km X 40 km. Data were built from the global HadCM3 model, containing temperature values at two meters in the area delimited by the following co-ordinates: LAT N = 5,0o, LAT S = -35,0o, LON E =
We used two time slices in the ETA model: 1960-90 and 2010-40, and estimated annual temperatures in K (Kelvin).3 Thus, we created a dataset with annual temperature
estimates for each municipality in Brazil, particularly in the state of Minas Gerais, using an imputation of the average temperature in the points with the municipality area or, when this municipality did not have any point in its territory, the point closest to its centroid. Figure 2 shows the distribution of the average temperature across municipalities in Minas Gerais in two periods (1960-90 and 2010-40) and the diference between the maximum and minimum temperatures observed between 2010 and 2040 for each municipality. The Northwest and West regions (Triângulo Mineiro) host municipalities with the highest average temperatures and the highest amplitudes. We observe an overall temperature increase state-wise, as assumed by the A1B1 scenario.
FIGURE 2
Average temperature in Kelvin (1960-1990 and 2010-2040) and average range (2010-2040) State of Minas Gerais
Average Temperature
< 291.2
291.2 to 292.7
292.7 to 293.8
293.8 to 295.3
> 295.3
1960 to 1990 2010 to 2040
2010 to 2040
Max - Min
1.9 to 2.2
2.2 to 2.4
2.4 to 2.6
2.6 to 2.8
2.8 to 3.2 5 6 0 2 8 0 0 5 6 0K m
Source: Historical and Projected Climate Data. Centro de Previsão do Tempo e Estudos Climáticos/Instituto Nacional de Pesquisas Espaciais – CPTEC/Inpe.
Economic dimension
Because of the difuse and system-like impact of climate change on the economy, we use a computable general equilibrium model to isolate the direct impacts of a temperature increase from 2010 to 2040 on selected economic indicators. We irst estimate the influence of a change in the temperature on the labour supply and agricultural productivity. Two scenarios were deined: the baseline scenario (without considering climate impacts) and the A1B1 scenario. The baseline scenario is deined as considering the average historical temperatures recorded between 1960 and 1990. The A1B1 scenario considers projections of temperature for the following years: 2010, 2015, 2020, 2025, 2035, and 2040.
Household consumption, GRP (Gross Regional Product), and employment are endogenous variables estimated by a computable general equilibrium (CGE) model called IMAGEM-MG (Integrated MultiRegional General Equilibrium Model for Minas Gerais). The IMAGEM-MG was calibrated for 2005, in accordance with the sector industry and product commodity classiications in IBGE’s (Brazilian Statistical Bureau) input-output matrix.4 The
recursive dynamics mechanisms allow us to make explicitly temporal use of the CGE model, wherein the endogenous variables are adjusted throughout the analysed period, ater an initial shock or series of shocks.
Climate change’s impact on agricultural output is the diference between the expected agricultural output per hectare, considering the historical climate conditions and the expected agricultural output per hectare in the new climate conditions. The average climate change impacts on agricultural productivity in each region of Minas Gerais were considered as productivity shocks in a general equilibrium model. The model considers workers who migrate from the most afected regions to the least afected regions, guided by real wage diferentials (equation 1). These real wage diferentials come from the model of impacts of climate change on the economy. Inter-regional labour migration or labour supply percentage change (ld) adjusts due to the diference between regional real wage (wd) and national real
wage (w), calculated from 2010 Brazilian Demographic Census data. The elasticity parameter (σd) measures the labour supply response to real wage diferentials.
ld = σd (wd - w) ( 1 )
Our simulations are based on the assumption that all municipalities face the same capital return and do not present systematic technological diferences. Another underlying assumption is the absence of technological responses to the new climate conditions. The results are predicted using the imputation of climate forecasts on the current technological status in agriculture.
A c cording to our results, on average, there is no sizeable impact on the economic
factors. However, the analysis by region shows important results. The most important regional economic impact is related to agriculture and labour shocks, but also depends on the economic structure and inter-regional linkages. The 20 most impacted regions in terms of percentage change in GRP and employment are, in general, regions with weak economic activities, concentrated in the Northern part of the state (one of its poorer regions). The exceptions are Uberlandia and Uberaba (accounting for almost 12% of the state’s economic production). These regions are part of the “Triângulo Mineiro” (together with Ituiutaba and Frutal). They are located in the west of the state and are signiicant cattle and agriculture producers that also serve as the most important terrestrial transportation hubs in the country. Although these 20 regions account for 84% of the total GRP losses in the state, they represent only 21% of the economy. It is worth observing that in the two most afected regions, Januária and Unaí, their share on climate change impact is almost 20 times their share on the economy. This indicates that some small regions in the state are the most vulnerable to climate change impacts. The Southern part of the state is more industrialized and less dependent on agriculture, thus showing lesser economic vulnerability.
Health dimension
In order to evaluate the relationship between climate change and health, reliable time series on both health and climate would be required. Due to data limitations on changes in health over time, we estimate the impact of temperature change using a semilog OLS (Ordinary Least Squares) regression on cross-section data considering the 5,563 Brazilian municipalities identiied in the administrative political division of 2010.
To simulate the average health of the population, diferent indicators were used as dependent variables in our models (prevalence of leptospirosis, rate of hospitalization for childhood diarrhea, rate of hospitalization for cardiovascular diseases, rate of hospitalization for respiratory diseases, rate of hospitalization for infectious diseases, and prevalence of dengue). Only three, however, showed statistically signiicant relationships with temperature (p-value>0.001): prevalence of dengue (BRASIL, 2005-2010a), rate of hospitalization for infectious diseases (BRASIL, 2005-2010b), and rate of hospitalization for respiratory diseases (BRASIL, 2005-2010b). Since the prevalence of health events is low, especially in small areas, all indicators were calculated considering the average of events from 2005 to 2010.
(IBGE, 2010), and dummy variables for each geographic region of Brazil (North, Northeast, South, Southeast, and Centre West).
Based on the regression results, we estimated the predicted average morbidity rates by each region of Minas Gerais for the base year (2010). Diferent from the economic dimension, all betas (parameters) estimated, as well as the levels of independent variables, were held constant from 2010 to 2040, including the average temperature. This represents our baseline scenario, where all levels and efects are held constant throughout the 30-year window. To simulate a climate shock and isolate its efect from concurrent ones, we estimate counterfactual average morbidity rates by replacing the average historical temperatures with the projections of temperature. The other control variables and estimated parameters were held constant.
Our results suggest that a temperature change from 2010 to 2040 could increase the morbidity rates by a considerable amount (Table 1). For example, if we compare the rate of dengue in the baseline scenario of 0.5 to the same rate ater the temperature change in the same year (2040), this rate would increase to 1.1. This is a 130% increase due to the change in temperature alone. The hospitalization rates for infectious and respiratory diseases could increase by 12% and 3%, respectively, for the same year. If we had taken into account precipitation patterns in our analyses, the combined (individual plus interactive) impact of both climate change proxies would likely have been more pronounced. Even in the absence of precipitation data (due to a lack of information available at the time of our analysis), the sole impact of temperature change on dengue is remarkable.5 The higher
increase in the rate of dengue due to the change in the temperature is related to the higher efect (coeicient) estimated by the econometric model especially compared to the other two health indicators. While the estimated efect of temperature on the rate of dengue is equal to 0.30, its efect on rates of hospitalization for infectious and respiratory diseases is equal to 0.06 and 0.02, respectively. In addition, the variance of projected temperature by year across municipalities is higher for 2020 and 2040, the last two periods considered.
The largest temperature impact is estimated to be in dengue prevalence, followed by infectious diseases. The increase in dengue and infectious diseases is mostly concentrated in the west and northwest portions of the state. These are areas with the highest registered and projected temperatures (as suggested by Figure 2), and hold a strong spatial overlapping pattern with the climate related economic impacts. If health had been considered in the economic model, it is likely that the efect of climate change on economic indicators would have been even stronger, since these areas are also the ones with the highest loss in GRP. Similarly, if the impact of the climate on economic indicators had been mapped for the
h e a lth model, we would probably have captured an even stronger climate-related efect
on morbidity rates.
TABLE 1
Base and impact scenarios of indicators in the health dimension State of Minas Gerais – 2010-2040
Scenarios
Indicators Average prevalence rate
of dengue (per 1,000 inhabs.)
Average prevalence rate of respiratory diseases
(per 1,000 inhabs.)
Average prevalence rate of infectious diseases
(per 1,000 inhabs.)
Base scenario
2010 0.5 7.0 3.9
2020 0.5 7.0 3.9
2030 0.5 7.0 3.9
2040 0.5 7.0 3.9
Impact scenario (A1B1)
2010 0.7 7.1 4.0
2020 0.8 7.2 4.1
2030 1.1 7.2 4.3
2040 1.2 7.3 4.3
Source: IBGE (Demographic Census 2010); Brazil/Ministério da Saúde (SIH/SUS, 2005-2010b); Centro de Previsão do Tempo e Estudos Climáticos/Instituto Nacional de Pesquisas Espaciais – CPTEC/Inpe.
Note: Authors’ calculations based on secondary data sources.
Demographic dimension
The demographic dimension encompasses three components over time: age composition (0 to 14, 15 to 64, and 65 or more years old), households with access to proper sanitation, and expected years of education. We used the Demographic (Total) Dependency Ratio as a synthetic indicator of age structure. This refers to the ratio between the population below 15 years old plus the population above 64 years old, divided by the population between 15 and 64 years old. Population scenarios for 2010-40 and by age group for Brazilian states were elaborated from a standard population projection method known as the cohort component method (and assuming 2010 as the baseline). We used data from previous Brazilian population censuses (1970, 1980, 1991, 2000, and 2010), recent National Household Surveys (PNAD, IBGE 2000-08), and birth and death statistics since 1980. Population estimates were disaggregated by regions using a combination of two population projection methods for small areas: the Apportionment Method, and the Method of Cohort Relations (DUCHESNE, 1989).6
The indicator “Expected Years of Education” refers to the mean number of years of education that a cohort of children will attain until a certain age. The indicator was built
upon data on school attendance per year of education and by age (both from the 2010
Brazilian Census). We irst estimated the mean years of study weighted by the population at each age (7 to 18 years old), which corresponds to the 12-year period of basic education in Brazil. Ideally, each cohort of single ages should contribute with one year of education at each calendar year, when the successive sum of the contribution of each cohort would represent the total expected years of education until that age. Formally:
∑
= = 12 1 , i x i x x i x Pop Pop A A( 2 )
where:
x
A = average years of education of a cohort of age x;
Ai,x= year of education i attended by a student of age x, considering i = 1, 2, … , 12; i
x
Pop = population of age x attending the year of education i;
Popx = population of age x.
The ratio between Ax and the years of education relative to that age Ax represents the
contribution of the cohort to the expected educational attainment at the end of the period of basic education in Brazil. This ratio would equal one when each student enters the educational system at the correct age, she/he does not fail a given year, and does not leave school. Thus, the sum of the ratios corresponding to each age x represents the expected years of education of a synthetic cohort:
∑
= = 18 7 0 x x x A A A ( 3 )To project the number of expected years from 2010 to 2040 for each region, we use the average linear growth rate per age from the modal age contribution to the expected education to the lowest age contribution. This average growth rate was multiplied by ive (for each ive years of the projection), and equation (3) was re-calculated, conditioned on the restriction that it must reach a maximum of 12 years of expected education sometime in the future. Imagine that, at age 12, a student contributes to, on average, 0.9 years until she completes 13 years of age. Assume that another student, with eight years of age, contributes to only 0.6 years of education until she is nine years old. Thus, if we assume a linear growth rate, the educational level should grow by 0.06 for each single age between age eight and 12. Thus, ive years from now, an eight year old student should be contributing to 0.6 + 0.06*5 = 0.9 years of education. Ater a couple more years, a typical eight year old student would achieve one year of expected education from eight to nine years of age, reaching the maximum contribution allowed by a single-age synthetic cohort (RIGOTTI et al., 2013).
Our estimates do not take into account feedbacks between demographic factors and potential climate impacts. In order to project the demographic indicators, we make two assumptions: a) that there are no signiicant mortality or migration shocks from climate change which could substantially influence population stock and composition by age; and b) that the expansion of sanitation services and educational attainment follow a trajectory independent from climate scenarios. Both assumptions seem reasonable since our time window is relatively short for observing signiicant changes in fertility patterns and sanitation policies. Mortality could theoretically be impacted by temperature change, even in a short time window, and this would make our irst assumption somewhat fragile. However, our regression estimates of temperature change on mortality indicators show no signiicant efect when historical data are used.7
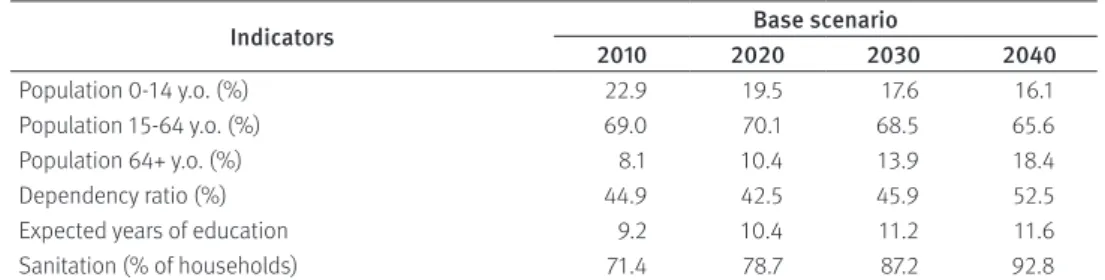
Table 2 shows estimates of demographic components over the period 2010-2040. Population projections reflect the advancement of the demographic transition, with below replacement fertility contributing to an increasing proportion of the population over 64 years of age (from 8.1% in 2010 to 18.4% in 2040). The Total Dependency Ratio decreases from 44.9% in 2010 to 42.5% in 2020, reflecting the relative increase of the active population. From 2030 on, the ratio starts to increase due to population aging.
While an older age structure represents a potentially higher vulnerability to climate shocks, more expected years of education (from 9.2 in 2010 to 11.7 in 2040) might increase the adaptive capacity of the population. Furthermore, our results show that the percentage of households receiving basic sanitation services in Minas Gerais will increase from 75% in 2010 to 92% in 2040, minimizing a potential spread of sanitation-related diseases under temperature stress. However, we still observe strong regional diferences: regions located in the Northern part of the state have lower coverage and slower coverage growth rates than in more developed regions from the Southern parts of the state (Figure 3). It is worth noting that the type of projected sanitation coverage was based on a deterministic projection. However, we acknowledge that this is a policy choice and not an easily projectable dynamic.
TABLE 2
Estimates of projected indicators in the demographic dimensions State of Minas Gerais – 2010-2040
Indicators Base scenario
2010 2020 2030 2040
Population 0-14 y.o. (%) 22.9 19.5 17.6 16.1 Population 15-64 y.o. (%) 69.0 70.1 68.5 65.6 Population 64+ y.o. (%) 8.1 10.4 13.9 18.4 Dependency ratio (%) 44.9 42.5 45.9 52.5 Expected years of education 9.2 10.4 11.2 11.6 Sanitation (% of households) 71.4 78.7 87.2 92.8
Source: Based on: IBGE (Demographic Censuses of 1980, 1991, 2000, 2010, Estimativas de População 2015); Centro de Previsão do Tempo e Estudos Climáticos/Instituto Nacional de Pesquisas Espaciais – CPTEC/Inpe.
FIGURE 3
Baseline and projected demographic indicators at microregion level State of Minas Gerais – 2010-2040
Expected Education (2010) Expected Education (2040)
Dependency Ratio (2010) Dependency Ratio (2040)
Sewage Coverage (%) (2010) Sewage Coverage (%) (2040)
2010 (Jenks)
8.4 to 8.7 8.7 to 9.0 9.0 to 9.1 9.1 to 9.5 9.5 to 9.9
10.6 to 11.4 11.4 to 11.6 11.6 to 11.7 11.7 to 11.8 11.8 to 12.0 2040 (Jenks)
0.42 to 0.43
0.43 to 0.45 0.45 to 0.48
0.48 to 0.52 0.52 to 0.59 2040 (Jenks) 0.40 to 0.43
0.43 to 0.45 0.45 to 0.48
0.48 to 0.52 0.52 to 0.62 2010 (Jenks)
11.4 to 33.8
33.8 to 58.9 58.9 to 73.7
73.7 to 84.4 84.4 to 95.4 2010 (Jenks)
11.4 to 33.8
33.8 to 58.9 58.9 to 73.7 73.7 to 84.4
84.4 to 100.0 2040 (Jenks)
360 180 0 360 km
Institutional dimension
We use data from the State System of Information on Sanitation8 on the proportion of
municipalities in a region having a municipal contingency plan to manage hazards. Due to the high uncertainty levels in forecasting the supply of public services, we simply assume that the present (2010) public capacity to respond to hazards will be reproduced throughout the 2010-40 period. Government transfers are calculated as the number of beneiciaries of transfers (public pension, social assistance, rural and old age pension for the poor) to the number of working age individuals paying taxes. We call this the “government transfer support ratio”, estimated as the population projections weighted by the percentage of beneiciaries and percentage of taxpayers. We assume that the age proile of beneiciaries and taxpayers will remain constant until 2040, thus the support ratio is mainly afected by changes in population age structure for each region of the state and by the institutional base in 2010. This procedure is similar to that used in other studies (MILLER et al., 2010; QUEIROZ; FIGOLI, 2011).
Our results show that, on average, only 19.9% of the municipalities within regions had municipal contingency plans to manage hazards. Regarding the reliance on government transfers, the support ratio could fall from 1.6 workers per beneiciary in 2010 to 1.4 workers per beneiciary in 2040. The municipalities in the less developed Northern regions of the state have a smaller support ratio than the more developed ones, despite the older age structure of the population in the Southern region. In relation to Bolsa Família (one of the largest social programs in Brazil), transfers in some Northern regions in 2010 are about 5% of the local GRP. For example, this is the case in Januária, Araçuai, Salinas, and Janaúba, whereas the percentage in the Southern regions of the state is around 1% of the GRP or less.
Integrating the dimensions: the Multidimensional Vulnerability Index (MVI)
The four dimensions discussed above were combined into a single multidimensional vulnerability index (MVI) known as the Alkire-Foster methodology (ALKIRE; FOSTER, 2011). For each decennial projected year (2010, 2020, 2030, and 2040) we calculated the MVI before and ater the climate impact. In addition, we calculated the percentage contribution of each dimension to the total vulnerability measured for each decennial year in order to analyse how evolving scenarios of temperature change modiies the relative contribution of each dimension of population vulnerability over time. Table 3 summarizes the dimensions and indicators used, in addition to the cut-of level below which each region is considered as being deprived for each indicator. The same weights are assigned to each indicator in the construction of the MVI, since we have no a priori theoretical evidence as to the importance of each dimension on projected vulnerability to climate related impacts.
TABLE 3
Dimensions, indicators, indicator cut-ofs, and weighting scheme
Dimension (d) Indicator (I) Vulnerability cut-of (Zl) Weight
Economic % variation in GRP Locational quotient <=1 1/11 % variation in employment Locational quotient <=1 1/11 % variation in family consumption Locational quotient <=1 1/11 Demographic Total dependency ratio = state average 1/11 Expected education 1st quartile 1/11 % households with proper sanitation = state average 1/11 Health Average prevalence of dengue = 75% of cdf (base: 2010) 1/11 Average prevalence of respiratory diseases = 75% of cdf (base: 2010) 1/11 Average prevalence of infectious diseases = 75% of cdf (base: 2010) 1/11 Institutional Government transfer support ratio = state average 1/11 % of municipalities with risk management plan = state average 1/11
The MVI (M0) is deined by the interaction of two components: a multidimensional
deprivation level (H) and a multidimensional deprivation intensity (A). We start by deining the number of simultaneous dimensions of deprivation that will characterize a region as vulnerable. Following Alkire and Foster (2011), we estimate diferent proportions of indicators in which each region is classiied as deprived in order to analyse where the curve of the adjusted headcount (M0) ratio is stable. We used temporal dominance analysis (not shown here) to deine the 50% point as the vulnerability cut-of since it represents the point at which there is a disturbance in the vulnerability trend among regions. To calculate the cut-of point, k, we estimate the diferent ratios c/d, where:
c = number of indicators censored (deprivation dummy) d = total number of indicators.
Thus, k varies from 0% to 100%. If we call ci the deprivation vector - or the number of indicators a region i is deprived, k equal to 50% would represent ci>=50%; that is, a region must be deprived in at least 50% of the indicators to be considered multidimensionally deprived.
Up to this point, there is relatively small variability in the number of vulnerable regions (between 35% and 50%), and ater this mark there is a sharp decline (to around 20% of vulnerable regions at the 60% cut-of). The deprivation level (H) thus represents the proportion of regions multidimensionally deprived (in at least 50% of the indicators).
The second step is the estimation of the breadth of vulnerability experienced by each poor region. This point is crucial in order to adjust the multidimensional vulnerability level (H) to its intensity (A). It represents the share of possible deprivations experienced by a multidimensionally vulnerable region. The MVI is, therefore, M0(y,z) = H x A, also known as the Adjusted Headcount Ratio. It measures the proportion of regions that are classiied as simultaneously deprived in at least 50% of the indicators weighted by its intensity.
(compared to 0.53 to 0.55 in 2010). The intensity of vulnerability and the Adjusted Headcount Ratio also present substantial increases in 2040 compared to 2010. While the average intensity-adjusted multidimensional vulnerability (M0) increases from 0.35 to 0.36 in 2010 – a 3.1% change, in 2040 it increases from 0.35 to 0.48 – a 39.8% change.
Table 4 shows the climate impacts on the MVI, both overall and for each indicator. Results show that vulnerability ater climate impacts increases for all indicators. Health indicators – particularly dengue rates – would present the greatest impact on regions, with vulnerability due to climate impacts increasing to around 190% in 2040. Some economic indicators also show a substantial increase in susceptibility due to the climate impact. Vulnerability due to a decline in GRP ater a climate shock, for instance, would increase from 9% in 2010 to 38% in 2040.
TABLE 4
Percentage change in vulnerability (overall and censored by indicator) before and ater climate impact (vulnerability cutof = 50%)
State of Minas Gerais – 2010-2040
Indicators 2010 2020 2030 2040
Economic dimension
Average annual gross regional product 9.4 14.3 25.9 38.2 (% variation in the 5-year period)
Average annual employment -3.0 13.3 10.3 14.3 (% variation in the 5-year period)
Average annual household consumption 3.0 20.0 27.6 34.3 (% variation in the 5-year period)
Demographic dimension
Total dependency ratio 0.0 4.0 13.3 28.6 Expected education 7.1 21.4 0.0 21.1 % of households with proper sanitation 4.2 16.7 11.1 18.8
Health dimension
Average prevalence rate of dengue 20.0 88.9 122.2 190.9 Average prevalence rate of respiratory diseases 0.0 42.9 40.0 46.7 Average prevalence rate of infectious diseases 6.7 50.0 60.0 93.8
Institutional dimension
Government transfers support ratio -4.0 4.5 9.1 29.2 Proportion of municipalities with risk management plan
Total 4.83.1 26.321.5 31.625.9 28.039.8
Source: Based on: IBGE (Estimativas de População 2015); Brazil/Ministério da Saúde (SIH/SUS, 2005-2010b); Centro de Previsão do Tempo e Estudos Climáticos/Instituto Nacional de Pesquisas Espaciais – CPTEC/Inpe.
the climate impact occurred. Overall, while institutional and demographic dimensions would maintain their contribution to vulnerability as approximately stable over time, the opposite would be observed for the economic and health dimensions. This is also a consequence of our modelling strategy: while in the irst case, vulnerability reflects a trend in the demographic and institutional scenarios, in the second case this susceptibility also reflects a climate impact scenario, acting synergistically to increase the vulnerability of regions.
Finally, we analyse the spatial distribution of vulnerable regions before and ater climate impacts between 2010 and 2040 (Figure 4). We use the measure of vulnerability intensity built from the multidimensional index (with zero indicating no vulnerability at all, and one indicating extreme vulnerability). Besides the heterogeneous intensity of vulnerability across regions, an overall vulnerability increase ater the climate impact can be seen at each period and over time. In 2040, some regions remain deeply vulnerable (particularly in the North and Northeast), while others become vulnerable in 2040, ater the climate impact (in the West/Northwest and South).
FIGURE 4
Spatial distribution of vulnerability intensity for regions State of Minas Gerais – 2010-2040
2010 Base scenario
0,000000 0,000001 - 0,545455 0,545456 - 0,636364 0,636365 - 0,727273 >0,727263 0,000000
0,000001 - 0,545455 0,545456 - 0,636364 0,636365 - 0,727273 > 0,727263
0,000000 0,000001 - 0,545455 0,545456 - 0,636364 0,636365 - 0,727273 > 0,727263
0,000000 0,000001 - 0,545455 0,545456 - 0,636364 0,636365 - 0,727273 >0,727263
0 75 150 300km 0 75 150 300km
0 75 150 300km 0 75 150 300km
2010 Base impact scenario
2010 Climate impact scenario 2010 Base scenario
Discussion and concluding remarks
Claeha eas o e halleeso e a a ee osksa eo
ovul eablaoe ol .Sientiic consensus on temperature and rainfall variability
increases in the next decades have prompted a series of multilateral eforts to negotiate mitigation initiatives, such as the reduction in greenhouse gas emissions and subsidies for pro-environmental consumption. Most of these international agreements, however, have proved less than efective in promoting actual and timely change (DIETZ et al., 2003; WALKER et al., 2009).
Multi-country aid and political organizations, such as the UN and World Bank, have shited their approach away from mitigation towards resilience strategies. This new focus on how to deal with the social impacts of climate change has a Social Protection (SP) paradigm as a central piece in creating adaptation in the short run and resilience in the long run. The main objective of climate-responsive SP is to minimize the vulnerability of people and places and to increase equity in the defence capacity (KURIAKOSE et al., 2013). Although a long list of desired institutional design features must be met by many of these frameworks, two of them are of particular interest for the type of analysis performed in this study: (1) the development of targeting schemes, such as a social proiling of vulnerability and the geographic distribution of climate related vulnerability; and (2) investments in livelihoods and social infrastructures that build resilience.
This article investigates the spatial distribution and temporal evolution of population vulnerability to climate change in 66 regions in the state of Minas Gerais, Brazil. By focusing on multiple key dimensions of population-based vulnerability – such as health, economy, institutional capacity, social protection, and demography – we were able to estimate when, where, and how vulnerability to climate shocks would evolve in the next decades, given the unfolding demographic, epidemiological, and urban transitions, and the underlying development scenarios in Brazil.
Minas Gerais is a particularly interesting setting for understanding how climate change would influence population vulnerability because it hosts a unique portfolio of geophysical areas, as well as high levels of social heterogeneity, mirroring the biotic and socioeconomic structure of Brazil.
that the climate impact on dengue transmission is quite complex. However the authors argue that precipitation and temperature would provide adequate conditions for immature habitats, fostering vector development, survival and reproduction. Ultimately, the increase in vector reproduction would lead to higher probabilities of dengue transmission.
The variability in demographic scenarios due to climate impacts were not considered here, yet it is unlikely that these feedbacks are signiicant in the short run, since they may irst afect the economic and health indicators. As suggested by our indings, climate-induced deprivation would likely be more difuse 30 years from now, reaching areas where vulnerability would not exist if a climate shock had been avoided. In addition, as predicted by the SP systems approach, areas with the lowest levels of social (government transfers) and institutional (contingency plan for natural hazards) protection are also the places most afected by climate-related impacts on health and the economy.
We believe that our empirical simulations and spatial proiling of impacts may be useful as an exercise to provide insights about potential consequences of climate change on population vulnerability. Despite the large degree of uncertainty inherent to socioeconomic and demographic scenarios, and the assumption of a constant technology in the agriculture and health sectors, our results suggest that the multifaceted nature of vulnerability requires adaptation strategies that include the development of long-term policies able to tackle the incomplete population transitions. Once again, social and institutional building capacity might be one of the most solid and politically feasible courses of action to promote resilience and minimize adverse consequences of climate shocks in the decades to come.
To be efective, meaningful and sustainable, policies should acknowledge diferences between the short and long term, as well as the long-lasting impacts of climate variations, such as direct impacts to the economy. In this sense, Hultman and Bozmoski (2006) suggest that three factors would help reduce vulnerability while facilitating adaptation: a) the decentralization of decision-making authority, moving towards more disaggregated (local and regional) levels; b) the expansion of protection mechanisms against environmental degradation; and c) the transfer or diversiication of the risk over time, space, and diferent institutions. Some of these features were incorporated into our analysis; others were omitted due to data limitations. In this study, we were able to include the impact of diferential wage rates on labour migration for the 66 regions being examined. However, examples of feedback still to be explored are: i) the impact of age-selective out-migration, as measured by the economic model, on increasing dependency ratios; and, ii) feedback between increasing morbidity and hospitalization rates and their consequences on labour productivity and, consequently, on the performance of economic indicators.
m ude of the bias introduced by our methodological strategy since feedback efects
among the variables, health and climate included, could go in any direction.
Our simulations are a irst step towards understanding and explicitly modelling population-based heterogeneity, but further reinements in the future will allow us to incorporate estimates at the municipality level, particularly in regions characterized by higher internal heterogeneity in terms of vulnerability. These are the political and administrative units that design and implement most adaptive policies, since they require the knowledge of a conjunction of local political, social, economic, institutional, and environmental speciicities. Thus, multi-level analysis seems to be a promising venue by which vulnerability mapping should be constructed and monitored.
References
ALKIRE, S.; FOSTER, J. E. Counting and multidimensional poverty measurement. Journal of Public
Economics, v. 95, n. 7-8, p. 476-487, 2011.
BRASIL. Ministério da Saúde. Secretaria de Atenção à Saúde (SAS).Sistema de Informação de
Agravos de Notiicação (Sinan). Brasília, 2005-2010a.
_________. Ministério da Saúde. Secretaria de Atenção à Saúde (SAS). Sistema de Informações
Hospitalares do SUS (SIH/SUS). Brasília, 2005-2010b.
_________. Informações de saúde, demográicas e socioeconômicas. Brasília: Datasus, 2010.
_________. Informações de saúde, demográicas e socioeconômicas. Brasília: Datasus, 2009.
BARBIERI, A. F.; DOMINGUES, E. P.; QUEIROZ, B.; RUIZ, R.; RIGOTTI, J. I.; CARVALHO. J. A.; RESENDE, M. F. Climate change and population migration in Brazil’s Northeast: scenarios for 2025-2050.
Population and Environment, v. 31, n. 5, p. 344-370, 2010.
BECK, U. Risk society: towards a new modernity. New Delhi: Sage, 1992. (Translated from the
German Risikogesellschat, 1986).
BOSELLO, F.; ROSON, R.; TOL, R. S. J. Economy-wide estimates of the implications of climate
change: human health. Ecological Economics, v. 58, n. 3, p. 579-591, 2006.
BOURGUIGNON, F.; CHAKRAVARTY, S. R. The Measurement of multidimensional poverty. The
Journal of Economic Inequality, v. 1, n. 1, p. 25-49, 2003.
CHOU, S. C.; MARENGO, J. A.; LYRA, A.; SUEIRO, G.; PESQUERO, J.; ALVES, L. M.; KAY, G.; BETTS, R.; CHAGAS, D.; GOMES, J. L.; BUSTAMANTE, J.; TAVARES, P. Downscaling of South America present
climate driven by 4-member HadCM3 Runs. Climate Dynamics, v. 38, n. 3-4, p. 635-653, 2011.
CONFALONIERI, U. E.; BARATA, M. Avaliação da vulnerabilidade municipal no estado do Rio de
Janeiro às mudanças climáticas. Rio de Janeiro: Fiocruz, 2011.
CUTTER, S. L. Societal responses to environmental hazards. International Social Science Journal,
v. 48, n. 150, p. 525-536, 1996.
DERESSA, T. T. et al. Determinants of farmers’ choice of adaptation methods to climate change
in the Nile Basin of Ethiopia. Global Environmental Change, v. 19, n. 2, p. 248-255, 2009.
DESSAI, S.; HULME, M. Assessing the robustness of adaptation decisions to climate change
uncertainties: a case study on water resources management in the East of England. Global
D E U TSCH, J.; SILBER, J. Measuring multidimensional poverty: an empirical comparison of various
approaches. Review of Income and Wealth, v. 51, n. 1, p. 145-174, 2005.
DIETZ, T.; OSTROM, E.; STERN, P. C. The struggle to govern the commons. Science, v. 302,
n. 5652, p. 1907-1912, 2003.
DUCHESNE, L. Proyecciones de población por sexo e edad para áreas intermedias e menores:
metodo “relación de cohortes”. In: GRAMADOS, M. P. (Org.). Metodos para proyecciones
subnacionales de población. Bogotá: Centro Latinoamericano de Demografía (Celade), 1989. p. 71-126.
DYSON, T. On development, demography and climate change: the end of the world as we know it? Population and Environment, v. 27, n. 2, p. 117-149, 2006.
FIELD, C.; BARROS, V.; STOCKER, T.; QIN, D.; DOKKEN, D.; EBI, K.; MASTRANDREA, M.; MACH, K.;
PLATTNER, G.-K.; ALLEN, S.; TIGNOR, M.; MIDGLEY, P. (Eds.). Intergovernmental panel on climate
change special report on managing the risks of extreme events and disasters to advance climate change adaptation. Cambridge and New York: Cambridge University Press, 2011.
FÜSSEL, H. M.; KLEIN, R. J. Climate change vulnerability assessments: an evolution of conceptual
thinking. Climatic Change, v. 75, n. 3, p. 301-329, 2006.
HALLEGATTE, S. Strategies to adapt to an uncertain climate change. Global Environmental Change,
v. 19, n. 2, p. 240-247, 2009.
HAJAT, S. et al. Climate change efects on human health: projections of temperature-related
mortality for the UK during the 2020s, 2050s and 2080s. Journal of Epidemiology and Community
Health, v. 68, n. 7, p. 641-648, 2014.
HEDENUS, F.; WIRSENIUS, S.; JOHANSSON, D. J. A. The importance of reduced meat and dairy
consumption for meeting stringent climate change targets. Climatic change, v. 124, n. 1-2,
p. 79-91, 2014.
HELTBERG, R.; SIEGEL, P.; JORGENSEN, S. Addressing human vulnerability to climate change:
toward a “no-regrets’ approach”. Global Environmental Change, v. 19, n. 1, p. 89-99, 2009.
HORRIDGE, M.; MADDEN, J.; WITTWER, G. The impact of the 2002-2003 drought on Australia.
Journal of Policy Modeling, v. 27, n. 3, p. 285-308, 2005.
HULTMAN, N. E.; BOZMOSKI, A. S. The changing face of normal disaster: risk, resilience, and natural security in a changing climate. Journal of International Afairs, v. 59, n. 2, p. 25-41, 2006.
IBGE – Instituto Brasileiro de Geograia e Estatística. Censo Demográico 2010. Rio de Janeiro, 2010.
_________. Pesquisa Nacional por Amostra de Domicílios (PNAD). Rio de Janeiro, 2000-2008.
INPE – Instituto Nacional de Pesquisas Espaciais. Centro de Previsão do Tempo e Estudos Climáticos/Instituto Nacional de Pesquisas Espaciais – CPTEC/Inpe. Rio de Janeiro, 2005-2010.
JIANG, L.; HARDEE, K. How do recent population trends matter to climate change? Population
Research and Policy Review, v. 30, n. 2, p. 287-312, 2011.
KURIAKOSE, A. T.; HELTBERG, R.; WISEMAN, W.; COSTELLA, C.; CIPRYK, R.; CORNELIUS, S. Climate‐
responsive social protection. Development Policy Review, v. 31, n. 2, p. 19-34, 2013.
LEE, R. The outlook for population growth. Science, v. 333, n. 6042, p. 569-573, 2011.
_________. The demographic transition: three centuries of fundamental change. The Journal of
Economic Perspectives, v. 17, n. 4, p. 167-190, 2003.
Development of regional future climate change scenarios in South America using the ETA CPTEC/ HadCM3 climate change projections: climatology and regional analyses for the Amazon, São
Francisco and the Parana River basins. Climate Dynamics, v. 38, n. 9-10, p. 1829-1848, 2012.
McGRANAHAN, G.; BALK, D.; ANDERSON, B. The rising tide: assessing the risks of climate change
and human settlements in low elevation coastal zones. Environment and Urbanization, v. 19,
n. 1, p. 17-37, 2007.
McLEMAN, R. Impacts of population change on vulnerability and the capacity to adapt to climate
change and variability: a typology based on lessons from “a hard country”. Population and
Environment, v. 31, n. 5, p. 286-316, 2010.
McLEMAN, R.; SMIT, B. Migration as an adaptation to climate change. Climatic Change, v. 76,
n. 1-2, p. 31-53, 2006.
MILLER, T.; MASON, C.; HOLZ, M. The iscal impact of demographic change in ten Latin American countries: projecting public expenditures in education, health, and pensions. In: COETLEAR,
D. (Ed.). Population aging: is Latin America ready? Washington, DC: The World Bank, 2010.
p. 233-272.
NERI, M. C.; MELO, L. C. C.; SACRAMENTO, S. R.; NERI, A. L.; CALCADA, A. L.; SCHARTH, P.; MOREIRA, L. Trata Brasil: impactos sociais da falta de saneamento nas principais cidades brasileiras. Rio de Janeiro: FGV/Ibre, 2009.
O’BRIEN, K. L.; LEICHENKO, R. M. Double exposure: assessing the impacts of climate change within
the context of economic globalization. Global Environmental Change, v. 10, n. 3, p. 221-232, 2000.
OMRAN, A. R. The epidemiological transition: a theory of the epidemiology of population change.
The Milbank Quarterly, v. 83, n.4, p. 731-57, 2005.
O’NEIL, B.; DALTON, M.; FUCHS, R.; JIANG, L.; PACHAURI, S.; ZIGOVA, K. Global demographic
trends and future carbon emissions. Proceedings of the National Academy of Sciences (PNAS),
v. 107, n. 41, p. 17521-17526, 2010.
PATTANAYAK, K.; ROSSY, M. T.; DEPROZ, B. M.; BAUCH, S C.; TIMMINS, C.; WENDLANDZZ, K. J.; ALGERX, K. Climate change and conservation in Brazil: CGE evaluation of health and wealth
impacts. The B.E. Journal of Economic Analysis and Policy, v. 9, n. 2, p. 1-42, 2009.
PETER, W. W.; HORRIDGE, M.; MEGUER, G. A.; NAVQUI, F.; PARMENTER, B. R. The theoretical
structure of MONASH-MRF. Center of Policy Studies and the Impact Project. April, 1986 (Working paper, n. OP-85). Available via Monash University: <http://www.monash.edu.au/policy>. Accessed: 12 Jul. 2010.
PIDGEON, N.; KASPERSON, R. E.; SLOVIC, P. (Eds.). The social ampliication of risk. Cambridge
University Press, 2003.
PRATA, P. R. The epidemiologic transition in Brazil. Cadernos de Saúde Pública, v. 8, n. 2,
p. 168-175, 1992.
QUEIROZ, B. L.; FIGOLI, M. G. B. Population aging and the rising costs of public pension in Brazil. Belo Horizonte: Cedeplar/UFMG, 2011. (Texto para discussão, n. 438). Available at: <http://www. cedeplar.ufmg.br/pesquisas/td/TD%20438.pdf>. Accessed: 1 Sep. 2011.
QUEIROZ, B. L.; TURRA, C. M. Window of opportunity: socioeconomic consequences of
demographic changes in Brazil. Washington, DC: National Technical Association (NTA), 2010. Available at: <http://www.ntaacounts.org>. Accessed: 1 Sept. 2011.
REZENDE, S.; WAJNMAN, S.; CARVALHO, J. A. M.; HELLER, L. Integrando oferta e demanda de serviços de saneamento: análise hierárquica do panorama urbano brasileiro no ano 2000.
R I G OTTI, J. I. R.; SAWYER, D. O.; SOUZA, L. R.; RODRIGUES, C. C. A re-examination of the expected years of schooling: what can it tell us? Brasília: International Policy Centre for Inclusive Growth (IPC-IG), 2013 (IPC working paper, n. 117).
SAINI, C. C. S.; MENEZES, R. T.; TONETO JÚNIOR, R. Desestatização do abastecimento de água no Brasil: efeitos sobre o acesso e a desigualdade de acesso. 37th BRAZILIAN ECONOMICS
MEETING,2011. Proceedings…Rio de Janeiro: Anpec, 2011. Available at: <http://www.anpec.
org.br/encontro2009/inscricao.on/arquivos/000-ebd13128f371a7c7b79b4c0b1e 4ba20.pdf>. Accessed: 20 Jan. 2012.
SCHRAMM, J. M. D. A.; OLIVEIRA, A. F. D.; LEITE, I. D. C.; VALENTE, J. G.; GADELHA, Â. M. J.; PORTELA, M. C.; CAMPOS, M. R. Epidemiological transition and the study of burden of disease in Brazil.
Ciência & Saúde Coletiva, v. 9, n. 4, p. 897-908, 2004.
SLOVIC, P. E. The perception of risk. Earthscan Publications, 2000.
SUFRAMA – Superintendência da Zona Franca de Manaus. Disponível em: <http://www.suframa. gov.br> Acesso em março de 2009.
TACOLI, C. Crisis or adaptation? Migration and climate change in a context of high mobility.
Environment and Urbanization, v. 21, n. 2, p. 513-525, 2009.
TIMMINS, C. Health and climate change in the developing world: the impact of global warming
on Brazilian morbidity patterns. New Haven, CT: Yale University, 2003 (Working paper).
VANWEY, L. K.; HULL, J. R.; GUEDES, G. R.Capitals and context: bridging health and livelihoods
in smallholder frontiers. In: KING, B.; CREWS, K. A. (Org.). Ecologies and politics of health. 1st
ed. Boca Raton, FL, USA: Routledge, 2012, p. 33-54.
VÖRÖSMARTY, C. J.; GREEN, P.; SALISBURY, J.; LAMMERS, R. B. Global water resources: vulnerability
from climate change and population growth. Science, v. 289, n. 5477, p. 284, 2000.
WALKER, B.; BARRETT, S.; POLASKY, S.; GALAZ, V.; FOLKE, C.; ENGSTROM, G.; DE ZEEUW, A. Looming global-scale failures and missing institutions. Science, v. 325, n. 5946, p. 1345-1346, 2009.
WILSON, S.; HUTSON, M.; MUJAHID, M. How planning and zoning contribute to inequitable
development, neighborhood health, and environmental injustice. Environmental Justice, v. 1,
n. 4, p. 211-216, 2008.
WORLD BANK. The growth report: strategies for sustained growth and inclusive development.
World Bank Publications, 2008.
ZAGHENI, E. The leverage of demographic dynamics on carbon dioxide emissions: does age
structure matter? Demography, v. 48, n. 1, p. 371-399, 2011.
ZAGHENI, E. The demographic dimension of climate change. In: KAHRAMAN, E.; BAIG, A. (Org.).
Environmentalism, environmental strategies, and environmental sustainability. Hauppauge, NY: Nova Science Publishers, 2009.
ZELINSKY, W. The hypothesis of the mobility transition. The Geographical Review, v. 61, n. 2,
p. 219-249, 1971.
About the authors
Gilvan Ramalho Guedes has a Ph.D. in Demography, Federal University of Minas Gerais (2010). Associate Professor of Demography and Core Faculty of the Center for Development and Regional Planning (CEDEPLAR). Head – Socioenvironmental Sciences – Federal University of Minas Gerais.
Kenya V. M. S. Noronhahas a Ph.D. in Economics, Federal University of Minas Gerais (2005). Associate Professor of Economics and Core Faculty of the Center for Development and Regional Planning (CEDEPLAR) – Federal University of Minas Gerais.
Bernardo Lanza Queiroz has a Ph.D. in Demography - University of California at Berkeley (2005). Associate Professor of Demography and Core Faculty of the Center for Development and Regional Planning (CEDEPLAR). Head – Actuarial Sciences – Federal University of Minas Gerais.
Edson Domingueshas aPh.D. in Economics – São Paulo University (2002). Associate Professor of Economics and Core Faculty of the Center for Development and Regional Planning (CEDEPLAR). Head – Department of Economics – Federal University of Minas Gerais.
José Irineu Rigottihas a Ph.D. in Demography – Federal University of Minas Gerais (1999).
Associate Professor of Demography and Core Faculty of the Center for Development and Regional Planning (CEDEPLAR). Chair – Graduate Program in Demography – Federal University of Minas Gerais.
Gláucia P. da Costa has a Ph.D. candidate in Economics – Federal University of Minas Gerais.
Visiting scholar at the Regional Economics Applications Laboratory (REAL) – University of Illinois at Urbana-Champaign (EUA).
Flávia Chein has a Ph.D. in Economics – Federal University of Minas Gerais. Associate Professor of Economics – Federal University of Juiz de Fora.
Fransisco Cortezzi is a Ph.D. candidate in Geography – Université Paris IV – Sorbonne.
Ulisses E. Confalonieri has a Ph.D. in Public Health and Epidemiology – Rural Federal University
of Rio de Janeiro. Full professor (retired) – Fluminense Federal University.
Kênia de Souzahas a Ph.D. in Economics – Federal University of Minas Gerais (2015). Adjunct Professor – Center for Development and Regional Planning (CEDEPLAR) – Federal University of Minas Gerais.
Contact address
Alisson Flávio Barbieri
Faculdade de Ciências Econômicas – Universidade Federal de Minas Gerais Av. Antônio Carlos, 6627 – Pampulha
30270-901 – Belo Horizonte-MG, Brazil
Resumo
Transições populacionais e mudança de temperatura em Minas Gerais, Brasil: uma abordagem multidimensional
de temperatura afetariam a vulnerabilidade relativa de cada região no futuro. Os resultados sugerem que as dimensões econômica e de saúde são as maiores contribuintes para o aumento da vulnerabilidade relacionada às alterações na temperatura média, com as regiões mais pobres e voltadas ao agronegócio constituindo as mais afetadas em cenários futuros.
Palavras-chave: Mudança climática. Vulnerabilidade populacional. Transições populacionais. Índice multidimensional. Minas Gerais.
Resumen
Transiciones poblacionales y cambio de temperatura en Minas Gerais, Brasil: un abordaje multidimensional
En las próximas décadas, el cambio climático exacerbará la vulnerabilidad de las poblaciones alrededor del mundo, especialmente en los países en desarrollo. En este artículo se investigan escenarios hipotéticos futuros de vulnerabilidad frente al cambio climático para los próximos 30 años en 66 microrregiones del estado de Minas Gerais. Sobre la base del Índice de Alkire y Foster, se integran en un indicador multidimensional las dimensiones simuladas y proyectadas de vulnerabilidad poblacional, mostrando cómo los escenarios de cambios de temperatura afectarían la vulnerabilidad relativa de cada región en el futuro. Los resultados sugieren que las dimensiones económica y de salud son las que más contribuyen en el aumento de la vulnerabilidad relacionada con las alteraciones de la temperatura media, y que las regiones más pobres y volcadas al agronegocio constituirán las más afectadas en estos escenarios futuros.
Palabras clave: Cambio climático. Vulnerabilidad poblacional. Transiciones poblacionales. Índice multidimensional. Minas Gerais.