Universidade de Aveiro 2016
Departamento de Biologia
PEDRO MIGUEL
PINHEIRO SARAIVA
Diversidade bacteriana em águas subterrâneas do
Maciço Calcário Estremenho (Portugal) reveladas por
pirosequenciação
Bacterial diversity in groundwater samples from
Estremenho Karst Massif (Portugal) revealed by 16S
rDNA pyrosequencing
Tese apresentada à Universidade de Aveiro para cumprimento dos requisitos necessários à obtenção do grau de Mestre em Biologia Molecular e Celular, realizada sob a orientação científica da Doutora Daniela Rebelo de Figueiredo, Investigadora em Pós-Doutoramento do Departamento de Biologia e CESAM, Universidade de Aveiro, do Doutor Nelson José Cabaços Abrantes, investigador Auxiliar do Departamento de Ambiente e CESAM da Universidade de Aveiro, e do Doutor Daniel Francis Richard Cleary, investigador Principal do Departamento de Biologia e CESAM da Universidade de Aveiro
o júri
presidente Prof. Doutora Maria de Lourdes Gomes Pereira
Professora associada c/ Agregação, Departamento de Biologia, Universidade de Aveiro
Doutor Francisco José Riso da Costa Coelho
Investigador em Pós-Doutoramento, Departamento de Biologia e CESAM da Universidade de Aveiro
Doutora Daniela Rebelo de Figueiredo (orientadora)
Investigadora em Pós-Doutoramento, Departamento de Biologia e CESAM da Universidade de Aveiro
agradecimentos Queria agradecer a Daniela Figueiredo, orientadora principal, pela confiança depositada e pelo convite para continuar o trabalho desenvolvido durante a minha Pesquisa de Licenciatura. Mas também pela forte motivação e palavras que me fizeram continuar e incentivaram a ir cada vez mais longe nesta incrível aventura, que é a investigação.
Agradecer também ao Doutor Nelson Abrantes, coordenador do projeto Karatrisk, que permitiu que esta dissertação fosse possível e pela correção da mesma. And Dr. Daniel Cleary for the introduction to QIIME.
Queria agradecer à Dona Celeste, pela simpatia, empenho e avisos antes e durante todo o processo de submissão das provas de dissertação.
A todas as pessoas que tiveram direta ou indiretamente um forte impacto no meu percurso académico e pessoal, nem sempre fácil de enumerar todas elas, fica por isso um agradecimento a todas elas.
Ao Alexandre Ramos, Marta Morais, Pedro Gomes, Soraia Lopes, Inês Gregório e Barbara Cartagena pela amizade e por todos os bons momentos que moldaram a minha personalidade e forma de ser. E que ainda não tenham tido uma ligação direta ao trabalho desenvolvido nesta tese foram essenciais para manter a minha sanidade mental durante todo esta fase de Mestrado. E que por mais distante e diferentes percursos seguidos por cada um,
continuamos a partilhar esta amizade.
Por fim agradecer a minha família por todo o suporte e apoio ao longo destes sete anos (que já começam a pesar), suporte imprescindível para o percurso realizado e acima de tudo sem nunca questionarem ou limitarem as minhas aspirações e decisões mesmo sem muitas vezes as entenderem, um MUITO OBRIGADO.
palavras-chave Comunidades Bacterianas; Maciço Calcário Estremenho; Águas subterrâneas; 16S rDNA-DGGE, Pirosequenciaçao.
resumo A água subterrânea constitui uma importante fonte de água doce, que muitas vezes é sobre explorada e impactada pela poluição superficial. É por isso, de grande interesse a compreensão deste ambiente.
Neste sentido, o presente estudo pretendeu analisar pela primeira vez a composição e diversidade de comunidades bacterianas presentes nas águas subterrâneas do Maciço Calcário Estremenho (Centro-Oeste Portugal), através de abordagens moleculares independentes de cultura DGGE e Pirosequenciação.
Os resultados revelaram que este ambiente em particular é geralmente dominado pelo filo Proteobacteria (61,83%) com especial relevância para as ordens Thiobacterales, Rhodocyclales, Burkholderiales e Neisseriales (Betaproteobacteria); Sphingomonadales
(Alphaproteobacteria) e Xanthomonadales, Acidiferrobacterales (Gammaproteobacteria). Entre outros filos com menos
representatividade como Bacteroidetes (Sphingobacteriia), Actinobacteria (Acidimicrobiia), Acidobacteria, Firmicutes (Bacilli), Elusimicrobia (Elusimicrobia), Gemmatimonadetes, todas elas presentes normalmente emáguas doces.
Os resultados de ambas as abordagens moleculares mostraram um agrupamento semelhante observado para algumas amostras, caracterizado por uma influência direta dos ambientes superficiais e indicando um impacto de fontes de poluição, corroborado pelos taxa dominantes nessas amostras: gêneros Limnohabitans e Sphingopyxis e membros da ordem Sphingobacteriales, normalmente relacionadas com águas superficiais e poluídas. Estes dados sugerem um impacto direto do uso de terras em comunidades de bactérias de águas subterrâneas. Este trabalho assume-se como o primeiro estudo na determinação da composição e caracterização das comunidades bacterianas de um dos maiores e mais importantes sistemas cársicos da Península Ibérica.
keywords Bacterial Communities; Estremenho Karst Massif; Groundwater; 16S rDNA-DGGE, pyrosequencing
abstract Groundwater provides an important freshwater source, that is many times overexploited and suffer pressures from superficial pollution. Therefore, it is of major interest to go further in the understanding of these
environments. The present study examined, for the first time, the composition and diversity of bacterial communities present in groundwater from the Estremenho kart massif (Central-Western
Portugal), through culture-independent molecular approaches, DGGE and pyrosequencing based on 16 rDNA sequences).
Results showed that this particular environment was generally dominated by Proteobacteria (61.83%), with special relevance to Thiobacterales Rhodocyclales, Burkholderiales and Neisseriales (Betaproteobacteria) Orders; Sphingomonadales (Alphaproteobacteria) Order,
Xanthomonadales and Acidiferrobacterales (Gammaproteobacteria) Orders. Other less abundant phyla included the Bacteroidetes, (Sphingobacteriia), Actinobacteria (Acidimicrobiia), Acidobacteria, Firmicutes (Bacilli), Elusimicrobia (Elusimicrobia), Gemmatimonadetes all normally present in freshwaters.
Results from both molecular approaches showed a similar clustering observed for some samples, characterized by a direct influence from surface environments and indicating an impact from pollution sources, corroborated by the dominant taxa in those samples: genera
Limnohabitans and Sphingopyxisand members of the order
Sphingobacteriales, commonly related to superficial and polluted waters. These data suggest an interaction of direct impact of surface land use/land cover on groundwater bacterial communities.
This study is the first research for the determination of the composition and characterization of the bacterial communities from one of the biggest and most important karst massif in Iberian Peninsula.
i
List of communications linked to the present work
Poster communications:
de Figueiredo D.R., Cleary D., Saraiva P., Gomes N., Gonçalves A.M.M., Reboleira A.S., Gonçalves F., Oliveira J., Condesso de Melo M.T., Abrantes N. (2014) Metagenomic overview of bacterioplankton diversity from Estremenho karst massif aquifer (Portugal). EcoHCC’14 - 3rd International Conference on
Ecohydrology, Soil and Climate Change, Tomar, Portugal;
de Figueiredo Daniela R, Saraiva P., Melo Maria T. C, Oliveira J., Gonçalves A.M.M., Reboleira Ana S. P. S, Abrantes N. (2013). Bacterial diversity as a tracker to assess connections and pollution impacts through the aquifer of Estremenho karst massif, III Encuentro Ibérico de Biología Subterránea, Barcelona, Spain
Abrantes N., de Figueiredo D.R., Rosa I.C., Saraiva P., Gonçalves A.M.M., Bessa M., Reboleira, A.S., Gonçalves, F. (2013) Bacteria as a key-community to track variations on karstic aquifers, SETAC Europe 23rd Annual Meeting, Glasgow,
ii
Index
Index ... ii
List of Acronyms ... iv
List of Figures ... v
List of Tables ... vii
1. Introduction ... 1
1.1. Dissertation Outline ... 1
1.2. Scope, motivation and relevance ... 1
1.3. Dissertation aims ... 4
1.4. State of the Art ... 5
1.4.1. Karst areas and aquifers ... 5
1.4.2. Bacterial communities in groundwater from karst environments ... 10
1.4.3. Metagenomics approaches for the study of microbial communities 11 2. Materials and Methods ... 15
2.1. Sampling ... 15
2.2. DNA extraction ... 15
2.3. PCR-DGGE ... 18
2.3.1. PCR amplification of bacterial 16S rDNA fragments ... 18
2.3.2. Denaturing gradient gel electrophoresis (DGGE)... 18
2.4. Pyrosequencing ... 19
2.4.1. Sequencing ... 19
2.4.2. Sequences analysis using QIIME ... 20
2.4.3. Statistical analyses ... 21
3. Results and Discussion ... 22
3.1. PCR ... 22
3.2. 16S rDNA-DGGE band patterns and cluster analysis ... 23
3.3. Pyrosequencing ... 27
iii 5. References ... 43 6. Annex ... 52 6.1. Annex Table 1 ... 52 6.2. Annex Table 2 ... 53 6.3. Annex table 3 ... 54
iv
List of Acronyms
DGGE Denaturing Gradient Gel Electrophoreses
QIIME Quantitative Insights Into Microbial Ecology
NGS Next Generation Sequencing
PCR Polymerase Chain Reaction
OTU Operational Taxonomic Unit
APS Adenosine-5'-phosphosulfate
ATP Adenosine Tri-phosphate
PPi Pyrophosphate
NCBI National Center for Biotechnology Information
BLAST Basic Local Alignment Search Tool
UV Ultra Violet
WFD Water Framework Directive
RH Hydrographical regions (PT)
v
List of Figures
Figure 1 – Karst landscapes outcrops worldwide with subcrop mapped. Solid colour indicates that carbonates are relatively continuous; ... 6
Figure 2 – Representation of Hydrographic regions in Portugal (adapted from INEG, 2005) ... 7
Figure 3 - Major Karst areas (adapted from (Reboleira et al. 2011)) ... 8 Figure 4 – Land use/land cover in Estremenho Karst Massif ... 9 Figure 5 – Collection sites in Serra de Aire e Candeeiros (Maciço Calcario Estremenho) and representation of land cover. At red the urban areas; Yellow the agricultural areas; Green the forest areas. ... 17
Figure 6 – Agarose gel (1,5%) electrophoresis of PCR products; Samples K1 to K30; Molecular size marker is marked with the letter M the Negative with the letter N ... 22
Figure 7 - PCR-DGGE profiles containing the bacterial 16S rDNA fragments from water samples k1, k2, k3, k4, k6, k8, k9, k13, k15, k18, k19, k20, k21, k24, k30 collected at Estremenho Kast Massif during February 2012 ... 23
Figure 8 – Bray-Curtis similarity. Cluster dendrogram, with slicing at 40% similarity. ... 25 Figure 9 – Metric Multidimensional scaling (MDS) with resemblance level of 35%. Formation of 3 groups A, B and C. ... 25
Figure 10 –Cluster showing OTU similarity between site samples (relevance >1%) with Bray-Curtis distance. ... 28
Figure 11 - Metric Multidimensional scaling (MDS) with resemblance level of 35%. The sample K15 was excluded. ... 28
Figure 12 - Rarefaction curves of the 13 samples. The error bars show 95%confidence of upper and lower limits ... 29
Figure 13 – Distribution of the major phyla (with more than 3%) and unclassified OTUs at phylum level. The 6 groups attending, represent 83,81% of all the phyla in the samples collected. ... 30
Figure 14 - Distribution of the major Classes (with more than 3%) unclassified. The 4 groups attending, represent 61,76% of all the classes in the samples collected ... 31
vi Figure 15 - Distribution of the major Orders (with more than 3%) and unclassified OTUs at Order level. The 5 groups attending, represent 24,38% of all the Orders in the samples collected. ... 32
Figure 16 - Distribution of the major Families (with more than 2%) and unclassified OTUs at Family level. The 5 groups attending, represent 18,14% of all the Families in the samples collected. ... 33
Figure 17 – Relative abundance of Phylum (with ≥1% representation per sample). ... 34 Figure 18 - Relative abundance of Class (with ≥1% representation per sample). .. 35 Figure 19 - Relative abundance of Order (with ≥1% representation per sample). . 35 Figure 20 - Relative abundance of Family (with ≥1% representation per sample). 35
vii
List of Tables
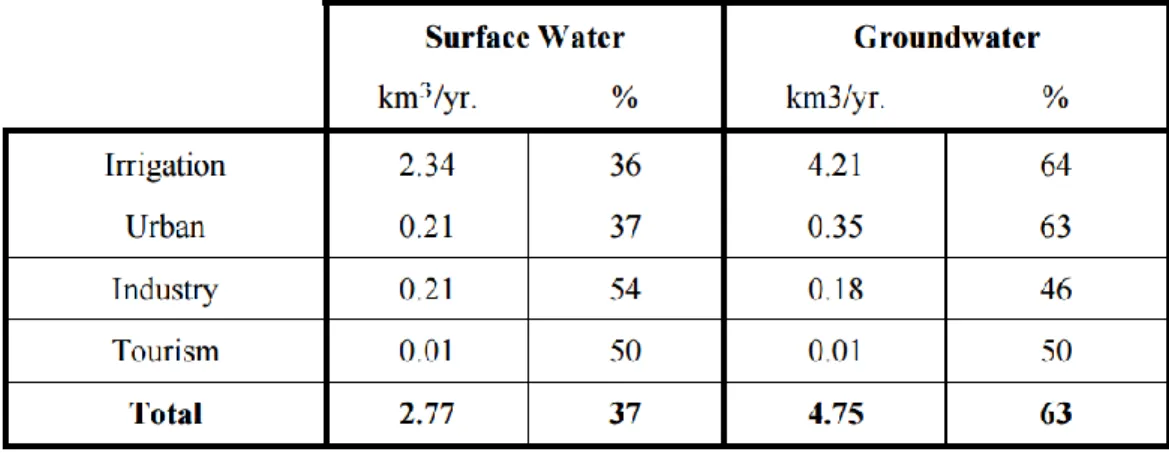
Table 1 - Consumption values of surface and groundwater in Portugal. Adapted from (Ribeiro & Cunha, 2010) ... 2
Table 2 - Distribution of bacteria in caves investigated by culture-independent molecular tool. Table adapted from (Zhou, et al. 2007) ... 11
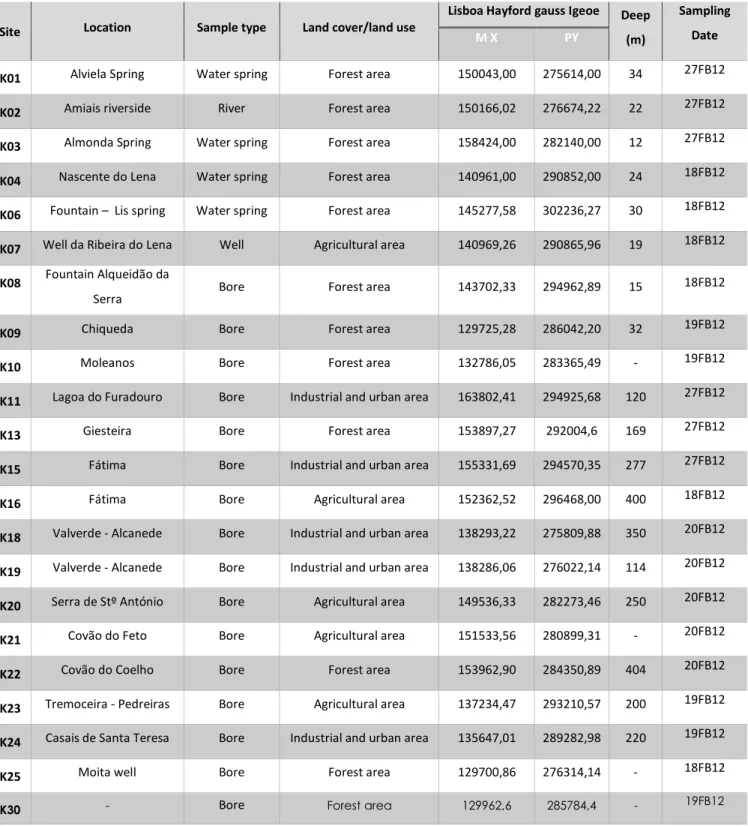
Table 3 - Sampling and location sites, sample type, type of land cover/land cover, geographic coordinates, sampling deep and date of collection. ... 16
Table 4 - OTU, organism, corresponding percentage similarity for the 16S rDNA bacterial partial sequences, NCBI taxonomy ID, NCBI reference sequence, Isolation source of the sample related, country/place, Pubmed ID of the paper and phylogenetic association. ... 36
Annex Table 1 -PCR-DGGE Bray-Curtis Similarity (group average) matrix data, REF – reference to each sample; Combining samples – The combination of different samples, based on their Ref, and the corresponding similarity. ... 52
Annex Table 2 - Pyrosequencing Bray-Curtis Similarity (group average) matrix data, REF – reference to each sample; Combining samples – The combination of different samples, based on their Ref, and the corresponding similarity. ... 53
Annex Table 3 - Resume of most abundant OTUs distribution for every sample, and respective phylogenetic association. (OTUs with > 50sequences) ... 54
1
1. Introduction
1.1. Dissertation Outline
The present dissertation begins with an introduction, addressing the scope, motivation, relevance and project aims, following a state of the art with a revision concerning the karst areas, present situation of the groundwater quality in Portugal, the study region, bacterial communities in aquifers (potential for pollution tracers), present molecular approaches to study bacterial communities, emphasising the importance of NGS nowadays.
A second part includes the description of materials and methods used in the research study, addressing the question of the thesis in aiming to evaluate the culture-independent DGGE as a screening approaches for assessing the bacterial diversity in samples, by comparing with pyrosequencing data.
The third part includes the Results and discussion from the determination, identification and characterization of the bacterial communities present in groundwater samples from Estremenho massif in Serra de Aire e Candeeiros, using molecular tools.
Finally, in the conclusion, the major outcomes from the study and future perspectives are also pointed out.
1.2. Scope, motivation and relevance
Water is the most precious natural resource for life on earth but extremely threatened by human activities, particularly when it comes to freshwater systems (Meybeck 2003). Agriculture and livestock, public water supply, industry (tanneries, mining, food processing, weaving, etc.) and tourism are some of the direct threats that drive changes in landscape structure, changing both biogeophysical and biogeochemical surface fluxes (Vörösmarty et al. 2010). In terms of the present worldwide land use/land cover, agriculture represents 11% of the total land area (Pielke et al. 2011), where 12,5% is estimated under irrigation (Biemans et al. 2011). Livestock industry represents 25% of the total land area and less than 5% is attributed to urban landscapes (Pielke et al. 2011). In short, over the past 300 years, this
2 represents a tremendous increase of land managed for human activities and population growth, leading to massif impacts on the environment and an increased demand for water resources in the near future (Biemans et al. 2011). In Portugal, agriculturally represents near 43.8% (35% agriculture and 8.8% agroforest) of total land use/land cover, where 34.6% is attributed to forest area and 5% to industry and urban (LANDYN 2014).
Therefore, land uses/land cover and water resources are directly connected. A conclusion that is very important to consider, since about 97% of Earth’s water is marine (in oceans and estuaries) and inappropriate to consume without any treatment, and only 3% is freshwater. From this 3 %, approximately 69% is locked up in the solid state (frozen water present in glaciers, ice and snow), 30% is groundwater and only 1% is present at the surface and distributed by rivers, lakes, wetland, etc. (Gleick 1993). This makes groundwater a fundamental natural source and reservoir of freshwater in the world, widely used for human consumption and socioeconomic development (Danielopol et al. 2003).
Worldwide, it is estimated an impressive use of 50% of groundwater as drinking water source, but in agriculture, this number can reach 70% for irrigation derived from groundwater (United Nations 2003).
In Portugal, the water used for human purposes is mostly for the agriculture sector (irrigation) and urban consumption, with groundwater representing 63% as a water source, as shown in Table 1 (Ribeiro and Cunha 2010).
3 Groundwater is the cheapest and fastest way to fulfil human needs, making mandatory the need to protect these precious reservoirs nowadays and in the future, but also because of its largely known beneficial effect on the environment. Groundwater reservoirs have major roles in our environment, as they provide the base flow that maintains most rivers flowing all year long, influencing the character of aquatic ecosystems and enabling them to flourish (Lerner and Harris 2009); they are also intimately connected with the landscape that it underlies (Lerner and Harris 2009), which makes important the understanding of basic principles of interactions between groundwater and surface water for an effective management of water resources, as contamination of one commonly affects the other (Sophocleous 2002).
The natural movement of water that leaves the soil areas percolates through the unsaturated zone to the water table, carrying solutes (including anthropogenic pollutants) with it. The water and solutes then flow through the saturated zone until they eventually reach their discharge point (a spring, riverbed, seep or borehole) (Lerner and Harris 2009). Depending on the type of soil / rock, the discharge end may have a more adverse effect on groundwater, such as in the case of Karst areas. Worldwide, karst areas are characterised as a result of natural erosion of carbonate and evaporate rocks, in which the landforms are formed by sinking streams, natural bridges, dry valleys, enclosed depressions, caves, gorges, fluted rock outcrops, large springs, landforms produced by dissolving rock (Drew and Hötzl 1999). These characteristics make the karstic areas highly susceptible to anthropogenic contamination from surface points and diffuse sources of pollution.
On the other hand, the dynamics of exchange processes between surface water and groundwater are an important role for the structure of subterranean communities (Danielopol et al. 2003).
Both biotic and abiotic factors are essential to understand and study these environments. One of the most important biological parameters, includes the bacterial communities, as these play a critical role in the cycling of carbon, nitrogen and other elements, synthesising natural products, and impacting the surrounding organisms and environment (Stewart 2012). However, groundwater quality issues are almost exclusively addressed by abiotic/physicochemical criteria (Tomlinson et al. 2007; Lemarchand, Masson, and Brousseau
4 2004), leaving relevant biological data unstudied (Stein et al. 2010), especially in what concerns the bacterial communities (Axenov-Gibanov et al. 2016). Therefore, it becomes important to characterise their composition and diversity in these precious habitats. For instance, the simple quantification of chemicals in the environment is not enough to reveal the real effect of contamination on the aquifer, making necessary the assessment of the biological effects that pollution causes at different hierarchical levels, by considering all criteria for a correct evaluation. But to address important changes in the bacterial assemblages, it is necessary to build databases that can provide information for time-series research in a near future.
For Portuguese karst ecosystems, the information on bacterial composition and diversity is inexistent. Recent molecular approaches such as massive sequencing (Sun et al. 2012) have provided an important advance in understanding extreme environments and allow to study ecosystems where culturing approaches are not suitable. Therefore, for the first time, these molecular approaches were applied in the present work for the study of microbial communities from underground water at the Estremenho Karst Massif (Central-Western Portugal).
The present dissertation was developed within the scope of KARSTRISK project (PTDC/AAC-AMB/114781/2009), which aimed to assess the impact of anthropogenic activities on the groundwater ecosystems from the Estremenho Karst Massif and generate useful information for their protection, emphasising the need to achieve a good knowledge of biodiversity present in karstic areas, where biological communities are usually neglected.
1.3. Dissertation aims
Conducted within the scope of KARSTRISK project (PTDC/AAC-AMB/114781/2009), this study aimed to, for the first time, to identify and characterise the bacterial diversity and composition present in groundwater samples collected from springs, holes and boreholes from the Estremenho Massif, a karst area from Serra de Aire e Candeeiros (Central-Western Portugal). For this purpose, samples were examined using two different culture-independent
5 methods, the PCR-denaturing gradient gel electrophoresis (PCR-DGGE) and Pyrosequencing. Potential similarities between the bacterial diversity of samples were explored in order to assess potential connections among the groundwater sources used in the study, evaluating also a possibility the use of bacterial communities as biological markers for groundwater from karstic ecosystems.
A second aim of the research was the evaluation of potential relationships between bacterial communities composition with pollution from surface anthropogenic activities at the Estremenho massif, for a future potential use as pollution bioindicators.
1.4. State of the Art
1.4.1. Karst areas and aquifersKarst is defined as soluble rocks, the carbonate rocks (especially limestone, dolomite, and marble) and also evaporate rocks (gypsum and rock salt). Carbonate rocks outcrop across about 17.65 million square kilometres of the ice-free (excluding Antarctica, Greenland and Iceland) continental area of the Earth, representing about 13.2% of the world’s land area, but this is just at surface, underground is considered that carbonate rocks involved in karst groundwater circulation extend karst area up to 16% of the world’s land area (Williams 2008). In Europe (excluding Iceland and Russia), carbonate rocks outcrop across about 1.34 million square kilometres representing 21.8% of the Europe’s land area (Williams 2008). In Figure 1 it’s possible to see the distribution of all areas of carbonate rock outcrops in the world.
Karst landscapes are characterised by sinking streams, natural bridges, dry valleys, enclosed depressions, caves, gorges, fluted rock outcrops and large springs, impressive natural landforms produced by rainwater dissolving rock (also known as dissolution) (Ford and Williams 2007). But other natural processes can often interfere, such as glaciation or river erosion, which modifies the karst forms and produces intermediate landscape styles such as glaciokarst, fluviokarst, etc. (Williams 2008).
6 The intimate connection between surface and underground plays a vital role in the structure of subterranean communities due to the exchange processes between surface water and groundwater (Danielopol et al., 2003).
Figure 1 – Karst landscapes outcrops worldwide with subcrop mapped. Solid colour indicates that carbonates are relatively continuous; pale colour depicts areas in which carbonates are abundant but not continuous (adapted from Williams & Ford 2006).
In Portugal continental, 20% of the geographical extension is occupied by aquifers (62 aquifer system), asymmetrically distributed (APA 2015b) and 29 undifferentiated hydrogeological formations, in a total of 91 groundwater bodies distributed by eight different hydrographic regions (with exception of hydrographic regions from Madeira – RH9 and Azores – RH10) (INAG 2005). Three distended aquifers systems can be found in Portugal, the porous, karstic and fractured aquifers.
According to Almeida et al. (1995) the Portuguese carbonate rocks support important karst lands that occupy a considerable area in the Portuguese territory (Figure 3) (Almeida et al. 2000), including the major massif, the Estremenho massif (karst free aquifer) (Figure 4)
7 with 786 km2 total area and 426,79 hm3/year of availability underground water annual (APA
2015a), which constitutes the study area of this thesis.
By law 58/2005, that transposes the Europe Union (EU) Framework Directive to the Portuguese legislation, ten hydrographical regions (RH) – see Figure 2, were established in Portugal for planning purposes: Minho and Lima (RH1); Cávado, Ave and Leça (RH2); Douro (RH3); Vouga, Mondego, Lis and Ribeiras do Oeste (RH4); Tejo (RH5); Sado e Mira (RH6); Guadiana (RH7); Ribeiras do Algarve (RH8) (APA 2015b). The protection of Groundwater against pollution, is regulated by the legislative framework directly associated with the implementation of the WFD (Water Framework Directive) and by the Decree-Law No. 208/2008 of 28 October transposed by directive No. 2006 Relative / 118 / EC, which establishes the protection of groundwater against pollution and deterioration (APA 2015b).
8 Even with all the legislation established, the classification of the water bodies is based on limited information due to the lack of monitoring of various important parameters and lack of representation and inadequate monitoring network in some of the regions for the targeted goals (APA 2015b).
According to the State of Environment Report from 2015, the chemical assessment of the state of groundwater bodies is positive at the national level, with problems of contamination of groundwater in some regions. For the quantitative evaluation of existing underground 91 water bodies, 29 % have a tendency to increase the groundwater level , 35 % reveal stability level , 19% indicate a downward trend the groundwater level and 17% could not perform trend analysis (APA 2015c).
The law defines criteria, to be used in assessing the chemical status of groundwater waterbodies (Arsenio, Cadmium, Lead, Mercury, etc.) but it doesn't define the criteria necessary to fully evaluate the biological communities that can be an important fraction for pollution evaluation.
9 The Estremenho Massif is integrated into the national park of Serra Aire e Candeeiros (Central-Western Portugal), a protected area, created on May 4 of 1979 with an area of 38.900 hectares, which according to EU framework directive is part of RH4 and RH5 from Portugal (APA 2015a).
The region presents a poor soil and water scarce on the surface (APA 2015a). For these reasons, the population and industry have to adapt to difficult natural conditions. Most of the industries can be found near karst springs with very high flow rates, which drain all the water that seeps into the Massif, increasing the pollution impact of aquifers. The modern industry is centred on stone exploitation, intensive pig farming and tanneries, while the traditional economy is based on olive oil production and cattle (ICNF 2015). All of these economic activities were part of economic history of this region without any regulation for decades, contributing to destruction and contamination of soil and habitat, scenic value of the
10 landscape change, decrease of air quality, aquifers contamination, abandoned waste and decrease of the fauna and flora of the area.
The tourism, in the last 30 years, has been also a major economic source in the region, most of it due to the presence of caves, putting at risk this protected areas.
1.4.2. Bacterial communities in groundwater from karst environments
Subterranean communities, like bacteria, have a critical role in the cycling of carbon, nitrogen and other elements (Iron, sulphur, etc..), synthesising natural products and impacting the surrounding organisms and environment (Stewart 2012). Regarding groundwater, the first study relating groundwater contamination with bacterial and virus associated with pit latrines was done in 1937 (Caldwell 1937). Until 1937, there was absolutely no concern regarding groundwater environment contamination. Fortunately, the evolution of methods for studying microbial diversity and the desire to better understand these environments led to an increase of knowledge and understanding of the role of microorganisms in the groundwater environment.
In 1982, Bruce H. Keswick and colleagues (Keswick, Wang, and Gerba 1982) proposed the use of microorganisms as groundwater tracers, an idea that raised after several poisoning outbreaks throughout history directly related to the result of poorly treated or untreated water (Ritter et al. 2002).
Therefore, it is mandatory to determine the presence or absence of microbial pathogens in water, especially in groundwater, as it represents the major source of freshwater in the world, as already described above. Ideally, monitoring for the presence of all pathogens should be made regularly, but this ideal situation is economically unsustainable. Instead, bioindicators microorganisms are employed for this purpose as an easier way to detect and enumerate the bioindicators microorganisms (Lemarchand, Masson, and Brousseau 2004). However, these may not represent the true impacts and changes in microbial communities. This is why the study of whole communities becomes an important direction for further research and monitoring strategies in the future (Goldscheider, Hunkeler, and Rossi 2006), particularly with the increasing use of molecular approaches and the decreasing costs
11 associated with them. However, there is much to study in these particularly environment and information is still scarce (Anantharaman et al. 2016)
Studies conducted worldwide in karst areas, investigated by culture-independent molecular methods analysing samples collected in caves, showed that bacterial composition (Table 2) is dominated by Proteobacteria in all studies reviewed, followed by Acidobacteria, Planctomycetes, Bacteroidetes, Chloroflexi, Nitrospirae, Actinobacteria, Firmicutes. A very interested fact is the similarity between sites so distant like present in two different continents: The Altamira Cave in Spain and Niu Cave in United States of America. This interesting fact can be explained by the strong possibility of these groups, especially the Proteobacteria phylum, being a major key in the role biogeochemical cycles in caves (Zhou et al. 2007).
Even without previous studies in Portugal (regarding bacterial communities) karst areas, a very identical bacterial diversity between karst areas can be expected during this study.
Table 2 - Distribution of bacteria in caves investigated by culture-independent molecular tool. Table adapted from (Zhou, et al. 2007)
1.4.3. Metagenomics approaches for the study of microbial communities
Metagenomics applies a suite of genomic technologies and bioinformatics that can be used to analyse entire microorganism communities by using genetic material collected directly from the environment samples (water, soil, etc.), providing a survey of most microorganisms present, without traditional detection methods based on the use of selective
12 culture, standard biochemical methods or taxonomic analysis (Handelsman 2004). This brings plenty of advantages for bacterial studies, as only a small fraction of the total diversity (>99%) that exists in nature can be cultured in vitro (Stewart 2012; Hugenholtz, Goebel, and Pace 1998).
Experimentally, a typical metagenomics project passes through several steps: experimental design, the sampling processing, sequencing technology, assembly, binning, annotation, statistical analysis and data storage and sharing (Thomas, Gilbert, and Meyer 2012).
Different molecular techniques, analysis software and sources of DNA have been used in metagenomic studies during years. Most of the studies were focused in the relatively short sequences, generally conserved within a species, and often different between bacterial species, the 16S ribosomal RNA sequences (Ellegaard and Engel 2016). However, the fast and substantial cost reduction in next generation sequencing (NGS) has exponentially accelerated the development of sequence-based metagenomics (Thomas, Gilbert, and Meyer 2012; Techtmann and Hazen 2016). The field of metagenomics is still responsible for considerable advances in microbial ecology, evolution, and diversity by allowing to understand the uncultured majority of microbial life.
Pyrosequencing is one of the results of evolution in NGS, which has been used at large scale in metagenomics worldwide and it is still in evolution leading to the rise of new technologies, such as the Ion torrent technology, developed by Thermofisher scientific (Ansorge 2015). Pyrosequencing was developed in 1986, when Pal Nyrén had a simple idea for an alternative DNA sequencing technique to the Sanger method, although the technique was fully developed at the Royal Institute of Technology in Stockholm in 1996 by Mostafa Ronaghi and Pål Nyrén (Metzker 2007). The basic concept of pyrosequencing is to follow the activity of DNA polymerase during nucleotide incorporation into a DNA strand, by analysing the pyrophosphate (PPi) released during the process by proportionally converting it into visible light using a series of enzymatic reactions (Metzker 2007). These enzymatic reactions are monitorised by bioluminescence, which occurs when reactions between PPi and Adenosine-5'-phosphosulfate (APS), releasing ATP. The ATP acts as a substrate for the luciferase-mediated conversion of luciferin to oxyluciferin that generates visible light in
13 proportional amounts to the amount of ATP (Ehn et al. 2004). The light produced in the luciferase-catalysed reaction is detected by a camera and analysed in a program.
The first next-generation system on the market was Genome Sequencer (GS) instrument developed by 454 Life Science in 2005 (Margulies et al. 2005). In this system, the whole genome could be sequenced without any cloning step, after random shearing, specific adaptors would be ligated to the two ends of the DNA fragment, allowing the DNA molecules captured on the surface of a bead to be amplified by emulsion PCRs and isolated within an emulsion droplet. The aim of emulsion PCR is to get enough light signal intensity for reliable detection. The major drawback of GS is the relatively high error rates come from misjudging the length of homopolymer runs result in single base insertions or deletions. The relatively high cost of operation and generally lower throughput are the main limitations of the method (Life Science 2014), but the information output generated from sequencing is far better than the traditional cultured-based methods or previous culture-independent techniques such as Denaturing Gradient Gel Electrophoresis (DGGE).
The pyrosequencing technique brought an innovative vision to study more effectively the genomics of the microorganisms, and for years, it was one of the greatest contributor technique, to metagenomics. However, new technologies with different principles, from pyrosequencing rise every day contributing for a better, faster and cheapest away to sequence genetic material. For instance, Illumina platform provides a high throughput at a smaller and more modestly priced platform and the nanopore sequence technique (Oxford nanopore platform), single-molecule real-time (SMRT) technology (Pacific Biosystems) (Ansorge 2015).
Nowadays, the biggest challenge in this area is the management of large amounts of information. In the case of metagenomics, it’s inevitable the automation of the analysis process in the future, in a more efficient and less time-consuming manner, making the analysis that currently takes days/weeks in a few hours. But for now lot of effort continues to be needed to analyse data from microbial diversity, using software such as MLST (http://www.mlst.net/); MOTHUR (http://www.mothur.org/); EstimateS (http://viceroy.eeb.uconn.edu/EstimateS/); PHACCS (http://phaccs.sourceforge.net/); or QIIME (http://qiime.org/) (Schloss et al. 2009; Caporaso et al. 2010; Angly et al. 2005).
14 QIIME (Quantitative Insights Into Microbial Ecology) was the open-source software pipeline selected to analyse microbial diversity in this study, that processes data from a high-throughput 16S rRNA sequencing (such as pyrosequencing) and performs microbial community analysis, solving the problem of taking sequencing data from raw sequences to interpretation and database deposition (Caporaso et al. 2010). It can be used to analyse and interpret nucleic acid sequence data from bacteria, fungal, viral and archaeal communities (Kuczynski et al. 2011).
The analyses consist of typing a series of commands into a terminal (Linux OS), generating textual and graphical output data (Kuczynski et al. 2011) using the raw data generated in the Roche/454 platform. Three files are generated, FASTA file (.fna), that contains the sequence converted from the original flowgrams (light signal strength), the Quality Scores (.qual), which contains a score for each base in each sequence include in the FASTA file, and finally the Mapping File (.txt), that holds all samples information necessary to perform data analyses (Kuczynski et al. 2011). In the next step, the samples are assigned to the multiplex reads based on barcodes, performing a quality filtering removing low-quality and ambiguous reads. At this stage the most frequently used practice for organizing fine scale bacterial diversity is to cluster sequences exclusively on the basis of DNA sequence similarity at a conserved locus (Koeppel and Wu 2013), the cluster sequences called Operational Taxonomic Units (OTUs), allowing picking a representative sequences from each OTU-based on their sequence similarity. By default, QIIME, the sequences are clustered at 97% sequence similarity (Kuczynski et al. 2011), resulting cluster typically thought of as representing a biological species.
Several studies using metagenomics for the study of groundwater environments have been published (Moss, Nocker, and Snyder 2011; Hemme et al. 2015; Zhou et al. 2007; Schabereiter-Gurtner et al. 2002a; Schabereiter-Gurtner et al. 2002b; Schabereiter-Gurtner et al. 2004), highlighting the usefulness of this approach to characterize environments where most organisms from microbial communities are not possible to grow in laboratory cultures making molecular culture-independent methodologies very import for metagenomic studies. For Portugal, much information on bacteria from groundwater ecosystems is still inexistent, which makes the present study an important first screen basis.
15
2. Materials and Methods
2.1. Sampling
A set of 22 groundwater samples were collected from boreholes, wells, a river and water springs from the Estremenho Karst Massif, located in Central-Western Portugal.
As described above, the Estremenho Massif belongs to the national park of Serra Aire e Candeeiros (Central-Western Portugal), a protected area of 38.900 hectares and it is the major karst massif in Portugal with a karst free aquifer of 786 Km2 with an underground water
availability of 426.79 hm3/year (APA 2015a). There are several pressures related to potential
pollution from industrial and agriculture activities. The location name of sampling sites, the different water volumes collected, also the land cover/land cover, geographic coordinates, sampling date and deep of collection (not always possible to measure), all of this data was synthesised in Table 3. The sampling sites are marked on the map in Figure 5.
This sampling campaign was conducted in February 2013.
2.2. DNA extraction
Total DNA from environmental water samples was extracted as follows: water samples (volume ranging from 500 to 5000mL, depending on the filter clogging) were filtered through 0.20µm polycarbonate sterile filters, resuspended in 2 ml of TE buffer [10 mM Tris–HCl, 1 mM EDTA, pH 8.0] and centrifuged; lysozyme was added after resuspension in 200µl of TE buffer and incubation was performed at 37ºC for 1 h; the following DNA extraction and purification were carried out using the Genomic DNA Purification Kit (MBI Fermentas, Vilnius, Lithuania); 600 µL of chloroform were added and mixed by inversion and centrifuged at the highest velocity for 10 minutes; the aqueous phase was transferred to new tube and 1 volume of isopropanol was added , mixed by inversion and incubated at 4ºC for 30 minutes, following centrifugation at the highest speed for 30 minutes; the supernatant was discarded and
16
Table 3 - Sampling and location sites, sample type, type of land cover/land cover, geographic coordinates, sampling deep and date of collection.
Site Location Sample type Land cover/land use
Lisboa Hayford gauss Igeoe Deep
(m)
Sampling Date
M X PY
K01 Alviela Spring Water spring Forest area 150043,00 275614,00 34 27FB12 K02 Amiais riverside River Forest area 150166,02 276674,22 22 27FB12 K03 Almonda Spring Water spring Forest area 158424,00 282140,00 12 27FB12 K04 Nascente do Lena Water spring Forest area 140961,00 290852,00 24 18FB12 K06 Fountain – Lis spring Water spring Forest area 145277,58 302236,27 30 18FB12 K07 Well da Ribeira do Lena Well Agricultural area 140969,26 290865,96 19 18FB12 K08 Fountain Alqueidão da
Serra Bore Forest area 143702,33 294962,89 15
18FB12
K09 Chiqueda Bore Forest area 129725,28 286042,20 32 19FB12 K10 Moleanos Bore Forest area 132786,05 283365,49 - 19FB12 K11 Lagoa do Furadouro Bore Industrial and urban area 163802,41 294925,68 120 27FB12 K13 Giesteira Bore Forest area 153897,27 292004,6 169 27FB12 K15 Fátima Bore Industrial and urban area 155331,69 294570,35 277 27FB12 K16 Fátima Bore Agricultural area 152362,52 296468,00 400 18FB12 K18 Valverde - Alcanede Bore Industrial and urban area 138293,22 275809,88 350 20FB12 K19 Valverde - Alcanede Bore Industrial and urban area 138286,06 276022,14 114 20FB12 K20 Serra de Stº António Bore Agricultural area 149536,33 282273,46 250 20FB12 K21 Covão do Feto Bore Agricultural area 151533,56 280899,31 - 20FB12 K22 Covão do Coelho Bore Forest area 153962,90 284350,89 404 20FB12 K23 Tremoceira - Pedreiras Bore Agricultural area 137234,47 293210,57 200 19FB12 K24 Casais de Santa Teresa Bore Industrial and urban area 135647,01 289282,98 220 19FB12 K25 Moita well Bore Forest area 129700,86 276314,14 - 18FB12
17 Fi gur e 5 – C o lle c tio n si te s in Se rr a de Ai re e C and e e iro s (M ac iç o C al c a rio E st re m e nho ) and r e pr e se n tat io n o f land c o ve r. At r e d the ur ba n ar e as ; Y e llo w the ag ric u ltur al ar e as ; G re e n the fo re st ar e a s.
18 resuspension of pellet was made in 100 µL of NaCl 1.2M; 2,5 volumes of absolute ethanol at -20ºC were added and mixed by inverting, incubating at --20ºC for 30 min and centrifugation at the highest speed for 30 min; the supernatant was discarded and the pellet was washed with 200 µL ethanol 70%; the pellet was dried and resuspended in TE buffer and stored at-20ºC.
2.3. PCR-DGGE
2.3.1. PCR amplification of bacterial 16S rDNA fragments
Polymerase chain reaction (PCR) amplification of bacterial 16S rRNA gene fragments was performed with the primers 338F-GC actcctacgggaggcagcag-3′) and 518R (5′-attaccgcggctgctgg-3′) (Muyzer et al. 1993). Primers were synthesised by STABVida (Oeiras, Portugal). PCRs were performed in a Bio-Rad iCycler Thermal Cycler (Bio-Rad Laboratories, Hercules, California, USA) with a 35µl reaction volume with DreamTaq DNA Polymerase (Thermo Scientific) DNA polymerase. The PCR program had an initial denaturation step at 94ºC for 5 minutes followed by 30 cycles of 30 seconds at 92ºC, 30 seconds at 55ºC and 30 seconds at 72ºC, and a final extension step at 72ºC for 30 minutes. Negative control reactions without any template DNA were performed simultaneously and the size of amplicons was verified by electrophoresis in a 1.5% agarose gel (SeaKem LE Agarose) using 100bp Plus DNA ladder as molecular weight marker (Vivan Technologies) and RedSafe Nucleic Acid staining solution by iNtRON biotechnology. The gel was visualised on an Ultra Violet (UV) transilluminator
In order to solve the low amplification in some samples, a nested-PCR was performed, using the same pair of primers and the PCR amplicon from the first sequencing as DNA template.
2.3.2. Denaturing gradient gel electrophoresis (DGGE)
PCR products were analysed through DGGE using a 35–60% denaturing gradient (100% denaturing gradient is 7 M urea and 40% deionized formamide) in 1 mm vertical polyacrylamide gels (8% [wt/vol] acrylamide in 0.5× TAE buffer). Electrophoresis was
19 performed in a DCode™ universal mutation detection system (Bio-Rad Laboratories, Hercules, California, USA) using 1× TAE buffer containing 40 mM Tris, 20 mM acetic acid and 1 mM EDTA (pH 8.0) during 17 hours and 30 minutes at 75 V. The gel was then stained for 5 minutes in an ethidium bromide solution (5%) and visualized on a UV transilluminator.
Image digitalization was performed using a Molecular Imager FX™ system (Bio-Rad Laboratories, Hercules, California, USA). For image analysis, the BIO-RAD software was used to determine correspondent bands and relative intensity of each band per lane. Cluster analysis of bands distribution was performed using the unweighted pair group mean average (UPGM) method based on the Bray-Curtis similarity coefficient and Metric Multidimensional scaling (MDS) with PRIMER 6 software (Clarke & Gorley, 2006).
2.4. Pyrosequencing
2.4.1. SequencingSamples showing a high yield in PCR amplification were chosen for pyrosequencing. Pyrosequencing libraries were obtained using the 454 Genome Sequencer FLX platform (Roche Diagnostics Ltd, West Sussex, UK). This allows the sequencing of a whole genome without any cloning step (Margulies et al. 2005). After random shearing, specific adaptors will be ligated to the two ends of the DNA fragment, allowing the DNA molecules captured on the surface of a bead to be amplified by emulsion PCRs and isolated within an emulsion droplet. The aim of emulsion PCR is to get enough light signal intensity for a reliable detection.
In the present study, bacterial 16S rRNA gene fragments from the V3V4 hypervariable region were amplified using barcoded fusion primers with the Roche-454 Titanium sequencing adapters A and B (an eight-base barcode sequence), the forward primer 5’– ACTCCTACGGGAGGCAG-3’ (338F) and the reverse primer 5’– TACNVRRGTHTCTAATYC -3’ (802R) (Wang and Qian, 2009). PCR reactions were amplified in 20 µL reactions with Advantage Taq (Clontech) using 0.2 M of each primer, 0.2 mM dNTPs, 1X of polymerase mix, 6% DMSO and 1-2 µL of template DNA. The PCR conditions were 94ºC for 4 minutes, followed by 25 cycles of 94ºC for 30 seconds, 44ºC for 45 seconds and 68ºC for 60 seconds and a final
20 elongation step at 68ºC for 10 minutes. The amplicons were quantified by fluorometry with PicoGreen (Invitrogen, CA, USA), pooled at equimolar concentrations and sequenced in the A direction with GS 454 FLX Titanium chemistry, according to manufacturer’s instructions (Roche, 454 Life Sciences, Brandford, CT, USA) at Biocant (Cantanhede, Portugal).
2.4.2. Sequences analysis using QIIME
Barcoded pyrosequencing libraries were analysed and processed using QIIME package software (Caporaso et al. 2010) in a virtual machine, Oracle VM VirtualBox (Version 5.0.22 r108108). The QIIME analysis consists of typing a series of commands into a terminal (Linux OS), generating textual and graphical output data (Kuczynski et al. 2011) using for microbiome analysis from raw DNA sequencing data. The analyses was performed as previously described in (Cleary et al. 2015). QIIME, fasta and qual files were used as input for the split_libraries.py script, which contains a score for each base in each sequence include in the FASTA file and finally the Mapping File (.txt), that holds all samples information necessary to perform data analyses (Kuczynski et al. 2011). Backward primers were removed using the 'truncate only' argument and a sliding window test of quality scores was enabled with a value of 50 as suggested in the QIIME description for the script. In addition to user-defined cut offs, the split_libraries.py script performs several quality filtering steps (http://qiime.org/scripts/split_libraries.html). OTUs were selected using UPARSE with usearch7 (Edgar 2013). The UPARSE sequence analysis tool (Edgar 2013) provides clustering, chimera checking and quality filtering on de-multiplexed sequences. Chimera checking was performed using the UCHIME algorithm, which is the fastest and most sensitive chimera checking algorithm currently available (Edgar et al. 2011). The quality filtering as implemented in usearch7 filters noisy reads and preliminary results suggest it gives results comparable to other denoisers such as AmpliconNoise, but is much less computationally expensive (http://drive5.com/usearch/features.html; last checked 2016-10-05). First reads were filtered with the fastq_filter command and the following arguments fastq_trunclen 250 -fastq_maxee 0.5 -fastq_truncqual 15. Sequences were then dereplicated and sorted using the derep_fulllength and sortbysize commands. OTU clustering was performed using the
-21 cluster_otus command. An additional chimera check was subsequently applied using the uchime_ref command with the gold.fa database (http://drive5.com/uchime/gold.fa). AWK scripts were then used to convert the OTUs to QIIME format. In QIIME, representative sequences were selected using the pick_rep_set.py script in QIIME using the 'most_abundant' method. Reference sequences of OTUs were assigned taxonomies using default arguments in the assign_taxonomy.py script in QIIME with the rdp method (Wang et al. 2007). In the assign_taxonomy.py function, we used a fasta file containing reference sequences from the Greengenes 13_5 release for and the rdp classifier method. We used a modified version of the taxonomy file supplied with the Greengenes 13_5 release to map sequences to the assigned taxonomy. Finally, we used the make_otu_table.py script in QIIME to generate a square matrix of OTUs x samples.
Closely related organisms of numerically abundant OTUs were identified using the NCBI Basic Local Alignment Search Tool (BLAST) command line 'blastn' tool with the -db argument set to nt (Z. Zhang et al. 2000).
2.4.3. Statistical analyses
The rarefaction curve was determined using PAST software (Hammer et al. 2001). Cluster analysis of OTUs was performed using the unweighted pair group mean average (UPGM) method based on the Bray-Curtis similarity coefficient and Metric Multidimensional scaling (MDS) with PRIMER 6 software (Clarke & Gorley, 2006).
22
3. Results and Discussion
3.1. PCR
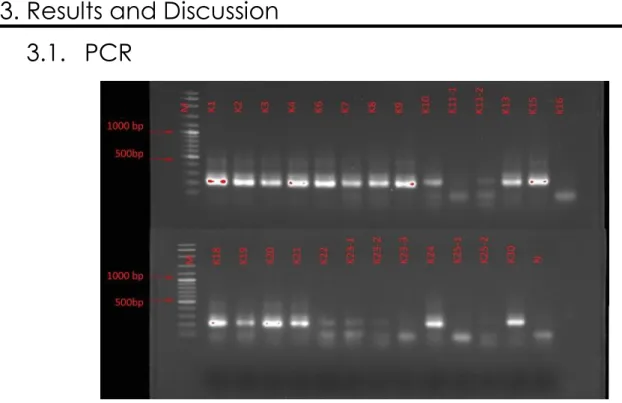
A nested-PCR was performed for all samples due to the initial low yield of amplification. After this nested-PCR (Figure 6) using the same primers 338F-GC and 518R, the gel showed the existence of the anticipated target fragments for samples K01, K02, K03, K04, K06, K07, K08, K09, K10, K13, K15, K18, K19, K20, K21, K24, K30. For samples K10, K11-1, K11-2, K16, K22, K23-1, K23-2, K23-3, K25-1, K25-2 there were very weak or lacking bands corresponding to the desired region (±200 bp). Samples K11, K23 and K25 were divided into sub-samples, during filtering, because of the presence of debris/soil that clogged very quickly the 0.20µm holes of the polycarbonate sterile filters.
The low or no amplification of this specific samples, lead to assume three plausible ideas. First, the possibility of low or completely absence of bacteria DNA in this samples amplified. Second, in the samples K11, K23 and K25, it was clear the presence of soil/debris in the water collected, once the water was turbid what made very complicated to filter the water, resulting in a low volume filtered, for these samples, but not explaining the absence/low content of DNA in the samples K10, K16, K22 which were not subjected to a sub-division during filtration. Thirdly, the presence of PCR inhibitors, a group of substances, with different properties and mechanisms of action, which interact with DNA template and the polymerase, preventing the
Figure 6 – Agarose gel (1,5%) electrophoresis of PCR products; Samples K1 to K30; Molecular size marker is marked with the letter M the Negative with the letter N
23 enzymatic reaction (Wilson 1997). Substances like debris, fulmic acids and humic acids while described, predominantly found in water/environment samples (Abbazadegan et al. 1993; Marian Ijzerman, Dahling, and Shay Fout 1997). These questions should be addressed in the future in sampling design and DNA extraction from similar water samples.
3.2. 16S rDNA-DGGE band patterns and cluster analysis
For DGGE analysis, a gel covering a total of 16 samples was carried out with the amplicons from the previous PCR using primers 338F_CG/518R (Figure 7). This resulted in a complex DGGE profiles from which a total of 228 bands could be detected, corresponding to 42 different band migration positions. DGGE band patterns were very complex to interpret
Figure 7 - PCR-DGGE profiles containing the bacterial 16S rDNA fragments from water samples k1, k2, k3, k4, k6, k8, k9, k13, k15, k18, k19, k20, k21, k24, k30 collected at Estremenho Kast Massif during February 2012
24 although, for samples K1, K2, K4, K6 and K9, DGGE profiles could be more clear, having visible common peaks and clearly there were several DGGE dominant bands that could be detected across samples’ profiles. However, there were many weak bands corresponding to individual bacterial identities that resulted in a smear. For samples K7, K8, K13, K15, K19; K21 and K24, the profiles were not so clear and dominant bands were not so evident. These constrain made difficult to make bands correspondence analysis. This is one of the problems with DGGE band profiles analysis. There is also the fact that DGGE is based on the assumption that all samples have the same DNA content for PCR amplification, which is definitely not the case in these samples, where even the volume of filtration depended on several factors such as the suspended solids that rapidly clogged the filters. In fact, for some samples, the filter did not even clog after filtering 5L of water sample. This is a problem related to water samples from pristine water environments, where the abundance of organisms is very low (Goldscheider, Hunkeler, and Rossi 2006) and results in a low DNA extraction. Due to these gel analysis constraints, only most dominant bands (above 0.5% relative intensity in each lane) were considered for cluster analysis (using the Bray-Curtis similarity coefficient) – see Figure 8 and data matrix in Annex Table 1.
On the other hand, in spite of the bands/peaks and migration positions from DGGE gel profiles can correspond to individual microbial identities and the band intensities to their relative quantity (T. Zhang and Fang 2000), this does not mean that it is always valid to assume that one band refers to a specific genome, they are an indicative approach only. Moreover, two sequences that differ only by 2 base pairs may show indistinguishable band migration points in DGGE gels, which highlights one more limitation of using this technique (Jackson et al. 2000).
Besides the common disadvantages associated to traditional DNA-based techniques (DNA extraction efficiency; PCR errors; contaminations introduction, etc. (Muyzer 1999) another big disadvantage is associated to this technique, the difficulty of obtaining the bacterial identity correspondence to each band. This problem can be surpassed through NGS, approaches, making possible a more accurate association to specific bacteria, avoiding the time-consuming bands excision, cloning and Sanger sequencing procedures.
25 Nevertheless, DGGE has shown to be a valuable screening technique for assessing and compare the biodiversity among samples in a more affordable way and it is still used as a basis for further NGS analysis (Braun et al. 2016; Cleary et al. 2012).
Figure 8 – Bray-Curtis similarity. Cluster dendrogram, with slicing at 40% similarity.
26 After the results from Cluster analysis, it was clear that samples K1 and K2 showed the highest similarity, with 73.27%. This is not surprising, as these samples are very close geographically and share the same water origin (K2 rises to surface from K1). At this Massif, rivers are not perennial. Instead, they are temporary streams that arise to surface from springs (Rodrigues and Fonseca 2010), which explains the almost identical bacterial composition between K1 and K2. However, K3 also showed an important percentage of similarity (66.84%) with both these samples, in spite of its relatively distant location. This may somehow suggest an underground connection between samples K1 and K3, which are both water springs, and considering the high complexity of galleries and conduits in the massif (Rodrigues and Fonseca 2010; Hoffmann et al. 2013) this would not be such a surprise. Contrarily, K7 was the sample with less similarity (15.19%) with all the other samples; it is a well with a low depth, which can be easily impacted by surface pollution pressures that can dramatically influence the bacterial communities present in it. However, geochemical analyses (unpublished data) did not show dramatic different environmental variables in relation to samples K1 to K3, except for a higher value for ORP (oxidation reduction potential), which is a parameter reported to have an influence on the distribution of particular bacteria (Lu, Wilson, and Kampbell 2006).
At 35% similarity it was visible, the formation of three groups by MDS analysis (Figure 9), A (K01, K02, K03, K04, K06, K09), B (K15, K18) and C (K21, K24, K30). In these cases, the land use of the surrounding areas may also have a relevant impact on the specific bacterial communities’ composition, as group A is exclusively surrounded by forest areas and B and C groups by agricultural and industrial/urban areas.
However, group A samples showed faecal contamination (unpublished data) which indicates an impact from surface anthropogenic pollution and will surely have a major role in the composition and diversity of their bacterial assemblages (Hemme et al. 2015; Anantharaman et al. 2016). On fact, most of these samples were collected at surface and the impact should be expected due to the direct interactions with surface environments. Group B samples were collected in boreholes and they are characterised by pristine environments but very high conductivity values, near 2000 S cm-1 (unpublished data), which is also
characteristic from deep groundwater samples. Samples from group C were also collected from boreholes and are characterised by moderate conductivity and also no faecal
27 contamination (unpublished data). Therefore, there are many environmental variables that can influence the bacterial assemblages in groundwater ecosystems, which changes its diversity in order to respond to the new biogeochemical contexts that arise from the pollutants impact and dramatically changing the bacterial communities present (Hemme et al. 2015).
3.3. Pyrosequencing
Based on the first screening of bacterial diversity and intensity of band profiles provided by PCR-DGGE results (diversity and intensity of profiles) it was decided to send for sequencing only 13 samples: K01, K02, K03, K04, K06, K07, K08, K09, K15, K18, K19, K20, K24.
Cluster analysis of Sequence data
From the cluster (Bray-Curtis Similarity) and MDS analysis of pyrosequencing data (Figure 10, Figure 11 and Annex Table 2), it was clear the formation of a major group A (including samples K01, K02, K03, K04, K06 and K09) at 35% of similarity. This clustering of samples was already suggested by the cluster analysis using PCR-DGGE data (Figure 8), showing a strong connection between samples K01, K02, K03, K04 and K09. However, with pyrosequencing data, there was no establishment of other groups, as suggested by PCR-DGGE profiles, with sample K15 completely isolated from the other samples (only with 0.78% similarity).
28
Figure 10 –Cluster showing OTU similarity between site samples (relevance >1%) with Bray-Curtis distance.
Figure 11 - Metric Multidimensional scaling (MDS) with resemblance level of 35%. The sample K15 was excluded.
OTU richness
The rarefaction curves of the 13 samples sequenced, as shown in Figure 12, provide the OTU richness for each sample, given a sampling depth (i.e. number of individuals/sequences per sample). Samples K01, K02, K04, K06, K09, K20 showed a medium OTU richness with a low number of sequences per OTU. By comparing to DGGE results, these samples showed, in fact, some few clear dominant bands (smear bands) in corresponding profiles showing a consistency in diversity across both molecular approaches. Samples K03, K24, K18, reveal also a medium OUT richness, but more sequences attributed to each OTU. Noticing that sample k15 showed the lowest OTU richness and the highest number of sequences (1592) suggesting the presence of one or very few bacterial groups, data supported by DGGE where actually showed the dominance of one main band. On the other hand, it was evident the highest richness was observed for samples K19 and k07, with 603 OTUs for 1573 sequences reads and 481 OTUs and 1142 sequences reads, respectively, both samples having the lowest concentration of sequences (less than 50 sequences) per OTUs. In DGGE gel image, this was also visible, with no major dominant bands in their profiles.
29
Figure 12 - Rarefaction curves of the 13 samples. The error bars show 95%confidence of upper and lower limits
Compositional sequence analysis
Barcoded pyrosequencing analysis yielded 16426 sequences, which were assigned to 1729 OTUs after quality control, OTU picking and removal of chimaera, sequences not assigned to the Bacteria domain and chloroplasts.
Those OTUs were assigned to 32 phyla, of which Proteobacteria (61.83%, 1069 OTUs) was by far the most abundant phylum in terms of sequences and OTUs (Figure 13). Besides the Proteobacteria, other phyla that were represented by at least ≥1% of total OTUs, included Bacteroidetes (5.84%, 101 OTUs), Actinobacteria (4.86%, 84 OTUs), Acidobacteria (4.40%, 76 OTUs), Firmicutes (3.82%, 66 OTUs), Elusimicrobia (3.07%, 53 OTUs), Nitrospirae (2.54%, 44 OTUs), Gemmatimonadetes (1.97%, 34 OTUs), GN02 (1.16 %, 20 OTUs) and TM7 (1.16%, 20 OTUs). 50 OTUs remained unclassified at the phylum level, representing 2.89%.
30
Figure 13 – Distribution of the major phyla (with more than 3%) and unclassified OTUs at phylum level. The 6 groups attending, represent 83,81% of all the phyla in the samples collected.
At Class level, a total of 79 classes were assigned. Only 13 classes were assigned at ≥1% of total OTUs. The four dominant classes (Figure 14) were: Betaproteobacteria (16.14%, 271 OTUs), Deltaproteobacteria (15.78%, 265 OTUs), Alphaproteobacteria (15.19%, 255 OTUs) and Gammaproteobacteria (14.65%, 246 OTUs). Also, there were 8 classes with less than 3%, the Nitrospira (2.62%, 44 OTUs), Elusimicrobia (2.32%, 39 OTUs), Clostridia (2.03%, 34 OTUs), Acidimicrobiia (1.97%, 33 OTUs), Bacilli (1.85%, 31 OTUs), Sphingobacteriia (1.85%, 31 OTUs), Thermoleophilia (1.85%, 31 OTUs), Acidobacteria-6 (1.61%, 27 OTUs), Saprospirae (1.25%, 21 OTUs), Actinobacteria (1.07%, 18 OTUs), Flavobacteriia (1.01%, 17 OTUs) and 3.75% remain unclassified at class level (63 OTUs).
0 200 400 600 800 1000 1200 N um b e r o f O TU s Proteobacteria Bacteroidetes Actinobacteria Acidobacteria Firmicutes Elusimicrobia Unclassified
31
Figure 14 - Distribution of the major Classes (with more than 3%) unclassified. The 4 groups attending, represent 61,76% of all the classes in the samples collected
At order level, 117 Orders were assigned. At this level, the percentage of unclassified bacteria was 16.40% (265 OTUs). Above 3% of total OTUs, 5 orders were assigned (Figure 15), the Burkholderiales (7.43%, 120 OTUs), Myxococcales (6.56%, 106 OTUs), Xanthomonadales (3.37%, 61 OTUs), Legionellales (3.47%, 56 OTUs), Rhodospirillales (3.16%, 51 OTUs). With less than 3% of representation, the Rhizobiales (2.78%, 45 OTUs), Nitrospirales (2.72%, 44 OTUs), Rhodocyclales (2.41%, 39 OTUs), Clostridiales, Pseudomonadales and Rickettsiales (2.10%, 34 OTUs), Acidimicrobiales (2.04%, 33 OTUs). With less than 2% the Sphingobacteriales (1.92%, 31 OTUs), Spirobacillales (1.79%, 29 OTUs), Sphingomonadales (1.67%, 27 OTUs), Elusimicrobiales (1.61%, 26 OTUs), MND1 (1.49%, 24 OTUs), Syntrophobacterales (1.42%, 23 OTUs), BD7-3 (1.36%, 22 OTUs), [Saprospirales], Bacillales and Gaiellales (1.30%, 21 OTUs), Bdellovibrionales and Alteromonadales (1.24%, 20 OTUs), Actinomycetales (1.11%, 18 OTUs), Flavobacteriales, iii1-15 and Rhodobacterales (1.05%, 17 OTUs).
0 50 100 150 200 250 300 N um b e r o f O TU s Betaproteobacteria Deltaproteobacteria Alphaproteobacteria Gammaproteobacteria Unclassified
32
Figure 15 - Distribution of the major Orders (with more than 3%) and unclassified OTUs at Order level. The 5 groups attending, represent 24,38% of all the Orders in the samples collected.
At Family level, a total of 117 families were assigned, with 36.42% (492 OTUs) as unclassified. At ≥1% of total OTUs, 16 families were allocated. Comamonadaceae (7.33%, 99 OTUs), Rhodospirillaceae (3.48%, 47 OTUs), Rhodocyclaceae (2.89%, 39 OTUs), Xanthomonadaceae (2.37%, 32 OTUs) and Sinobacteraceae (2.07%, 28 OTUs) were the most dominant (Figure 16) With less than 2%, Moraxellaceae (1.78%, 24 OTUs), Hyphomicrobiaceae (1.63%, 22 OTUs), Coxiellaceae and Syntrophobacteraceae (1.55%, 21 OTUs), Sphingomonadaceae (1.41%, 19 OTUs), Gaiellaceae (1.26%, 17 OTUs), Legionellaceae (1.18%, 16 OTUs), Clostridiaceae (1.18%, 16 OTUs), Haliangiaceae, Nitrospiraceae and Oxalobacteraceae (1.04%, 14 OTUs) were recorded.
0 50 100 150 200 250 300 N um b e r o f O TU s Burkholderiales Myxococcales Xanthomonadales Legionellales Rhodospirillales Unclassified