European Heart Journal: Acute Cardiovascular Care 2015, Vol. 4(2) 172 –179
© The European Society of Cardiology 2014 Reprints and permissions:
sagepub.co.uk/journalsPermissions.nav DOI: 10.1177/2048872614547690 acc.sagepub.com EUROPEAN SOCIETY OF CARDIOLOGY®
Introduction
Red Blood Cell Distribution Width (RDW) represents the coefficient of variation of the red blood cell volume distri-bution width and can be considered an index of heterogene-ity, the equivalent of anysocitosis observed in the peripheral blood smear. It is routinely reported as part of the complete blood count, but its use is generally restricted to narrowing the differential diagnosis of anaemia. Higher RDW is asso-ciated with mortality in patients with heart failure, stable coronary artery disease, acute coronary syndromes (ACS),
Predictive impact on
medium-term mortality of hematological
parameters in Acute Coronary
Syndromes: added value on top of
GRACE risk score
Ana T Timóteo
1, Ana L Papoila
2,3, Ana Lousinha
1,
Marta Alves
3, Fernando Miranda
4, Maria L Ferreira
1and Rui C Ferreira
1Abstract
Background: Red Cell Distribution Width (RDW) prognostic value in patients with Acute Coronary Syndrome (ACS)
has been well validated whereas that of Platelet Distribution Width (PDW) is less well known.
Objectives: Investigate the incremental prognostic value, on top of GRACE risk score, of a new variable resulting from
the combination of RDW and PDW.
Methods: Consecutive patients with ACS. Complete blood count, with RDW and PDW, was obtained. Primary
endpoint was one-year all-cause mortality and Cox regression models were used to measure the influence of RDW and PDW on patients’ survival time. A new combination categorical variable (RDW/PDW) was created with both discretized RDW and PDW and logistic regression models were used. Predictive value and discriminative ability of the model with GRACE risk score alone and of the model with inclusion of RDW/PDW was assessed.
Results: We included 787 patients. Hospital and one-year mortality rates were 5.1% and 7.8%, respectively. Both
continuous RDW and PDW were independent predictors of death. The best cut-off for RDW was 13.9%, and 14.5% for PDW. Inclusion of RDW/PDW in a model with GRACE risk score improved the AUC from 0.81 (95% CI 0.75–0.86) to 0.84 (95% CI 0.79–0.90) (p=0.024) with an improvement in total NRI (56%) and IDI (0.048).
Conclusions: Simple markers such as RDW and PDW can be useful in risk stratification of death after ACS. Combining
both markers with GRACE risk score improved the predictive value for all-cause mortality and reduced the estimated risk of those who did not die.
Keywords
Acute coronary syndromes, GRACE risk score, platelet distribution width, prognosis, red blood cell distribution width
Received: 25 Jun 2014; accepted: 28 Jul 2014
1 Cardiology Department, Santa Marta Hospital, Centro Hospitalar
Lisboa Central, Portugal
2 CEAUL, Biostatistics Department, Medical Sciences Faculty, New
University of Lisbon, Portugal
3 Epidemiology and Statistics Unit, Reserch Centre, Centro Hospitalar
Lisboa Central, Portugal
4 Clinical Pathology Department, Santa Marta Hospital, Centro
Hospitalar Lisboa Central, Portugal
Corresponding author:
Ana Teresa Timóteo, Cardiology Department, Hospital Santa Marta, Rua Santa Marta, 1169-024 Lisbon, Portugal.
Email: [email protected]
in patients undergoing percutaneous coronary revasculari-zation and also in the general population.1–7
Platelet Distribution Width (PDW) represents a similar measurement applied to platelets. Platelets have been implicated in the pathogenesis of cardiovascular disorders, including atherosclerosis and its complications, such as ACS.8,9 However, the evidence for mortality prediction is
scarce when compared to RDW, with very few biblio-graphic references on the subject.
The Global Registry of Acute Coronary Events (GRACE) risk score is a validated and established score for risk stratification of patients with ACS, obtained from a multicentre registry.10 This score is based on several
clini-cal and laboratorial variables and is used worldwide with a very good predictive value.
We sought to investigate the predictive value of each haematological marker individually, as well as the poten-tial incremental prognostic value, on top of GRACE risk score, of a new variable that resulted from a combination of both markers (RDW/PDW), because the prognostic information from both variables might potentiate prognos-tic predictiveness.
Population and methods
This is a cohort study of consecutive patients admitted to our Intensive Care Unit with ACS (with and without ST-segment elevation) during the years 2008 through 2010. Data was collected prospectively and recorded on a com-puter database of ACS patients admitted to our institution’s Intensive Care Unit. Inclusion criteria were a history of chest pain at rest or other symptoms suggestive of an ACS, with the most recent episode occurring within 24 hours of admission. This could be associated with new or presumed new significant ST-segment – T wave changes/new left bundle branch block or elevated levels of biomarkers of myocardial damage (cardiac troponin I and creatinine kinase). Myocardial infarction was defined by a rise and/or fall of cardiac troponin I with at least one value above 0.06 ng/mL. We evaluated demographic characteristics of the patients, risk factors for coronary artery disease, previous cardiac history and vital signs on admission as well as in-hospital treatment. Blood samples were obtained on admis-sion. We used automated laboratory equipment (Beckman Coulter Automated CBC Analyzer – LH 750™) for haema-tological evaluation. Normal reference range for RDW in our laboratory is 11.5%–15.5% and for PDW is 9.0%– 17.0%. Patients with increased RDW and PDW were defined by a cut-off obtained with the statistical analysis described below.
Hypertension, diabetes and hyperlipidemia were defined as either previously known or on specific therapy. Patients that smoked during the previous six months were classified as smokers and were self-reported. Estimated glomerular filtration rate (GFR) was calculated according to the
Cockcroft-Gault formula.11 For each patient, a numerical
classification according to the previously described GRACE risk score was calculated from the initial clinical history, electrocardiogram and laboratory values collected at admission.10
Follow-up was obtained for every patient that survived to discharge by reviewing the medical records and/or by telephone interview with the patient or family members at 30 days and one year after admission. Follow-up informa-tion was obtained in 99.8% of the patients. The study pri-mary endpoint was all-cause mortality at the one-year follow-up.
The study complies with the Declaration of Helsinki and informed consent was obtained from all the subjects.
Statistical analysis
Continuous variables were presented as mean or median, standard deviation or inter-quartile range (25th–75th per-centile), as required. Normality and homogeneity of vari-ances were tested by Kolmogorov-Smirnov test and Levene test, respectively. Groups were compared with ANOVA or with the non-parametric Kruskal-Wallis test whenever appropriate. Categorical data were presented as frequencies and percentages and Pearson’s Chi-squared test or Fisher’s exact test, were used.
The primary endpoint was one-year all-cause mortality and univariable and multivariable Cox proportional haz-ards regression models were used to measure the individual influence of RDW and PDW on the survival time. To test for proportional hazards assumption, Schoenfeld’s global test was used. A global measure of concordance was also calculated.
Moreover, considering death within one-year follow-up, the best cut-off points of both parameters (RDW and PDW) were selected by maximizing the sum of sensitivity and specificity. A code was given for each variable: 0 = below cut-off; 1 = above or equal to cut-off. A new categorical variable RDW/PDW with three groups was obtained by summing these two binary variables. Two logistic regres-sion models were then fitted to the data, with GRACE risk score alone and with the new variable RDW/PDW included. Predictive and discriminative abilities were assessed by the Hosmer-Lemeshow goodness of fit test and by the area under the Receiver Operating Characteristic curve (AUC), respectively. To compare the AUC from each of these mod-els, the method described by DeLong et al. was used.12 The
Akaike Information Criterion was also used to compare the two models.
The incremental predictive value resulting from adding RDW/PDW variable to GRACE risk score was analysed with Continuous Net Reclassification Improvement (NRI) and Integrated Discrimination Improvement (IDI). The net proportion of patients who died (with events) with higher probabilities of death (NRIevents) and of patients who did not
die (without events) with lower probabilities of death (NRInonevents), were calculated considering both models.
The NRI is the sum of NRIevents and NRInonevents and
quanti-fies the correctness of upward and downward movement of predicted probabilities as a result of adding a new marker.13
The IDI is a measure of the improvement in prediction and may be viewed as the difference between improvement in average sensitivity and average 1-specificity.13
For all comparisons, a p value < 0.05 was considered statistically significant. When appropriate, 95% confidence intervals (CI) were calculated.
Statistical analysis was carried out using the IBM SPSS Statistics, Version 21.0 (IBM Corp., North Castle, New York, USA) and the R software.14
Results
A total of 787 consecutive patients were included in the study, with a mean age of 64 ± 13 years, 70% males. The majority of the patients were admitted with an ST-segment elevation acute myocardial infarction (STEMI) (62%). In our sample, median GRACE risk score was 139 (P25: 114–
P75: 161). The in-hospital, 30-day and one-year mortality
rates were 5.1%, 5.8% and 7.8%, respectively. RDW corre-lated with haemoglobin values (r=−0.34, p<0.001) and PDW correlated with platelet numbers (r=−0.15, p<0.001). Patients with Non-STEMI or unstable angina were elderly, had more risk factors for coronary artery disease (except for smoking), more frequent previous cardiac history and medi-cations compared to patients with STEMI (Supplemental Table). Patients with STEMI or non-STEMI had higher heart rate, systolic blood pressure, GRACE risk score and lower GFR compared to patients with unstable angina. No differences were found in haematological parameters according to admission diagnosis, with the exception of
PDW. There were also no statistically significant differences in outcome, although there were no deaths in the unstable angina group.
The concordance index obtained for the Cox regression model with only the continuous RDW as an independent variable was 0.67 (95% CI: 0.60–0.74). For PDW, the obtained concordance was 0.63 (95% CI: 0.56–0.70). In the univariable analysis, age, gender, smoking, diabetes, heart rate, systolic blood pressure, angiotensin-converting enzyme inhibitors and beta-blockers use, Killip class, esti-mated glomerular filtration rate, PCI, RDW and PDW were significant predictors of outcome. In the multiple Cox proportional-hazards regression model, RDW and PDW remained as independent predictors of all-cause mortality after adjusting for age, diabetes, heart rate, sys-tolic blood pressure, angiotensin-converting enzyme inhibitor and beta-blocker (Table 1). Proportional hazards assumption was met (p=0.277) and the global concordance of the final model was 0.83 (95% CI: 0.75–0.90). Anaemia is also an important predictor of mortality in ACS. In our study, in univariable analysis, anaemia showed an OR of 2.79 (95% CI 1.64–4.73, p<0.001) for all-cause mortality. Since anaemia could influence outcome and RDW values, we checked it in multivariable analysis. RDW remained as an independent predictor of outcome after adjustment for the presence of anaemia (OR 1.22, 95% CI 1.05–1.42,
p=0.010) or after adjustment for haemoglobin values as a
continuous variable (OR 1.22, 95% CI 1.04–1.43,
p=0.013). This confirmed that although important for
out-come, RDW does not lose its predictive ability after adjust-ment for the presence of anaemia.
Before studying how much RDW and PDW add to the predictive and discriminative ability of GRACE risk score and, due to the known usefulness of cut-off points in clini-cal practice, RDW and PDW were discretized by
Table 1. Univariable and multivariable Cox proportional hazards regression analysis.
Variable Univariable analysis p value Multivariable analysis p value
HR (95% CI) HR (95% CI)
Age (per 10 years increase) 2.04 (1.63–2.57) <0.001 1.98 (1.55–2.52) <0.001
Male gender 0.43 (0.26–0.71) 0.001 – –
Smoking 0.42 (0.23–0.77) 0.005 – –
Diabetes 2.22 (1.33–3.69) 0.002 1.70 (1.00–2.90) 0.051
Heart rate (per 10 bpm increase) 1.30 (1,15–1.48) <0.001 1.26 (1.22–1.42) <0.001 SBP (per 10 mmHg increase) 0.85 (0.77-0.93) 0.001 0.80 (0.72–0.88) <0.001 ACEI 0.40 (0.23–0.71) 0.002 0.51 (0.28–0.95) 0.033 Beta-blocker 0.39 (0.23–0.68) 0.001 0.45 (0.25–0.81) 0.008 Killip class > 1 3.23 (1.95–5.37) <0.001 – – eGFR < 60 3.33 (2.00–5.55) <0.001 – – PCI 0.54 (0.31–0.92) 0.022 – – RDW 1.24 (1.12–1.37) <0.001 1.17 (1.03–1.32) 0.012 PDW 1.20 (1.08–1.35) 0.001 1.14 (1.02–1.28) 0.022
ACEI: angiotensin converting enzyme inhibitor; PCI: percutaneous coronary intervention; eGFR: estimated glomerular filtration rate; SBP: systolic blood pressure.
maximizing the sum of sensitivity and specificity. RDW had an AUC of 0.672 (95% CI 0.603–0.741) and PDW an AUC of 0.635 (95% CI 0.567–0.703). The best cut-off for RDW was 13.9%, with a sensitivity of 62.3% (95% CI: 49.0–74.4) and a specificity of 62.0% (95% CI: 58.3– 65.5); the best cut-off for PDW was 14.5%, with a sensitiv-ity of 73.8% (95% CI: 60.9–84.2) and a specificsensitiv-ity of 49.4% (95% CI: 45.8–53.2). A new variable RDW/PDW was then constructed as explained above. Patients with increases in both RDW and PDW (Group 2) were older and less often males. No significant associations were observed for coronary artery disease, diabetes, smoking, previous history, other initial presentation data and treat-ment (Table 2).
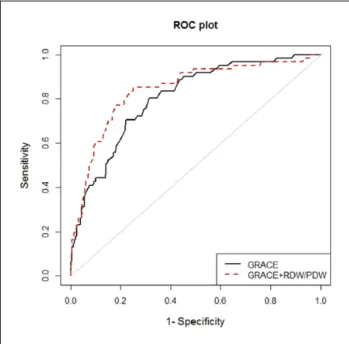
We built prediction models with GRACE risk score alone and after including the new RDW/PDW variable. AUC increased significantly after the inclusion of this vari-able in the model, although with a decrease in the goodness of fit (Figure 1, Table 3). However, Akaike Information Criterion also improved with the lowest value attained by the model with RDW/PDW variable, indicating a better model. Overall, the inclusion of RDW/PDW in a model with GRACE risk score was associated with a NRI of 56%, suggesting correct upward and downward movement of predicted probabilities of death. However, these move-ments occurred more effectively in the non-events group. In fact, the new model reduced the estimated probability of death in 58% of those without events. That is, the new model may better identify those patients who did not die. The IDI again showed that the model diagnostic perfor-mance was significantly improved by adding RDW/PDW to the GRACE risk score (IDI = 0.048) (Table 3).
Discussion
RDW reflects variability in circulating red blood cell size. It is based on the width of red blood cell volume distribu-tion curve, with larger values indicating greater variability. Conditions of ineffective red cell production (such as iron deficiency, B12 of folate deficiency, and haemoglobinopa-thies), increase red cell destruction (such as haemolysis), and blood transfusion increase RDW.
RDW is an independent predictor of all-cause mortality in different patient populations and it gives valuable infor-mation for short-term risk stratification of ACS.1–7 RDW is
also an independent predictor of major bleeding in patients with non-ST-segment elevation myocardial infarction.15
Anaemia has been shown to be a powerful and independent predictor of adverse cardiovascular outcomes.16–18
Adjustment for multiple potential confounders (including anaemia) attenuated, but did not eliminate, the association between higher RDW levels and the adverse clinical out-comes.16 In our sample, the same was observed. A study
analysed both baseline and discharge RDW in patients with acute myocardial infarction.19 They concluded that an
increase in RDW during hospitalization shifted patients to a higher level of risk. On the contrary, decreasing RDW had a favourable outcome. Thus RDW is a dynamic marker of risk. RDW levels were significantly increased in patients with inadequate ST-segment resolution after primary PCI and baseline levels predicted no-reflow.20 It was also an
independent predictor of 6-month cardiovascular mortality, even after adjustment for multiple confounders including anaemia.20
The mechanisms by which elevated values of RDW are associated with adverse outcome in patients with cardio-vascular disease have yet to be fully clarified but are prob-ably multifactorial. In the context of ACS, we have an increase in inflammatory cytokines, oxidative stress, acti-vation of neurohumoral pathways and adrenergic activa-tion, all implicated in adverse outcome after ACS, and all these mechanisms seem to be involved in bone marrow response and erythroid cell poiesis.21–32 In ACS, there is
usually an infarct-related inflammatory response with excess cytokine production. Proinflammatory cytokines have been found to inhibit erythropoietin-induced erythro-cyte maturation, allowing juvenile erythroerythro-cytes to enter into circulation and leading to an increase in size heteroge-neity.27,28 Plasma erythropoietin levels increase in the early
phase of acute myocardial infarction independently of hae-moglobin levels.29 Oxidative stress also causes damage
which reduces cell survival, and it enhances the release of juvenile erythrocytes to circulation.30 Activation of
neuro-humoral pathways with elevated circulating levels of neu-rohumoral mediators can affect erythropoiesis.31,32
Platelet hyper-reactivity and local platelet activation have been suggested to play a causal role in ACS.33
Platelet size reflects platelet activity, with larger platelets being metabolically and enzymatically more active than small platelets. Large platelets are denser, aggregate more rapidly upon collagen challenge, produce larger amounts of thromboxane A2, release more serotonin and β-thromboglobulin, and express more Ib and IIb/IIIa gly-coproteins.34,35 Platelet activation causes morphologic
changes, from discoid to spherical shape and pseudopodia formation with increased PDW.36,37 Patients with ACS
(compared to control patients and patients with stable angina) have raised platelet volume indices.8 The increase
in platelet consumption at the site of coronary atheroscle-rotic plaque causes larger platelets to be released from the bone marrow and the increase persists even after hospital discharge.8 Erythropoietin and thrombopoietin have
con-siderable structural homology and erythropoietin may also increase platelet reactivity.38
Several studies showed that Mean Platelet Volume (MPV) is an independent risk factor in myocardial infarc-tion with aggravated clinical outcomes and higher mortal-ity.39,40 In a meta-analysis, an increased MPV was associated
with acute myocardial infarction, mortality following myo-cardial infarction, and restenosis following PCI.41 It is also
associated with no ST-segment resolution after treatment with streptokinase and no-reflow after primary PCI.42,43 In
fact, large platelets are younger platelets and this is a sign of increased platelet turnover. In diabetic patients, MPV is a strong predictor of the thromboxane B2 recovery slope after acetylsalicylic acid administration, suggesting that the diabetic milieu may account for the faster de novo synthesis
of cyclooxygenase-1 in the bone marrow progenitors or their accelerated turnover, increasing risk.44
Although MPV has been extensively evaluated, novel platelet indices such as PDW have been less well investi-gated as platelet activation markers. PDW is significantly increased in patients with STEMI and is an independent predictor of STEMI.45 More recently, it was demonstrated
Table 2. Clinical characteristics by each RDW/PDW group.
Group 0 Group 1 Group 2 p value
n=243 n=362 n=182 Age (years) 61 (13) 64 (13) 66 (14) 0.001† Male gender (%) 77.0 67.1 65.4 0.012 Risk factors (%) Hypertension 63.0 66.9 70.9 0.228 Hyperlipidemia 53.9 49.7 51.1 0.599 Diabetes 23.9 23.2 27.5 0.535 Smoking 38.3 40.9 35.7 0.492 Previous history (%) Myocardial infarction 16.0 19.1 20.3 0.485 PCI 11.1 13.5 11.0 0.571 CABG 4.9 4.4 7.7 0.262 Stroke / TIA 3.7 8.3 6.6 0.080 Initial presentation STEMI n (%) 56.8 63.8 63.2 0.191 Killip class >1 (%) 18.9 19.3 21.4 0.793 HR (bpm) 78 (66–90) 80 (65–88) 80 (66–94) 0.302 SBP (mmHg) 130 (117–150) 131 (117–153) 132 (120–157) 0.621 Laboratory data eGFR < 60 ml/min/1.73m2 (%) 32.5 28.7 34.1 0.383 Haemoglobin (g/dL) 13.9 (1.6) 13.6 (1.8) 13.2 (2.1) <0.001 Anemia (%) 18.9 27.9 38.5 <0.001 RDW 13.0 (12.7–13.4) 13.5 (13.0–14.0) 14.4 (14.0–15.1) <0.001‡ PDW 12.5 (11.7–13.4) 15.6 (13.28–16.6) 16.5 (16.2–17.2 <0.001‡ Platelets (x103) 214 (185–248) 203 (169–242) 210 (168–256) 0.055
GRACE risk score 140 (117.0–159.0) 137 (112.0–160.0) 139.5 (114.8–162.5) 0.544
LVEF < 35% (%) 3.3 7.2 7.1 0.106 Treatment (%) ASA 99.2 98.6 98.9 0.817 Clopidogrel 96.7 96.4 96.2 0.953 ACEI 87.2 86.2 86.8 0.930 Beta-blocker 86.9 84.5 84.6 0.870 Statin 93.8 94.8 91.2 0.276 PCI 80.2 78.7 76.9 0.709 CABG 2.1 1.1 0.5 0.362 All-cause mortality (%) In-hospital mortality 1.6 4.1 11.5 <0.001 30-day mortality 2.9 4.1 13.2 <0.001 One-year mortality 3.3 6.4 16.5 <0.001
Continuous variables are presented as mean (SD) or median (P25–P75), as appropriate.
CABG: coronary artery bypass grafting; CK: creatinine kinase; ASA: acetil-salicilic acid; ACEI: angiotensin converting enzyme inhibitor; eGFR: esti-mated glomerular filtration rate; TIA: transient ischemic attack; HR: heart rate; SBP: systolic blood pressure; LVEF: left ventricular ejection fraction. Multiple comparisons:
†Group 0 vs. Group 2, p<0.001; Group 1 vs. Group 2, p=0.044.
that admission PDW correlated to platelet activation, no-reflow, in-hospital and long-term major acute coronary events (in-stent thrombosis, non-fatal myocardial infarc-tion, coronary revascularization and in-hospital mortality) amongst patients with STEMI undergoing thrombolysis or
primary PCI.35,42,45,46 The prognostic value of PDW was
even stronger than that previously reported for MPV. Currently, automated cell counters enable routine avail-ability of an extended panel of platelet volume indices beyond MPV (including PDW) routinely available in most clinical laboratories. RDW is also widely available to clini-cians as part of the complete blood count and, therefore, incurs no additional costs, in contrast to other novel mark-ers of cardiovascular risk.
Our results in medium-term follow-up in a population with the whole spectrum of ACS confirmed the independ-ent association between RDW and PDW and survival time, after adjustment for relevant variables. They also showed some benefit in risk stratification after the inclusion in a model with GRACE risk score.
To better assess the improvement in outcome risk pre-diction we did a prepre-diction/discrimination-oriented study which showed a significant AUC increase after including RDW/PDW in the model with GRACE risk score alone. The Akaike Information Criterion, a measure that consid-ers both the goodness of fit and complexity of the model, also showed that this last model was the best. Considering the other new statistical metrics, recently proposed to quantify the degree of correct reclassification, the inclu-sion of RDW/PDW in a model with GRACE risk score was associated with a NRI of 56%. However, the new model identifies better those who do not have events than those who do. We also have found an IDI compatible with a favourable result after adding RDW/PDW to the GRACE risk score. Our results showed that adding RDW/PDW to a model with GRACE risk score could mainly better identify patients at low risk. The identification of ‘truly low-risk’ patients, instead of focusing mainly on identification of high-risk patients, may allow a better selection of patients avoiding unnecessary interventions that might increase costs as well as the risk of intervention-related adverse events, such as intensive anti-platelet or anti-thrombotic therapy. It can also help in the selection of patients for early discharge.
Limitations
This is a single-centre study which might limit the conclu-sions. It is also a retrospective and non-randomized study. It might not be applicable to other populations with differ-ent baseline characteristics. Particularly, our population has a predominance of STEMI patients, explained by the fact that we are a tertiary centre which receives many patients, from other hospitals for primary percutaneous coronary intervention. However, this does not reflect the distribution in other cohort studies of ACS and some caution should be taken when extending our results to other cohorts.
There might be some confounding factors such as eryth-ropoietin levels, iron, folic acid and vitamin B12 that were not measured. Other known or unknown comorbidities that
Figure 1. ROC curve analysis comparing the GRACE risk
score and the new model with the inclusion of RDW/PDW (p=0.024).
Table 3. Statistics for model improvement with the addition of
RDW/PDW. Events, n (%) 61 (7.8) Nonevents, n (%) 726 (92.2) Continuous NRI (%) cNRIevents −2 (−27–24) cNRInonevents 58 (30–83) cNRI 56 (51–65) IDI statistics IDIevents 0.044 IDInonevents 0.004 IDI 0.048 (0.022–0.073) AIC
GRACE risk score 359.47
GRACE + RDW/PDW 341.25
AUC
GRACE risk score 0.81 (0.75–0.86) GRACE + RDW/PDW 0.84 (0.79–0.90) Difference (p value) 0.024 Goodness of fit (GRACE risk score)* 0.559 Goodness of fit (GRACE + RDW/PDW)* 0.052
95% confidence intervals are shown in parenthesis. *Hosmer-Lemeshow goodness of fit test p value.
could influence RDW and PDW were not specifically ana-lysed because they were not part of the registry.
Conflict of interest
None declared.
Funding
A.L.P. work (statistical analysis) was supported by the Fundação para a Ciência e Tecnologia, Portugal – FCT [PEst-OE/MAT/ UI0006/2014].
References
1. Felker GM, Allen LA, Pocock SJ, et al. on behalf of CHARM Investigators. Red cell distribution width as a novel prognos-tic marker in heart failure: data from the CHARM Program and the Duke databank. J Am Coll Cardiol 2007; 50: 40–47. 2. Tonelli M, Sacks F, Arnold M, et al. Relation between red
blood cell distribution width and cardiovascular event rate in people with coronary diseases. Circulation 2008; 117: 163–168.
3. Uyarel H, Ergelen M, Cicek G, et al. Red cell distribution width as a novel prognostic marker in patients undergoing primary angioplasty for acute myocardial infarction. Coron
Artery Dis 2011; 22: 138–144.
4. Azab B, Torbey E, Hatoum H, et al. Usefulness of red cell distribution width in predicting all-cause long-term mortal-ity after non-ST-elevation myocardial infarction. Cardiology 2011; 119: 72–80.
5. Nabais S, Losa N, Gaspar A, et al. Association between red blood cell distribution width and outcomes at six months in patients with acute coronary syndromes. Rev Port Cardiol 2009; 28: 905–924.
6. Poludasu S, Marmur JD, Weedon J, et al. Red cell distribu-tion width (RDW) as a predictor of long-term mortality in patients undergoing percutaneous coronary intervention.
Thromb Haemost 2009; 102: 581–587
7. Cavusoglu E, Chopra V, Gupta A, et al. Relation between red blod cell dsitribution width (RDW) and all-cause mortality at two years in an unselected population referred for coronary angiography. Int J Cardiol 2010; 141: 141–146.
8. Khandekar MM, Khurana AS, Deshmukh SD, et al. Platelet volume indices in patients with coronary artery disease and acute myocardial infarction: an Indian scenario. J Clin
Pathol 2006; 59: 146–149.
9. Vagdatli C, Gourari E, Lazaridou E, et al. Platelet distribu-tion width: a simple, practical and psecific marker of activa-tion of coagulaactiva-tion. Hippokratia 2010; 14: 28–32.
10. Fox KA, Dabbous OH, Goldberg RJ, et al. Prediction of risk of death and myocardial infarction in the six months after presentation with acute coronary syndrome: prospective multinational observational study (GRACE). BMJ 2006; 333: 1091–1094.
11. Cockcroft DW and Gault MH. Prediction of creatinine clear-ance from serum creatinine. Nephron 1976; 16: 31–41. 12. DeLong ER, DeLong DM and Clarke-Pearson DL.
Comparing the areas under two or more correlated receiver operating characteristic cruves: a nonparametric approach.
Biometrics 1988; 44: 837–845.
13. Pencina MJ, D’Agostino RB and Steyerberg EW. Extension of net reclassification improvement calculations to measure usefulness of new biomarkers. Statistics in Medicine 2011; 30: 11–21.
14. R Core Team R: A language and environment for statistical computing. R Foundation for Statistical Computing. 2013. Vienna, Austria. ISBN: 3-900051-07-0, http://.R-project.org/ 15. Gonçalves S, Ferreira Santos J, Amador P, et al. Impact of
red blood cell distribution width on risk for bleeding events in patients with non-ST elevation acute coronary syndrome.
Rev Port Cardiol 2013; 32: 27–33.
16. Cavusoglu E, Chopra V, Gupta A, et al. Usefulness of anemia in men as an independent predictor of two-year cardiovascu-lar outcome in patients presenting with acute coronary syn-drome. Am J Cardiol 2006; 98: 580–584.
17. Lee PC, Kini AS, Ahsan C, et al. Anemia is an independent predictor of mortality after percutaneous coronary interven-tion. J Am Coll Cardiol 2004; 44: 541–546.
18. O’Meara E, Clayton T, McEntegart MB, et al, on behalf of CHARM Investigators. Clinical correlates and consequences of anemia in a broad spectrum of patients with heart fail-ure: results of the CHARM Program. Circulation 2006; 113: 986–994.
19. Dabbah S, Hammerman H and Markiewicz W. Relation between red cell distribution width and clinical outcomes after acute myocardial infarction. Am J Cardiol 2010; 105: 312–317.
20. Isik T, Kurt M, Ayhan E, et al. The impact of admission red cell distribution width on the development of poor myo-cardial perfusion after primary percutaneous intervention.
Atherosclerosis 2012; 224: 143–149.
21. Tsimikas S, Willerson JT and Ridker PM. C-reactive protein and other emerging blood biomarkers to optimize risk strati-fication of vulnerable patients. J Am Coll Cardiol 2006; 47: C19–C31.
22. Weiss G and Goodrough LT. Anemia of chronic disease. N
Engl J Med 2005; 352: 1011–1028.
23. Pierce CN and Larson DF. Inflammatory cytokine inhibition of erythropoesis in patients implanted with a mechanical cir-culatory assist device. Perfusion 2005; 20: 85–90.
24. Ridker PM, Rifai N, Clearfield M, et al. Measurement of C-reactive protein for the targeting of ebatin therapy in the primary prevention of acute coronary events. N Engl J Med 2001; 344: 1959–1965.
25. Lippi G, Targher G, Montagnana M, et al. Relation between red blood cell distribution width and inflammatory biomark-ers in a large cohort of unselected outpatients. Arch Pathol
Lab Med 2009; 133: 628–632.
26. Forhecz Z, Gombos T, Borgulya G, et al. Red cell distri-bution width in heart failure: prediction of clinical events and relationship with markers of ineffective erythopoiesis, inflammation, renal function, and nutritional state. Am Heart
J 2009; 158: 659–666.
27. Pascual-Figal DA, Bonaque JC, Redondo B, et al. Red blood cell distribution width predicts long-term outcome regardless of anaemia status in acute heart failure patients. Eur J Heart
Fail 2009; 11: 840–846.
28. Al-Najjar Y, Goode KM, Zhang J, et al. Red cell distribu-tion width: an inexpensive and powerful prognostic marker in heart failure. Eur J Heart Fail 2009; 11: 1155–1162.
29. Ferrario M, Massa M, Rosti V, et al. Early haemoglobin-inde-pendent increase of plasma erythropoietin levels in patients with acute myocardial infarction. Eur Heart J 2007; 28: 1805–1813. 30. Semba RD, Patel KY, Ferrucci L, et al. Serum antioxidants
and inflammation predict red cell distribution width in older women: the Women’s Health and Aging Study I. Clin Nutr 2010; 29: 600–604.
31. Allen LA, Felker GM, Mehra MR, et al. Validation and poten-tial mechanisms of red cell distribution width as a prognostic marker in heart failure. J Card Fail 2010; 16: 230–238. 32. Masson S, Latini R, Anand IS, et al. On behalf of Val-HeFT
Investigators. Prognostic value of changes in N-terminal pro-brain natriuretic peptide in Val-HeFT (Valsartan Heart Failure Trial). J Am Coll Cardiol 2008; 52: 997–1003. 33. Trip MD, Cats VK, van Capelle FL, et al. Platelet
hyperreac-tivy and prognosis in survivors of myocardial infarction. N
Engl J Med 1990; 322: 1549–1554.
34. Thompson CB, Eaton KA, Princiotta SM, et al. Size-dependent platelet subpopulation: relationship of platelet volume to ultrastructure, enzymatic activity and function. Br
J Haematol 1982; 50: 509–520.
35. Celik T, Kaya M, Akpek M, et al. Predictive value of admis-sion platelet volume indices for in-hospital major adverse cardiovascular events in acute ST-segment elevation myocar-dial infarction. Angiology 2013 Dec 3. (Epub ahead of print). PMID: 24301422. DOI: 10.1177/0003319713513493. 36. Jagroop IA, Clatworthy I, Lewin J, et al. Shape change
in human platelets: measurement with a channelyzer and visualization by electron microscopy. Platelets 2000; 11: 28–32.
37. Vagdatli E, Gounari E, Lazaridou E, et al. Platelet distribu-tion width: a simple, practical and specific marker of activa-tion of coagulaactiva-tion. Hippokratia 2010; 14: 28–32.
38. Stohlawetz PJ, Dzirlo L, Hergovich N, et al. Effects of erythropoietin on platelet reactivity and thrombopoiesis in humans. Blood 2000; 95: 2983–2989.
39. Huczek Z, Kochman J, Filipiak KJ, et al. Mean platelet vol-ume on admission predicts impaired reperfusion and long-term mortality in acute myocardial infarction treated with primary percutaneous coronary intervention. J Am Coll
Cardiol 2005; 46: 284–290.
40. Massberg S, Schulz C and Gawaz M. Role of platelets in the pathophysiology of acute coronary syndrome. Semin Vasc
Med 2003; 3: 147–162.
41. Chu SG, Becker RC, Berger PB, et al. Mean platelet volume as a predictor of cardiovascular risk: a systematic review and meta-analysis. J Thromb Haemost 2010: 8: 148–156. 42. Varastheh-Ravan HR, Ali-Hassan-Sayegh S, Shokraneh S,
et al. Relationship of admission mean platelet volume plate-let distribution width and white blood cells with ST resolu-tion in patients with acute ST segment elevaresolu-tion myocardial infarction treated with streptokinase without history of previ-ous cardiovascular surgery. Prespect Clin Research 2013; 4: 125–129.
43. Michaels AD, Gibson CM and Barron HV. Microvascular dysfunction in acute myocardial infarction: focus on the roles of platelets and inflammatory mediators in the no-reflow phenomenon. Am J Cardiol 2000; 85(5A): 50B–60B. 44. Rocca B, Santilli F, Pitoco D, et al. The recovery of plate-let cyclooxygenase activity explains interindividual vari-ability in responsiveness to low-dose aspirin in patients with and without diabetes. J Thromb Haemost 2012; 10: 1220–1230.
45. Rechcinski T, Jasinska A, Forys J, et al. Prognostic value of platelet indices after acute myocardial infarction treated with primary percutaneous coronary intervention. Cardiol J 2013; 20: 491–498.
46. Cetin M, Bakirci EM, Baysal E, et al. Increased platelet distribution width is associated with ST-segment elevation myocardial infarction and thrombolysis failure. Angiology 2014 Feb 12. (Epub ahead of print). PMID: 24526792. DOI: 10.1177/0003319713520068.