THIS REPORT WAS PREPARED EXCLUSIVELY FOR ACADEMIC PURPOSES BY [INSER STUDENT’S NAME], A MASTERS IN FINANCE STUDENT OF THE NOVA SCHOOL OF BUSINESS AND ECONOMICS. THE REPORT WAS SUPERVISED BY A NOVA SBE FACULTY MEMBER, ACTING IN
A MERE ACADEMIC CAPACITY, WHO REVIEWED THE VALUATION METHODOLOGY AND THE FINANCIAL MODEL.
(PLEASE REFER TO THE DISCLOSURES AND DISCLAIMERS AT END OF THE DOCUMENT)
Page 1/32
M
ASTERS IN
F
INANCE
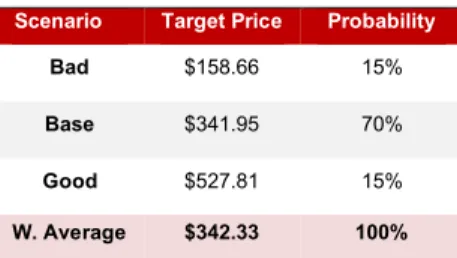
0% 50% 100% 150% 200% 250% 300% 350% 400% 450% 500% 29/0 6/20 10 29/1 2/20 10 29/0 6/20 11 29/1 2/20 11 29/0 6/20 12 29/1 2/20 12 29/0 6/20 13 29/1 2/20 13 29/0 6/20 14 29/1 2/20 14 29/0 6/20 15 29/1 2/20 15 29/0 6/20 16 29/1 2/20 16 29/0 6/20 17 29/1 2/20 17 TSLA NASDAQ § We have a positive outlook for TSLA shares in thelong-term and we recommend to BUY the stock with a target of $342.33, corresponding to a potential gain of 24.5% compared to the current price levels.
§ We forecast unprecedent revenue growth from $17bn in 2018 to $268bn in 2040 (+13.1% CAGR in 2018-2040). We model Tesla to start generating positive income in 2023.
§ The introduction of new models such Tesla Semi and Roadster and expansion of the Energy Generation and Storage segments will boost the revenues, as the customer´s environment awareness and the demand for renewable energy resources is globally increasing.
§ Capital expenditure, R&D and SG&A will continue to pressure cash flows until all the production issues will be solved and the battery will have a competitive cost.
§ While Tesla has consistently missed its near-term targets, it has however accomplished a number of equally optimistic long-term objectives. Tesla consistently missed its quarterly production targets for Model 3 and Model X before, though it ultimately reached all production targets it set in the 2012 plan.
Company description
Tesla Inc., California based company, engages in the design, development and sale thought its store, fully electric vehicles, energy storage products and solar panels. It also provides a wide range of other services such vehicles service centers, supercharger stations and self-driving capabilities. The company operates through Automotive, Energy Generation and Energy Storage segments.
T
ESLA
I
NC
.
C
OMPANY
R
EPORT
C
ONSUMERD
ISCRETIONARY 23MAY2018STUDENT: ARJEL HENA
27186@novasbe.pt
It is not time to Short Musk
Ambitious Targets and High Potential Growth.
Recommendation: BUY
Price Target FY18: $342.33
Price (as of 23-May-18) $275.01
Reuters: TSLA.OQ, Bloomberg: TSLA
52-week range ($) 244.59-389.61 Market Cap ($bn) 46.69 Outstanding Shares (mn) 169.79 Potential return 24.5% Source: Bloomberg Source: Bloomberg
(Values in $ billions) 2018E 2019E 2020E Revenues 17.32 25.74 40.41 EBITDA (0.77) (1.92) (2.75) Net Loss (1.11) (1.9) (2.55) Free Cash Flow (3.01) (3.61) (4.69)
Vehicles Deliveries
Model X 45,415 43,407 39,008 Model S 47,700 48,230 53,636 Model 3 128,790 265,265 489,453 Source: Own estimations
TESLA INC. COMPANY REPORT PAGE 2/32
Table of Contents
EXECUTIVE SUMMARY ... 3 COMPANY OVERVIEW ... 3 SHAREHOLDER STRUCTURE ... 4 INDUSTRY ANALYSIS ... 4 AUTOMOTIVE SECTOR ... 4 § Electric-Vehicle Market ... 6 § Policy Support ... 6 § Battery cost ... 7 § EV Market Competition... 9ENERGY GENERATION SECTOR ... 10
§ Solar PV Deployment ... 11
§ Photovoltaics Incentives ... 11
§ Solar Panels Costs ... 12
§ Competition ... 13
ENERGY STORAGE SECTOR ... 13
§ Energy Storage Deployment ... 14
§ Energy Storage Market Competition ... 14
§ Energy Storage Policies ... 15
COMPANY ANALYSIS ... 16
AUTOMOTIVE DIVISION ... 16
§ Automotive Revenues ... 16
§ Services and Regulatory Credits ... 17
ENERGY GENERATION AND STORAGE DIVISION ... 17
§ Solar PV... 18
§ Tesla Roof ... 18
§ Energy Storage ... 19
COMPANY VALUATION ... 20
RISK AND COMPETITIVENESS ANALYSIS ... 20
FINANCIAL FORECAST ... 21
OPERATIONAL EFFICIENCY AND INVESTMENTS... 21
VALUATION ... 23 SCENARIO ANALYSIS ... 24 ... 25 COMPARABLE ANALYSIS ... 25 FINAL CONSIDERATIONS ... 25 APPENDIX ... 27 INCOME STATEMENT ... 27 BALANCE SHEET ... 28
CASH FLOW STATEMENT ... 29
TESLA INC. COMPANY REPORT
PAGE 3/32
Figure 2: 2017 Revenues by segment (%) Source: Own estimations
Source: Company Reports
Executive Summary
Tesla has a highly differentiated business model, appealing product portfolio and leading-edge technology which are placing the company as a leader in the electric vehicles industry. The company is led by a visionary leader and backed by a management team with solid functional team. We laud the company for its achievements and we believe it definitely has revolutionized competition in the electric vehicle industry. However, the management has often been too bullish on setting ambitious targets only to revise them to a more practical deadline. We also think that the company’s cash needs are immediate and continuous to operate in a capital-intensive industry with significant cash outlay required for mass-market volume production of electric vehicle which appears to be Tesla’s end-game. The acquisition of SolarCity has created synergies between the tree segments, Automotive, Energy Generation and Storage, and has been a crucial move to further verticalize the company. However, the high debt accumulated
by SolarCity and the low margins for the Energy Generation industry are a
matter of concern for the future. We project the company to be profitable from 2023 and generate positive cash flows from 2025, once Tesla Semi and Roadster are introduced in the market. Moreover, we estimate revenues to growth with a CAGR of +13.3% over the forecasted period, with Energy Generation leading the growth at +20.7% CAGR, benefiting with from the high growth of the Photovoltaic installations sector. The integration with the Energy Generation products and the constantly decrease of the battery production cost ($95/kWh by 2040) will help the Energy Storage segment to growth at +18.7% CAGR over the forecasted period. Lastly, in our final valuation, we pondered three futures scenarios that are resulting in a final target price $342.33 per share with a potential 12-month
return of +24.5%, enforcing our BUY recommendation.
Company Overview
Tesla Inc., founded in 2003 and headquartered in Palo Alto, is an American electric-manufacturer that designs and sells Electric Vehicles (Model S, Model X, Model 3, Tesla Roadster and Semi), Energy Storage Systems (Powerwall and Powerpack) and Solar Energy Systems (Solar Roof and Solar Panels) through its subsidiary SolarCity, acquired for $2.6bn in 2016. The company also sells powertrains to other manufacturers and provides leasing and other services related to its cars.
Figure 1: Target price for each Scenario Scenario Target Price Probability
Bad $158.66 15% Base $341.95 70% Good $527.81 15% W. Average $342.33 100% 91% 9% Automotive
Energy Generation and Storage
55% 18%
3% 24%
USA China Europe Rest of the World
Figure 3: 2017 Revenues by region
TESLA INC. COMPANY REPORT
PAGE 4/32
Source: Company Reports
Figure 4: 2017 Tesla´s biggest shareholders
Source: Bloomberg as of May 23, 2018
Tesla´s electric vehicles are manufactured at its main automotive factory in
Fremont, where the vast majority of the components are also made. Supporting
Tesla´s automotive components and energy storage products are made in the
Gigafactory 1, the largest lithium – ion battery factory in the World. Tesla´s photovoltaics cells and components for Tesla Roof and Solar Panels are assembled in the Gigafactory 2, in Buffalo. In 2016, the company made its most
important acquisition to date when it acquired SolarCity with the aim to achieve
cost synergies in its energy and storage products. Tesla markets and sells cars
directly through 330 stores and services locations in more than 25 US states and about 25 countries. In 2017, the USA market accounted for 55% of sales. Other markets for which the company break sales are China and Norway, respectively 18% and 3% of total sales. Moreover, of the total revenues of $11.8bn, 82% were generated by the Automotive division, 9% by the Energy Generation and Storage division and 9% by the Services division.
Shareholder Structure
Tesla Inc. launched its Initial Public Offering (IPO) on NASDAQ in June 2010. The IPO raised $226mn with 13.33mn shares issued to the public at a price of $17.00. As of May 2017, Tesla held 169.79mn shares outstanding. The Institutional Investors own 58.5% of total shares with Fidelity Management and Baillie Gifford as the major institutional shareholders with respectively 19.20mn shares outstanding (11.4% of the total) and 12.9mn shares outstanding (7.6% of the total). On the other side, the insider investors own 25.5% of total shares with Elon
Musk standing as the biggest insider shareholder, owning 33.6mn shares
(19.9% of the total) and Tencent Holding in the second position with 8.2mn shares owned (4.8% of the total). We model that in the short-medium term period, Elon
Musk will remain the biggest Shareholder and CEO because Musk´s
leadership and vision will be necessary for the company to reach the mass-market production and compete with the other automotive companies. However, in the long-term period we have some concerns due to the time that the current CEO is giving by serving in other companies such SPACE X. We believe that this may impact in a negative way the future of the company.
Industry Analysis
Automotive Sector
In the last few years the automotive industry has faced many challenges and radical changes triggered by development of the emerging markets, in particularly
20% 5% 11% 8% 56%
Elon Musk Tencent Fidelity Baillie Gifford Others
TESLA INC. COMPANY REPORT
PAGE 5/32
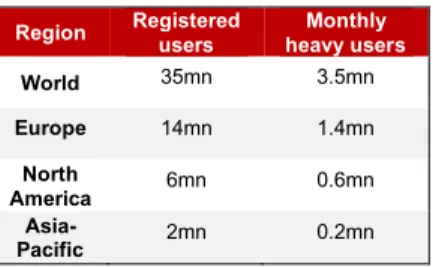
Figure 7: Car sharing users by 2021
China, the implementation of new technologies, environmental friendly policies and changing in consumer ownership with the increasing usage of car sharing. In the following years it is expected that the main drivers for the disruption of the automotive sector will be connectivity, smart mobility, autonomous
technology and electrification. According to McKinsey this could create up to
$1.5 trillion by 20301. Artificial Intelligence (AI) is the key technology behind autonomous vehicles. In fact, Autonomous cars need AI to improve real-time
object recognition and make the technology reliable. Companies such Tesla, Google, and Uber are already using this technology in their cars. In the future, an increasing number of software companies will enter in this particular market by creating joint-ventures, such the current Google-FCA and Uber-Volvo partnerships. By 2030, we forecast 20% of new car to be fully autonomous. Currently, AI is essential for price optimization, cost reduction and operation efficiency, changing gradually the vehicles manufacturing processes and the entire sector. The AI technology is leading to less equipment failure, improving the overall system performance, optimizing the maintenance planning and extending the asset life cycles. The potential impact in the next years is forecasted2 to be a
20% increase in equipment availability, 25% reduction in inspection costs and up to 10% reduction in total annual maintenance cost. Lastly, AI will improve the forecasting models for the supply and demand, giving to AI-powered supply chains the necessary flexibility needed to respond to any shift in consumers´ preferences. We forecast AI technology to potentially reduce inventories by 12.5% to 30% when fully implemented by automotive makers. Shared and smart mobility will slow global vehicles sales but will not outpace them over the next
years. Car sharing will enable people to travel faster and cheaper. This trend will be propelled by the urbanization expansion and the changing in consumers´ behaviours who will give less importance to the car ownership culture. While there likely will be less new vehicles produced in the future, vehicles sales will
outperform sharing mobility due to the increasing demand in Emerging Markets
and high replacement frequency replacement of car sharing vehicles. Studies3
indicate that 5-15 cars are replaced for each shared car added to the automotive network, leading however to a consequent depreciation of 5-15 times fasters than any other privately-owned vehicle. In line with KPMG4 we forecast car-sharing to
rival the car-owned industry making up to 40% of new vehicle sales by 2040.
1Disruptive trends that will transform the auto industry (2016), McKinsey
2Building smarter cars with smarter factories: How AI will change the auto business (2017), McKinsey 3Does sharing cars really reduce car use? (2017), Transport & Environment
4Global Automotive Executive Survey 2018 (2018), KMPG
Segment Cost saving
Supply-chain
management $51bn
Manufacturing $22bn
Procurement $61bn
Marketing and Sales $31bn
Region Registered users Monthly heavy users World 35mn 3.5mn Europe 14mn 1.4mn North America 6mn 0.6mn Asia-Pacific 2mn 0.2mn 10 20 30 40 50 60 70 FY 2 017 201 9E 202 1E 202 3E 202 5E 202 7E 202 9E 203 1E 203 3E 203 5E 203 7E 203 9E
Figure 5: Annual EV Sales in mn from 2017 to
2040
Source: Bloomberg, Own estimations
Figure 6: Potential cost saving created by the
AI in the short-term across the entire value chain
Source: McKinsey
TESLA INC. COMPANY REPORT
PAGE 6/32
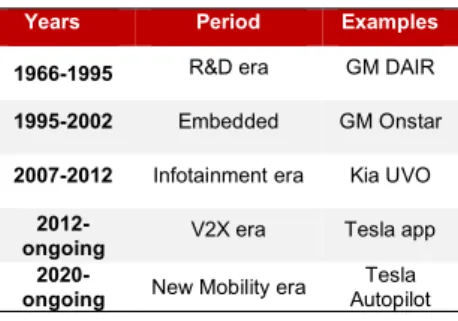
Figure 8: Phases evolution of the connected car
Figure 9: EV Sales projections from 2017 to
20140 by region 15% 18% 5% 12% 3% 30% 2% 45% 17% 10% 0% 13% 18% 49% 23% 0% 50% 100% UK U.S. Switzerland Sweden Spain South Korea Portugal Norway Netherlands Japan Italy Germany France Denmark China
Figure 10: 2017 Total subsidies in EV price in %
Internet of Things (IoT) and new infotainment systems will change the
customer experience as it is today. The importance of the car as a part of a connected network is growing in the customer´s awareness. It is expected that the percentage of users willing to change car brand for better connectivity will increase in the future, forcing the automakers to install fully connected infotainment systems in their new vehicles in the following years. Moreover, the increase of connectivity will used to reduce problems related to vehicle´s security and traffic by providing diverse data sets to third parties and a variety of in-vehicle services.
§
Electric-Vehicle Market
The automotive industry has seen increased movement towards the hybrid and
fully electrified segment in the aiming to reduce the total greenhouse emission
and the consequently impact on the environment. Despite challenges, electric vehicles are sponsored as a key contributor to build a sustainability mobility system and to overtake the ICE vehicles in the long-term. At the end of 2017, of the 83mn new vehicles produced, 1mn were electric (2% of total). By 2040, of the 120mn cars produced, 54% will be electric, representing 33% of the global car fleet. China will lead this transformation, occupying the first place as the
largest electric vehicle producer accounting for 31% of annual sales. China, Europe and U.S. together will make up over 60% of the global Electric-Vehicle
market in 2040. Overall, in the long-term period, the EV penetration of the car sales will reach 69% in Europe, 58% in U.S., 52% in China and 48% in Rest of the World. Moreover, we modelled that the following key drivers will be determinant the EV adoption: Policy support, Battery cost, EV commitments from automakers, Charging infrastructure, Shared mobility and Consumer
environmental awareness.
§ Policy Support
Government incentives forms a key support for the EV market and they are
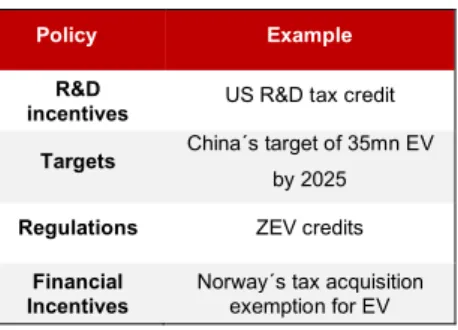
indispensable for lowering barrier to adoption. Policy support can be categorized in four major groups: R&D, Targets, Regulation and Financial incentives.
Research and Development incentives are essential for the developing of new
technologies that allow to improve efficiencies and performance and allow to scale-up the production of crucial high technology components such batteries.
Targets are fundamental for policy makers and for the EV industry, because
they help to focus the resources in the aiming of shifting from ICE to electric vehicles. An example of how targets are shaping the future global automotive
Years Period Examples
1966-1995 R&D era GM DAIR 1995-2002 Embedded GM Onstar
2007-2012 Infotainment era Kia UVO
2012-
ongoing V2X era Tesla app
2020-
ongoing New Mobility era Autopilot Tesla
Source: Deloitte
Source: Bloomberg, Own estimations
10.0 20.0 30.0 40.0 50.0 60.0 70.0 FY 201 7 201 9E 202 1E 202 3E 202 5E 202 7E 202 9E 203 1E 203 3E 203 5E 203 7E 203 9E Japan Europe US China
Rest of the world
TESLA INC. COMPANY REPORT
PAGE 7/32
Figure 11: Type of policies for EV adoption
Figure 12: Tesla battery cost per kWh from 2017
to 2040
market is the EV30@30 campaign, that is supported by many governments and is aiming to have 30% of the vehicles sales electric by 2030. Moreover, Netherlands set target of 10% of new vehicles to be electric by 2020, 50% by 2025 and 100% by 2035, while India aims to have 6mn EV vehicles on road by 2020. Remaining in Asia, China is building 12,000 charging stations across the country to serve 5mn EV vehicles by 2022 Regulations provides a definition of what will be the vehicle characteristic in the medium-long term, so the automaker can shape their vision for the future. In this context, is notable to mention how the Zero-Emission Vehicle (ZEV) mandates are influencing the current automotive industry. For example, in UK all vehicles on the roads should be ZEV by 2050, while in Norway anticipate this deadline in 2025. These regulatory requirements were firstly created in California, where they will expire in 2025, and expanded in several state of U.S., Canada and China. The ZEV mandates incentive R&D in zero-emission vehicles by allowing automakers to sell credits
to other automakers that are ICE vehicles. Lastly, in China, the import tax of
25% is forcing established automakers that wants to produce mass market vehicles to build factories in the country or to establish joint-ventures to operate.
Financial incentives are essential for reducing purchase cost and ownership
cost gap between electric and ICE vehicles. EV incentives can be price
reductions, tax breaks, tax exemptions or can be tax differentiation based
on emission. China offers financial and non-financial for EV until $8500, while in Norway, electric cars are exempt from tax acquisition, representing around $11600. The German government offers $4951 direct subsidy for all new purchases, while Japan has introduced an EV subsidy based on range of the car for a maximum of $7700. Despite Financial incentives are the most powerful mechanism to stimulate the demand for electric cars, many countries such France, Portugal, Denmark and Norway are being reducing or facing out
subsidies in the aim to delete completely them in the following years.
§ Battery cost
Despite all the technology improvements, the battery remains the most expensive component in the electric vehicle, since it represents almost 50% of
the total EV price, 18% in 2040 according to our estimations. We project
electric vehicles to reach cost parity against ICE vehicles at battery price around
$100/kWh. Currently the average cost for automakers is $260/kWh and is
expected to strongly decrease in the future. Tesla´s battery cost hovered around $390/kWh few years ago, got down around $150/kWh in 2017. We model by 2040 the battery cost for Tesla will be around $95/kWh, with the parity reached in 2030. Moreover, this reduction will come from the Gigafactory 1´s capacity to
Policy Example
R&D
incentives US R&D tax credit Targets China´s target of 35mn EV
by 2025
Regulations ZEV credits
Financial
Incentives Norway´s tax acquisition exemption for EV
Source: Research Gate Source: International Energy Agency
$90 $100 $110 $120 $130 $140 $150 $160 201 8E 202 0E 202 2E 202 4E 202 6E 202 8E 203 0E 203 2E 203 4E 203 6E 203 8E 204 0E
TESLA INC. COMPANY REPORT
PAGE 8/32
scale the production (30%), the maximization battery´s energy
density/efficiency and technical improvement in the battery technology (55%), and the reduction of raw material and electronic component prices (15%).
A common type of lithium battery consists three major parts: anode, cathode and electrolyte. Although there are several types of batteries in the market, the most adopted is the Lithium-ion because it guarantees lightweight, safety,
energy storage and is high temperature resistant. Many experts predict that
the future introduction of the graphene in the battery chemistry composition will lower the prices as this material is cheap, lightweight, strong and extremely conductive of heat and electricity. Currently, Tesla´s is using NCA chemistry consisting in 50% Nickel, 34% Oxygen, 7% Cobalt, 1% Aluminium and 7% Lithium, but in the future, the company will likely migrate to next-generation chemistries such as NMC81 (80% nickel, 10% manganese,10% cobalt), forecasted to feature higher energy density with more nickel and less cobalt than Tesla’s current NCA chemistry in terms of material weights.
The prices for the key metals in EV batteries have been rising dramatically in the last years due to an increase in speculation and demand. 65% of total global supply is mined in the Democratic Republic of Congo making this material
highly price volatile due to the instability in the region. According to UBS,
the global demand of cobalt will double by 2020 to around 200,000 tonnes per year. While lithium is more abundant, Goldman Sachs expects the demand is expected to be four times greater in 2025 at 779,000 tonnes per year that will cause an expected supply shortfall in the short term. Since the electric supply will be driven by China, many analysts forecast 60% of global new electric cars to be supplied by lithium-battery maker Chinese companies such BYD and CATL.
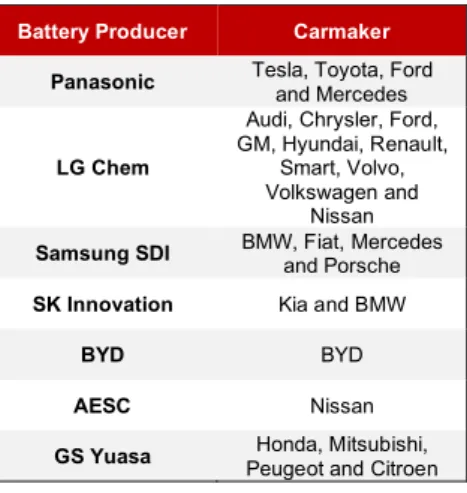
Battery provision is a critical point for any company trying to enter in the EV
market. Many established automakers and companies have tried or are trying to produce batteries for their vehicles. On February 2018, Bosch was the latest of many companies and start-ups to struggle with battery manufacturing, due to rising competition from Asiatic companies and the high investments needed to have a significant manufacturing capacity. GE abandoned the EV battery manufacturing in 2017, concentrating only on energy storage segment, while on a smaller side, batteries producers Acquion and Alevo went in bankruptcy on the same year. On the other side, Volkswagen announced a $25 bln investment plan to build 16 battery production factories by 2022, with its subsidiary Scania, aiming to rival Tesla´s Gigafactory and to become the largest battery cell
Battery Producer Carmaker
Panasonic Tesla, Toyota, Ford and Mercedes
LG Chem
Audi, Chrysler, Ford, GM, Hyundai, Renault,
Smart, Volvo, Volkswagen and
Nissan
Samsung SDI BMW, Fiat, Mercedes and Porsche SK Innovation Kia and BMW
BYD BYD
AESC Nissan
GS Yuasa Peugeot and Citroen Honda, Mitsubishi, 50%
7%
1%
7% 34%
Nickel Cobalt Aluminium Lithium Oxygen
Figure 13: Tesla´s Cathode material breakdown
in %
Source: Research Gate
37% 9% 19% 7% 10% 18%
Cathode Separator Anode Electrolyte Case Others
Source: Nomura
Figure 14: Battery Cell material cost breakdown
in %
Figure 15: Major EV battery producers in 2017
TESLA INC. COMPANY REPORT
PAGE 9/32 manufacturer in Europe with a target of 32 GWh a year by 2023. Since the battery market for EV it’s on an early stage and requires large investments to scale the manufacturing process, the majority of automakers, have outsourced the production to other companies with Panasonic Sanyo, BYD and LG Chem being the top manufacturers of lithium-ion battery, having a respectively market share of 33%, 18% and 17%.
§ EV Market Competition
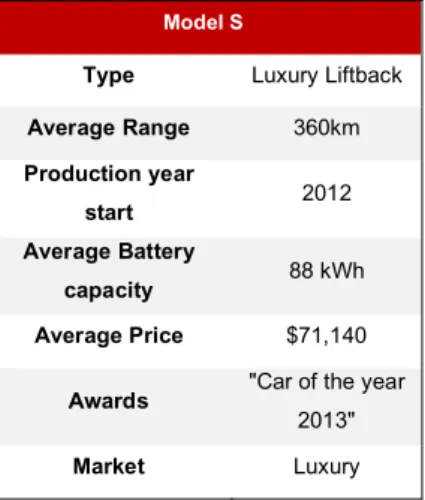
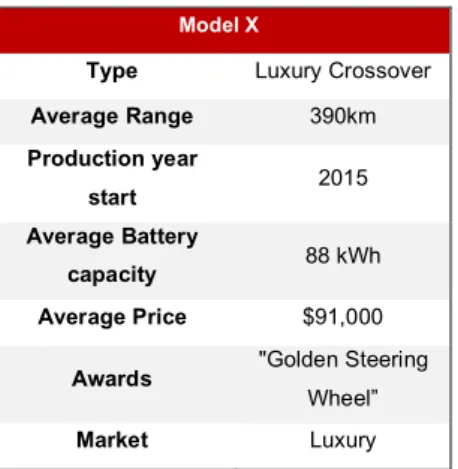
Currently Tesla is producing 3 main models: Model X and Model S for the
Luxury market and Model 3 for the Mass market. Moreover, the company
announced in October 2017, the electric truck Tesla Semi for the Truck market and Tesla Roadster for the Sportscar market that will begin the production respectively in 2019 and 2020. The mass market SUV Model Y and an electric pickup model are expected to be launched in the following years but there are announcements yet. With Semi, Tesla is not aiming to transform the actual large scale semi-truck segment due to the prospect small volume opportunity, but to bring additional value with its model by lowering the fuel cost and cost of
ownership. Many automakers have announced new electric models in the
upcoming years. In the luxury segment, Model X and Model will face competition from several automakers. Jaguar announced the sale of i-Pace, in direct competition with Model X. In 2019, Volkswagen´s premium brand Audi, will launch the e-tron Quattro crossover for the SUV segment, while 2020 will be the year of the e-tron GT as rival of Model S. Another Volkswagen brand, Porsche, announced Mission E, an all-electric sedan expected to go in production by 2019. The Bavarian automaker BMW promised on 2017 a new series of all electric cars, starting with iNEXT in 2020, which the German automaker as positioned as a Model 3 competitor. BMW´s competitor, Mercedes-Benz, plans to gradually introduce new electric models after the launch in 2019 of the electric SUV EQC and in the 2020 of the electric sedan EQS. On the other hand, in the mass market segment, Model 3 is facing or will face competition from several models: BMW i3, Nissan Leaf (2019), Kia Soul, Hyundai Kona, Toyota Prius, Volvo XC40 (2019), Chevrolet Bolt, e-Golf, Ford Fusion Model E and BYD e6. Despite all the upcoming rivalry in the EV market, Tesla automotive business is being challenged by the ICE and Hybrid vehicles. In the sedan luxury segment Lexus RS and LS. In the SUV luxury segment Model X is facing competition from Land Rover, Mercedes M-Class, Porsche Cayenne, Volvo XC90 and Porsche Cayenne. Although almost all the biggest automakers are making mass market vehicles, we believe that the final decision of the consumer whether to
Model 3 Type Four-door Sedan Average Range 400km Production year start 2017 Average Battery capacity 63 kWh Average Price $45,000
Awards "Design of the year"
Market Mass market
Model S
Type Luxury Liftback
Average Range 360km Production year start 2012 Average Battery capacity 88 kWh Average Price $71,140
Awards "Car of the year
2013"
Market Luxury
Source: Company Reports
Figure 16: Model 3 characteristics
Figure 17: Model S characteristics
TESLA INC. COMPANY REPORT
PAGE 10/32 buy an electric vehicle or ICE car will based on the quality-cost, incentives,
cost of ownership and charging infrastructure.
According to Consumer Reports5, Tesla ranked first in the owners´ satisfaction
survey with an average score for all models of 90%. Tesla´s vertical integration of batteries and vehicles manufacturing process offers to the company a
competitive advantage, enabling in the long-term to leverage development
capabilities and improve manufacturing efficiency, while in the same time having a less battery cost compared to the competitors. Regarding the mass market, many are the challenges for the future, such the slow production of the Model 3 and the current battery cost. We model that, once all the production issues are solved and the battery has a competitive cost, Tesla will be able to
efficiently compete with ICE cars.
Energy Generation Sector
World primary energy has grown by an annual average of 2% since 2012 and it is expected to growth by 30% until 2040, although the pace of growth will gradually
slow. The demand will be driven mainly by China and India, the most populous
countries in the World. Factors that will contribute to this raise are the expected growth in population from 7.4bn of today to 9.0bn of 2040, the high rate of urbanization and the expected growth of the World GDP at 3.0%.
Global energy-related carbon dioxide emission from fossil fuels and industry were nearly flat in 2017 at 35bn metric tons and are expected to raise at by 43bn metric tons 2040, with petroleum being the main contributor. The slowing in emission average growth rate with an expected trend in annual increase a 2.2%, is due largely to reduction of coal as power resource, but also to improvements in
energy efficiency and to increasing power generation from renewable resources. As of 2017, several countries (e.g. Canada, Norway, Finland, France,
the Netherlands) are committed to move away from fossil fuels for electricity generation towards renewable energies. Despite this trend, many other countries, in particularly the US, have announce plans to expand coal production and use. In particular, numerous barriers remains for the renewable resources to compete against traditional energy fuels. The average cost in 2017 for large Solar PV installations was $2000 per kWh whereas a new gas plant cost $1000 kWh. Moreover, additional large infrastructure investments are needed to properly connect to the grid the various renewable energy stations. In this context, is reasonable to think that several countries will wait an improvement of the current
5Car Brands Ranked by Owner Satisfaction (2017), Consumer Reports
Model X
Type Luxury Crossover
Average Range 390km Production year start 2015 Average Battery capacity 88 kWh Average Price $91,000
Awards "Golden Steering
Wheel”
Market Luxury
Source: Ren21
Figure 18: Model X characteristics
Source: Company Reports
17 48 4 74 50 36 0 10 20 30 40 50 60 70 80 Coal Gas Nucle ar Solar PV Wind Othe r ren ewab les
Figure 19: Global average net capacity
addition by energy resource type from 2017 to 2040
TESLA INC. COMPANY REPORT
PAGE 11/32 technology and a decrease in the overall installation cost before shifting form traditional energy resources to renewable energy resources. However, in the past ten years, improvement in efficiency, declining in cost and environmental awareness have contributed to a rapid increase of renewables as an important energy source to meet the global demand for energy. Many Government will continue to support renewable electricity worldwide, increasingly through
competitive auctions rather than feed-in tariffs, and the conversion of the power
sector from coal and oil to zero-emission energy sources, will amplified by millions of households, communities and businesses investing directly in distributed Solar PV.
§ Solar PV Deployment
The photovoltaic installations have been rising with an exponential growth over the past decade, estimated to supply between 1.5% and 2.1% of global electricity demand. On 2017, Solar PV was the leading source of additional GW deployment.Growth in the photovoltaic industry is extremely dynamic and varies across the countries. Top installers of 2017, that accounted for 85% of the additional power generating capacity, were Europe with 44 GW followed by China with 18 GW and USA with 15 GW. Nevertheless, Emerging countries contributed significantly to the global growth, as many authorities are starting to see Solar PV as a cost-competitive resource compared to the traditional for producing electricity. However, for most of the countries, the tremendous growth is driven by
government incentives. The residential market experienced a slower expansion due the approaching saturation of the part of the markets among early
adopters. In line with the International Energy Agency (IEA), we forecast total Solar PV annual deployment to grow from 124 GW of 2018 to 2,818 GW of 2040. China is expected to overtake Europe as the largest producer of PV electricity after 2021, increasing from 19% of annual deployment of 2018 to 40% by 2030 then slowly decreasing at 37% by 2040. By contrast, the share of USA is expected to remain constant at 15% while for Europe we model to experience a decrease from 37% of 2018 to 4% of 2040. Utility and Industrial installations will have the largest share in PV installations, with 54 GW annual deployment in 2018 and 1,346 GW in 2040.
§ Photovoltaics Incentives
As of 2018, nearly all of the countries have adopted policy in favour of Solar PV or any other renewable source deployment directly through some mix of
incentives legislated at the national and local level. Governments use financial
500 1,000 1,500 2,000 2,500 3,000 FY 2 017 201 9E 202 1E 202 3E 202 5E 202 7E 202 9E 203 1E 203 3E 203 5E 203 7E 203 9E
Figure 20: Global annually PV deployment
in GW
Source: International Energy Agency, IRENA, Own estimations 20 10 7.5 7.5 4.3 0 5 10 15 20 25
China US Japan India Germany
Figure 21: Cumulative waste volumes of top
five countries for end-of-life PV panels in 2050, in million t
Source: IRENA
Figure 22: Global annually PV deployment by
region, in GW 500 1,000 1,500 2,000 2,500 FY 2 017 201 9E 202 1E 202 3E 202 5E 202 7E 202 9E 203 1E 203 3E 203 5E 203 7E 203 9E
Europe USA RoW China
Source: International Energy Agency, IRENA, Own estimations
TESLA INC. COMPANY REPORT PAGE 12/32 0% 10% 20% 30% 40% 50% 60% 70% 80% 90% 100%
Residential Commercial Utility Module
Inverter
Structural and electrical components Labor
Others
incentives for photovoltaics installations when there is no parity cost with the
energy generate from traditional resources. Such policies are often aiming to promote energy independence from other countries or to reduce emission of carbon dioxide. When the “grid parity” is reached, meaning the levelized cost of energy (LCOE) from Solar PV installations is equal or less to the price of purchasing power from the grid, these financial incentives are no more needed. Currently, the most common used financial incentives are Subsidies, Feed-in
Tariffs and Net Metering. With the first one, the governments refund in form of
tax credits part of the total cost for PV installations while with Feed-in Tariffs (FITs), the authorities pay the producers of energy at a cost-based price for the PV energy they supply to the grid. Similarly, the Net Metering allows the consumers to rebuy the excessive energy by paying only the net consumption (the amount of energy they bought minus the amount of energy they produce). While the majority of European countries, Australia, China and Russia FITs and government subsidies, in the U.S. the most used incentives are the Net Metering and a 30% Federal Tax credit on residential and business PV installations, planned to drop at 22% by 2021 and 10% from 2022 onward. However, tenders (competitive bindings or auctions) are quickly expanding as a form of support for Solar PV deployment of large-scale projects.
§ Solar Panels Costs
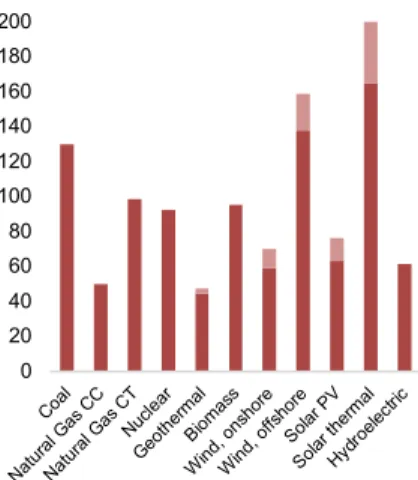
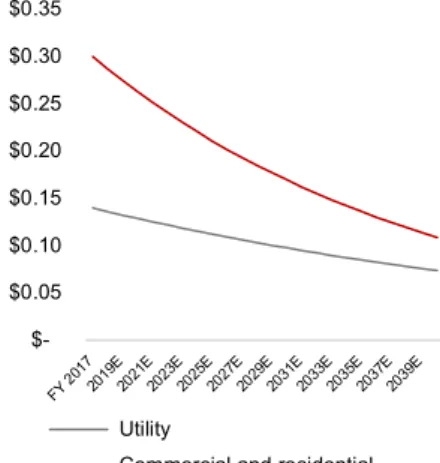
Solar panels cost is continuously decreasing over the past year. The main expenses differ from the type of the PV installation, (Utility, Commercial and Residential), but we can regroup in five different categories: Other soft costs (Land acquisition, Taxes, Overhead, etc.), Labour costs, Hardware (Structural and Electrical components), Inverter and Module. We forecast module cost in particular, that accounts for the majority of the total cost, to decrease from $0.76 per watt to $0.28 per watt by 2040, in line with the NREL agency, since the efficiency improvement will decrease the number of modules required to construct a system of a given size. The other costs, summed, will decrease at $0.08 per watt and $0.14 per watt by 2040, respectively for Utility and Commercial and Residential.
The reductions in installed cost, along with improvements in operations, system design and technology will result in a significant decrease in the cost of electricity and the range of LCOE (levelized cost of energy) across the countries will continue to narrow, helping to make Solar PV increasingly competitive with fossil power resources. We model a decrease from $0.14 per watt of Utility and $0.29 per watt of Commercial and Residential installations of 2018 till $0.07 per
Source: NREL 0 20 40 60 80 100 120 140 160 180 200 Coal Natu ral G as CC Natu ral G as CT Nucle ar Geot herm al Biom ass Wind , ons hore Wind , offs hore Solar PV Solar ther mal Hydr oelec tric
Total system LCOE without tax credit Total system LCOE with tax credit
Source: US Energy Information Administration
Figure 23: Estimate LCOE for new
generation resources entering in service in 2022 ($/MWh) in US
Figure 24: Cost structure of PV installations by
TESLA INC. COMPANY REPORT
PAGE 13/32 watt $0.11 per watt by 2040. The average LCOE of new-built PV plant is expected to fall below $100 per MW by 2025 and decreasing $60 per MW by 2040. We project also the average LCOE of new-built rooftop PV system to fall on average below $100 by 2030 and gradually reach $80 by 2040.
§ Competition
China accounts for more than half of global module productions with top manufacturer being the Chinese company JinkoSolar, the Canadian company Canadian Solar, followed other two Chinese companies, Trina Solar and JA Solar. Overall, consolidation in the Solar PV manufacturing industry is continuing by
lowering the prices and the margins, forcing many companies to go in
bankruptcy, especially in US and Europe. For example, SunEdison, once one of the biggest solar panels producers in the countries, declared insolvency in 2016, after a rapid growth and a significant debt accumulation, while in 2017 emerged from the bankruptcy procedure.
On the other side, the Solar PV installation segment has shown new players facing in the market, such Foxconn, GE, Gamesa, Goldwind and Mindgyang. Moreover, electric utilities are financing large-scale Solar PV and other renewable projects, with the goal to be free from fossil energy resources. For example, Tata Power commissioned a 50 MW solar plant in India; Innogy, renewable subsidiary of RWE, is planning to further expand its business in Germany, the Netherland and the U.S. by building new large-utility photovoltaic systems; EDF intends to develop and build 30 GW of solar plants in France by 2035. Even traditional oil companies are moving toward the PV sector: BP has increased its stake at 43% in the Europe’s biggest solar developer Lightsource; Total continues to build solar plants thought Total Solar while the other subsidiary SunPower is suppling solar panels; Shell acquired 44% stake of the U.S. solar project developer, owner and operator Silicon Ranch Corporation.
Energy Storage Sector
As energy renewables grow, electricity need to be stored over days, weeks or months. Storage systems can guide the energy industry to an entire decarbonisation and help to transform the entire society. Thus, the Energy Storage will play a crucial role in the future both economically and environmentally and the adoption will be led by three main drivers: affordability,
reliability and sustainability. Stationary electricity storage can provide a wide
range on energy services in an affordable way, while batteries are crucial element
$0.05 $0.10 $0.15 $0.20 $0.25 $0.30 $0.35 FY 2 017 201 9E 202 1E 202 3E 202 5E 202 7E 202 9E 203 1E 203 3E 203 5E 203 7E 203 9E Utility
Commercial and residential
Figure 25: Average electricity price per kWh
from PV plants from 2017 to 2040
Source: NREL, Own estimations
1,000 850 800 750 579 550 550 500 458 345 0 1,000
Kurnool Ultra Mega Solar Park (India) Longyangxia Dam Solar Park (China) Mohammed bin Rashid Al… Rewa Ultra Mega Solar Park (India) Solar Star Projects
(U.S.) Desert Sunlight
(U.S.) Topaz (U.S) Golmud Solar Park
(China) Copper Mountain Solar Facility (U.S.) Charanka Solar Park
(India)
Figure 26: Largest Solar PV plants worldwide
as of June 2017, by capacity in MW
TESLA INC. COMPANY REPORT
PAGE 14/32 in transforming the actual cars in a zero-emission and electrified vehicles. Electricity storage technologies are becoming as a solution increase the
adoption and the access to electricity in conjunction with Solar PV in solar house
systems. According to the International Energy Agency6, Electricity storage
products can increase the fraction of renewable energy stored in solar home systems and mini-grids as high as 100%.
§ Energy Storage Deployment
Energy Storage has been principally used as support of electricity grid by providing backup energy during power outages and other energy scarcities. Energy storage systems can accumulate energy when the demand is low and the supply is high, and release the stored energy when the demand is high. Storage batteries can provide system benefits and flexibility for business and individuals performing as a direct energy provider. In agree with the IRENA´s forecast, we model the annual deployment of energy storage products to pass from 4 GW of 2018 to 1,858 GW of 2040. We calculate that 25% of all deployment will be done in U.S and the remaining to be across China, Japan, Australia, UK and India.
§ Energy Storage Market Competition
Tesla is a leading company in providing energy storage systems for residential
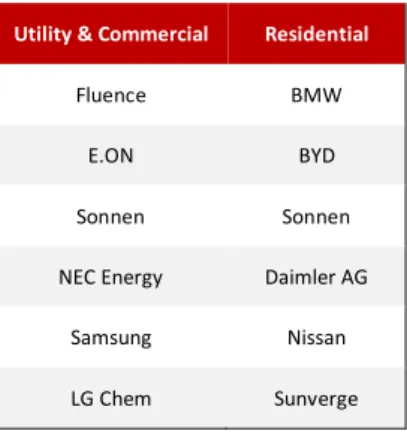
and utility-scale projects. On 2017, the company built a 129 MW battery backup system in Australia, the biggest at the date, entirely made with assembled powerpacks. As of 2017, Tesla has 360 MW worth of battery-powered storage system across 20 countries, while direct competitors AES and Siemens have deployed 463 MW across 13 countries, with their joint-venture Fluence. Tesla is not the only company to operating in energy storage system for residential and business application. Many start-ups and established automakers are entering or will enter in the market. On 2017, Daimler AG started delivery home battery storage systems, firstly designated for automotive use. However, in May 2018, the company bows out from the sector due to the difficulty of adopting EV batteries to suits the necessities of the residential market. German´s electricity utility E.ON is offering solar storage solution and products for its clients while another German company, Sonnen, launched in 2016 battery systems for residential use, priced way below and company´s existing similar products. In 2017, Sonnen dominated the European PV storage market with 22% market share, followed by Seneca at 12% and LG Chem with 10%. We believe Tesla to increase its market share in Europe once it will ramp the production of storage batteries in the Gigafactory 1.
6Global EV Outlook 2017 (2017), International Energy Agency
Utility & Commercial Residential
Fluence BMW
E.ON BYD
Sonnen Sonnen NEC Energy Daimler AG
Samsung Nissan LG Chem Sunverge 200 400 600 800 1,000 1,200 1,400 1,600 1,800 2,000 FY 2 017 201 9E 202 1E 202 3E 202 5E 202 7E 202 9E 203 1E 203 3E 203 5E 203 7E 203 9E
Figure 27: Global annual energy storage
deployment in GW, from 2017 to 2040
Source: IRENA, Own estimations
Figure 28: Tesla´s Competitors in the
Energy Storage segment
TESLA INC. COMPANY REPORT
PAGE 15/32 Many are the partnerships that were launched in 2017, such the joint venture between Samsung and the Solar PV inverter producer Sungrow, with the aim to create energy storage systems. Moreover, the US company Emphase Energy entered in the Australian market, competing with Tesla and LG Chem in the surge of rooftop solar panels installations in the country. Regarding the large scale
utility projects, Tesla is facing a rising competition from different international
companies. On 2018, The Japanese NEC Energy solutions, owned by NEC, announce to supply Orsted Energy UK with a 20 MW Grid storage solution by the end of the year, while Fluence declared in the same year that will build a 100 MW system in California.
On the other side, Panasonic Sanyo, is dominating the production of lithium-ion batteries for EV, with double the output of its nearest competitor (33% market share). The company is collaborating with Tesla for the mass production of lithium batteries in Gigafactory 1. Other leading companies of batteries for EV are South Korean companies Samsung (9% market share) and LG Chem (17% market share) and Chinese companies Wanxiang (5% market share), GS Yuasa (3% market share) and Lishen (3% market share).
§ Energy Storage Policies
Policies in support for the energy storage deployment includes mandates,
targets, tenders, utility mandates as well as financial incentives and tax credits. As of 2018, few countries have adopted policies in favour of energy
storage sector, however this technology is receiving increased attention and support from policy makers all around the world. Mandates have been a common form of incentives for large scale utility projects while tenders have been applied in presence of Solar PV projects that included battery storage. Some states use financial incentives to improve the competitiveness of the emerging energy storage technology. Germany has implemented a guaranteed feed-in tariff, low-interest loans and grants and other incentives for PV systems with battery storage. Moreover, many countries in Europe offers tax credits and subsidies for the customers that are installing energy storage systems in addition to Solar panels, while Sweden announced on late 2016 support for energy storage and smart grid technology to facilitate the deployment of home energy storage systems, covering 60% of the cost of the installation, up to $5600. In Japan, leading producer of batteries, is present a subsidy for residential storage products, while China had implemented a similar approach by offering incentives, such grants and domestic quotas, to expand the development of domestic storage systems. In the U.S. is present a tax credit, up to 30%, for qualified energy storage systems.
60% 20% 13% 7% Battery Cells Labor Battery Pack
Battery Management System
Figure 29: Energy Storage System cost
breakdown by component, in % 0 1000 2000 3000 4000 5000 6000 US Japa n Chin a Germ any Italy Sout h Ko rea India RoW 2010 2015 2020
Figure 30: Battery storage market value,
top seven countries and rest of the world, 2010, 2015 and 2020, in mn
TESLA INC. COMPANY REPORT
PAGE 16/32
Company Analysis
Automotive division
§ Automotive Revenues
We believe that Tesla´s capability to meet its target will depend on how will improve its production efficiency in its main automotive Factory in Freemont and in Gigafactory 1 in Nevada. Currently the bottleneck for the Model 3 scalability is the battery assembly; we modelled that Tesla will ramp-up and solve the production´s issues by 2020, when it will reach its maximum output at 45 GW/year. Moreover, to accomplish its targets, Tesla will need to expand the Gigafactory 1 or build more Gigafactories; we model that by 2040, the company´s annual batteries production will be 250 GW/year, split in 70% for vehicles and 30% for storage batteries. We estimate that the total annual vehicle sales will be 221,900 (company´s target is 500,000) in 2018 and 592,217 (company´s target is 1,000,000) by 2020, reaching 1,911,347 in 2040 with a CAGR over the forecasted period of 10.3%. Overall, we believe that Model 3 will increase its weight in the total annual sales at 83% (1,244,478 vehicles) in 2030 and will gradually decrease in 2040 at 80% (1,519,559 vehicles) due to the growing importance of Tesla Semi (5% in 2040) that will start the production in 2020. Model S, Model X and Roadster will reach 6%, 9% and 1% of the total sales by 2040. The main market for the company will still remain U.S. due to its dominant position and few competitor (61% in 2018, 75% in 2040), followed by China (24% in 2018, 10% in 2040), Europe (14% in 2018, 8% in 2040) and the remaining countries (1% in 2018, 7% in 2040).
We believe that for Tesla will be hard to increase its sales in China due to the competition of many EV markers such BYD and Great Wall, while in Europe, consumers will prefer established automakers such Volkswagen Group, Fiat-Chrysler Group and PSA group. In total, we estimate revenues from vehicles, including leasing, for $103bn in 2040 against the $13bn of 2018 with an overall CAGR of 9.7%. Moreover, leasing will have a notable positive impact in the overall revenues. We believe that 36% of Model S, 39% of Model X and 44% of Model 3 sales will be complete trough Tesla´s leasing program, generating $26bn in 2040 ($1.4bn in 2018). We estimate that thanks to the reduction in the battery cost and improvement in production due to the Gigafactory 1, gross margins for the automotive division will increase up to 25% in 2035 and gradually decrease at 21% in 2040 due to the raising in competition from several established and new automakers. ´ ´ 50 100 150 200 250 300 201 8E 202 0E 202 2E 202 4E 202 6E 202 8E 203 0E 203 2E 203 4E 203 6E 203 8E 204 0E Gigafactory 1 Gigafactory 2
Figure 31: Gigafactory 1 & 2 annual
deployment in GW, from 2017 to 2040
Source: Company Reports, Own estimations
Figure 32: Gigafactory 1 production by
type, in GW, from 2017 to 2040
Source: Company Reports, Own estimations
Figure 33: Annual deliveries by model,
from 2017 to 2040 0 500,000 1,000,000 1,500,000 2,000,000 2,500,000 FY 2 017 201 9E 202 1E 202 3E 202 5E 202 7E 202 9E 203 1E 203 3E 203 5E 203 7E 203 9E
Roadster Semi Model S Model X Model 3 50 100 150 200 250 300 FY 20 17 2019 E 2021 E 2023 E 2025 E 2027 E 2029 E 2031 E 2033 E 2035 E 2037 E 2039 E
Storage batteries Vehicles batteries
TESLA INC. COMPANY REPORT
PAGE 17/32
§ Services and Regulatory Credits
In 2016, Tesla announced that every model bought from January 2017 would not have any more the right to use the Supercharger for free but would have 1,000 miles (400 kWh) as credit, and then have to pay a fee per each kWh extra. We modelled that, on 2018, Tesla will generate $75mn ($231 per Supercharger´s user), taking in account that the car´s owners will use charging stations 15% of their time (13% in 2040) and a price per kWh at $0.26 ($0.37 in 2040). With the
introduction of Megachargers in 2020 (output till 1MW) for Tesla Semi, we
forecast that on 2040 the revenues from Supercharger´s stations will be $6bn and the revenues from Megachargers´ stations will be $8bn, forecasting a 48% usage (50% in 2020) and a price per kWh at $0.12 ($0.10 in 2020).
Due to technical improvements in the autopilot technology (currently Tesla
has Level 4), we estimate that the new models that will be produced after 2025 will have Autopilot Level 5 or fully autonomy. In consequence, many people will start using Tesla´s car sharing model or Tesla Fleet, where the car owner will share its fully autonomy vehicle with other people when he it is not using the car. Comparing current car sharing companies´ prices, we estimate that the total fee per mile charged by the car´s owners to the users will be $0.75 with Tesla keeping 20% ($0.15). We assumed that 10%, 15% and 20% respectively of Model X, Model S and Model 3 in circulation after 2025 will be used for the Tesla Fleet network, increasing to 20%, 25% and 40%. Moreover, we model that an average user will use Tesla´s car sharing network for an amount equal at 19% of its annual miles, gradually increasing at 34% in 2040, when the overall technology will be fully tested and perfectioned. Overall, we estimate in 2025, $256mn revenues for Tesla Network growing with an annual CAGR of 30% at $13bn in 2040. In addition, Tesla is offering maintenance and additional repair services for its
customers. We forecast this value to 1% of the automotive sales in 2018 and
consequently growing at the same of the vehicles sales. Another significant source of revenues are the sales of ZEV credits attributed to the cars sold in U.S. With an average ZEV credit market price of $1,000, we estimate Tesla to generate $468mn in 2018, growing till $3bn in 2025 and after this period, we believe that these incentives will totally expire.
Energy Generation and Storage division
Tesla acquired SolarCity, market leader in U.S. for solar panels installations, in 2016, to create synergies with its automotive and energy storage division and to better accomplish the long-term vision. In the same year, the company
Figure 34: Total Automotive Revenues
breakdown, in mn, from 2017 to 2040
Source: Company Reports, Own estimations $20,000 $40,000 $60,000 $80,000 $100,000 $120,000 FY 2 017 201 9E 202 1E 202 3E 202 5E 202 7E 202 9E 203 1E 203 3E 203 5E 203 7E 203 9E Automotive sales Automotive leasing $2,000 $4,000 $6,000 $8,000 $10,000 $12,000 $14,000 201 8E 202 0E 202 2E 202 4E 202 6E 202 8E 203 0E 203 2E 203 4E 203 6E 203 8E 204 0E Supercharger Megacharger Tesla Network ZEV Other services
Figure 35: Services and other
revenues breakdown by type, in mn, from 2018 to 2040
Source: Company Reports, Own estimations
1,000,000 2,000,000 3,000,000 4,000,000 5,000,000 6,000,000 7,000,000 8,000,000 9,000,000 10,000,000 202 5E 202 6E 202 7E 202 8E 202 9E 203 0E 203 1E 203 2E 203 3E 203 4E 203 5E 203 6E 203 7E 203 8E 203 9E 204 0E Model S Model X Model 3
Source: Own estimations
Figure 36: Cumulative Tesla Network
TESLA INC. COMPANY REPORT
PAGE 18/32 announced Tesla Roof, a particular type of solar shingles designed look like a functional and aesthetical normal roof. Currently, the company is proposing four types of purchasing model for solar panels installations: Direct Cash, Power
Purchase Agreements, Leasing and Loans. We forecast SolarCity division to expands its services in Europe and China, thus part of revenues will come from
government credits due to PV installations. Taking in account the current environmental policies and solar subsidies, we calculate credits to be 34% of total user´s installation in 2018, down to 22% in 2021 and stabilizing at 10% until 2040, generating revenues for $402mn in 2018 growing to $7bn in 2040. Overall, we estimate the Energy Generation and Storage division sales for $2bn in 2018, growing at $129bn in 2040 with a CAGR of 21% over the forecasted period.
§ Solar PV
Since the creation, Solar City has targeted only the U.S., having 31% market share in 2017. We model Tesla to expand its operation firstly in Europe and later in China and in the Rest of the World, although we forecast U.S. to remain the biggest market. Globally, we estimate a total deployment for the Energy Generation division of 624 MW in 2018, up to 30 GW in 2040, reaching 1% of global market share (0.5% in 2018). We calculate 574 MW deployed from Solar PV, rising up to 18 GW respectively in 2040. Main drivers for the revenues will
be the payment type mix; since in 2017, Tesla decided that will push the buyers
of Solar PV systems to use Cash or PPA as a payment model, we calculate for 2018, 56% of the revenues (70% in 2040) to come from Cash, 19% (17% in 2040) from MyPower, 15% (8% in 2040) from PPA and 10% (5% in 2040) from Leasing. Overall, we estimate Solar PV segment to generate revenues for $842mn in 2018, rising to $11bn in 2040. Moreover, in 2018, 77% of total revenues will come from Residential installations, 22% from Commercial and 1% from Utility. We project a reduction in share from Residential installations till 10% by 2040, due to cannibalization from Tesla Roof, while we calculate 50% of revenues to come from Commercial and 40% of revenues come from Utility installations.
§ Tesla Roof
On 2016, Tesla unveiled a new product for its Energy Generation segment: The Tesla Roof, a new type of solar shingle designed to look like and integrate with conventional asphalt roof shingles. The product is designed
for customers who would like to have solar panels on their homes without
committing to the questionable aesthetics of traditional photovoltaic
systems. The company states Tesla Roof to be manufactured in the $20,000 $40,000 $60,000 $80,000 $100,000 $120,000 $140,000 201 8E 202 0E 202 2E 202 4E 202 6E 202 8E 203 0E 203 2E 203 4E 203 6E 203 8E 204 0E
Solar Credits Solar Roof Solar PV
Figure 37: Energy Generation sales
breakdown by type, in mn, from 2017 to 2040
Source: Company Reports, Own estimations
2.0 4.0 6.0 8.0 10.0 12.0 14.0 16.0 18.0 20.0 FY 2 017 201 9E 202 1E 202 3E 202 5E 202 7E 202 9E 203 1E 203 3E 203 5E 203 7E 203 9E
Residential Utility Commercial
Source: Company Reports, Own estimations
Figure 38: Solar PV annual deployment
TESLA INC. COMPANY REPORT
PAGE 19/32 Gigafactory 2. We estimate Tesla deploying 50 MW of solar shingles in 2018, increasing to 12 GW by 2040. Since Tesla Roof will target the Residential segment of PV installations, will be offered only two payment options: Cash
and MyPower. We calculate the first to generate 60% (80% in 2040) of total
annual sale, corresponding to $351mn in 2018, growing at $55bn at the end of the forecasted period. Main driver of revenues will be the total percentage customers´ roof covered with solar shingles, estimated at 35%, with the price of those decreasing form $40 per square foot in 2018 to $15 in 2040, in line the price of solar panels evolution. Overall, Tesla Roof margins will be
negative till 2026, reaching 14% in 2040, due to an increase in the solar
shingles coverage and a decrease in production costs.
§ Energy Storage
When examining what are the main drivers for the customers in choosing Tesla´s storage products, we have to take in account several factors, such efficiency and
performance, battery size, aesthetics, energy consumptions and grid connection. Currently, Tesla is producing two types of storage products
targeting two different markets: the Powerwall 2 is a 13.5 kWh battery priced around $5,900 addressed to the residential market, while the Powerpack 2 is used to create battery storage power stations. Having a single capacity of 200 kWh and priced around $398 per kWh, the Powerpack 2 can be assembled with other Powerpacks, creating an extended storage facility, ideally for the commercial and utility large scale projects. Although, Tesla has many competitors in the Energy Storage sector, especially LG, BYD, Enphase Energy and many other automakers are entering or have entered in the market such BMW, the first mover-advantage, the price-quality, the brand awareness and the feasibility of the construction of storage power stations with Powerpacks, are will be a crucial
element for Tesla revenues. We think that Gigafactory 1 will remain the main factory for battery production dedicated to the Energy Storage and Vehicle division. We estimate for 2018, 110 MW and 270 MW total deployment for Powerwalls and Powerpacks, increasing by 2040 at 7 GW and 26 GW annual deployment, respectively. Main drivers for the growth will be the implementation with SolarCity´s PV systems for Powerwalls installations, while for Powerpacks installations will be an increasing demand from large scale energy projects. We estimate in 2018, the Energy Storage division will have margin of 20% out of $340 mn revenues, increasing 2040 at 23% out of $6 bn revenues, due to a further expansion of Gigafactory 1 and a decreasing in cost for the battery production.
2.00 4.00 6.00 8.00 10.00 12.00 FY 2 017 201 9E 202 1E 202 3E 202 5E 202 7E 202 9E 203 1E 203 3E 203 5E 203 7E 203 9E Cash MyPower
Figure 39: Tesla Roof GW annual
deployment by payment type from 2017 to 2040
Source: Own estimations
$5 $10 $15 $20 $25 $30 $35 $40 $45 FY 2 017 201 9E 202 1E 202 3E 202 5E 202 7E 202 9E 203 1E 203 3E 203 5E 203 7E 203 9E
Price solar shingles Price non solar shingles
Figure 40: Price of solar and non-solar
shingles per square feet from 2017 to 2040 5 10 15 20 25 30 35 FY 2 017 201 9E 202 1E 202 3E 202 5E 202 7E 202 9E 203 1E 203 3E 203 5E 203 7E 203 9E Powerall Powerpack
Figure 41: Energy Storage deployment
in GW by product, from 2017 to 2040
Source: Company Reports, Own estimations Source: Own estimations
TESLA INC. COMPANY REPORT
PAGE 20/32
Company Valuation
Risk and Competitiveness Analysis
Tesla sells its vehicles, energy generation and storage products exclusively through Tesla Stores. While in the long-term this can save SG&A costs, however, may slow the sales due to the not extensive geographical coverage of its stores. Moreover, since the beginning of its history, Tesla has been focusing on design
and technology of its products, implementing new production processes
through advanced engineering. Nonetheless, the company has never seen a profitable year despite the exponential increase of the revenues. Facing a high demand, an R&D and SG&A, historically Tesla has been struggling to scale up
the manufacturing processes of its products. Since the introduction of Model
3, the company has never meet the demand, consistently not hitting its production targets.
At Gigafactory 1, Panasonic is in charge of manufacturing the battery cells for Model 3, which Tesla assembles into battery modules and ships to the Freemont factory, where they will be mounted in the vehicles. In order to support its targets, Panasonic needs to reach a rate over 15 GWh per years of battery cells to fix be able to solve the Model 3 shortfall. We model, Gigafactory 1 to produce 19 GWh of batteries by the end of 2018, thus fixing the current bottleneck in the manufacturing process. We model also, the company to be profitable on 2023, once will fix all production issue and will receive the positive of effects of the economy of scale from Gigafactory 1, the introduction of new services such Tesla car sharing network (Tesla Fleet) and the reduction of cost of total R&D and SG&A caused by synergies between the divisions. However, the company´s burning cash rate is high and if the company will not fix the Model 3 shortfall, will lose credibility in front of the investors and the consumers.
Since Tesla will compete against more established companies, we believe that the high targets that the company is setting, the diversity of its division and the competition from companies that are only focusing in one sector, may have a negative impact into the market penetration for all its operating segments. Lastly, the current CEO Elon Musk is spreading in many different projects and has proven to overestimate company´s performance and targets, leading in our opinion to an excessive enthusiasm from the investors, even though we believe the clean energy will have a highly significant impact in all industrial sectors. In the
long-term, if the company consistently does not meet its announced targets, will create $1,000 $2,000 $3,000 $4,000 $5,000 $6,000 $7,000 201 8E 202 0E 202 2E 202 4E 202 6E 202 8E 203 0E 203 2E 203 4E 203 6E 203 8E 204 0E
Figure 42: Energy Storage revenues,
in mn, from 2018 to 2040
Source: Own estimations
315 310 257 238 187 125 124 115 114 107 93 0 100 200 300 400 Tesla Model S Tesla Model 3 Tesla Model X Chevrolet Bolt BYD e6 Volkswagen e-Golf Hyundai Ioniq Ford Focus Electric BMW i3 Nissan Leaf Kia Soul
Figure 43: Average range in miles for
the best-selling EV models
Source: US Energy Department
$10,310 $113,580 $152,549 $196,164 $94,219 $154,287 Tesla BMW Daim ler Volks wage n GM Ford
Source: Company Reports
Figure 44: 2017 Debt comparison