1 | P a g e
Human Centric Routing Algorithm for
Urban Cyclists and the Influence of
Street Network Spatial Configuration
ii | P a g e
Human Centric Routing Algorithm
for Urban Cyclist and the Influence of
Street Network Spatial Configuration
Thesis supervised by
Carlos Granell
Institute of New Imaging Technologies,
Universitat Jaume I
Castellón de la Plana, Spain
Gabriele Filomena
Institute of Geoinformatics,
University of Münster
Münster, Germany
Tiago H. Moreira de Oliveira
NOVA Information Management School
Universidade Nova de Lisboa
Lisbon, Portugal
iii | P a g e
Acknowledgements
I would like to express my utmost gratitude to the following people, this thesis would not have been possible without their support.
First of all, I would like to thank my supervisors Carlos Granell for giving me valuable guidance from the very beginning until the last moment. Gabriele Filomena for inspiring me with his research, aided me in technical challenges and provided me valuable advice with his extensive knowledge in the topic. And Tiago Oliviero for having a keen eye in giving me helpful feedback.
My sincere gratitude to the Erasmus Mundus Masters of Geospatial Technologies Program, for giving me such an amazing opportunity to learn from experts of this field in Europe. Special thanks to my GeoTec family, whom I have been sharing this beautiful experience with.
Last but not least, I would like to thank my family and friends, who have been believing in me, showing their loving support and encouragement.
iv | P a g e
Abstract
Understanding wayfinding behavior of cyclist aid decision makers to design
better cities in favor of this sustainable active transport. Many have modelled the
physical influence of building environment on wayfinding behavior, with cyclist
route choices and routing algorithm. Incorporating cognitive wayfinding
approach with Space Syntax techniques not only adds the human centric element
to model routing algorithm, but also opens the door to evaluate spatial
configuration of cities and its effect on cyclist behavior. This thesis combines
novel Space Syntax techniques with Graph Theory to develop a reproducible
Human Centric Routing Algorithm and evaluates how spatial configuration of
cities influences modelled wayfinding behavior. Valencia, a concentric gridded
city, and Cardiff with a complex spatial configuration are chosen as the case study
areas. Significant differences in routes distribution exist between cities and
suggest that spatial configuration of the city has an influence on the modelled
routes. Street Network Analysis is used to further quantify such differences and
confirms that the simpler spatial configuration of Valencia has a higher
connectivity, which could facilitate cyclist wayfinding. There are clear
implications on urban design that spatial configuration with higher connectivity
indicates legibility, which is key to build resilience and sustainable communities.
The methodology demonstrates automatic, scalable and reproducible tools to
create Human Centric Routing Algorithm anywhere in the world. Reproducibility
self-assessment (https://osf.io/j97zp/): 3, 3, 3, 2, 1 (Input data, Preprocessing,
Methods, Computational Environment and Results).
v | P a g e
Keywords
Routing Algorithm Space Syntax Graph Theory Spatial Configuration BikeabilityCyclist Route Choice Reproducibility
vi | P a g e
Acronyms
Artificial IntelligenceApplication Programming Interface Computer Aid Design
European Petroleum Survey Group Geographic Information System Global Positioning System Origin and Destination OpenStreetMap
Portable Document Format Street Network Analysis Street Network Functions Visual Basic .Net
World Geodetic System
AI API CAD EPSG GIS GPS OD OSM PDF SNA SNF VB.NET WGS
vii | P a g e
Contents
Introduction ... 1 Background ... 1 Motivation ... 2 Research Questions ... 3 Section Summary ... 4 Literature Review ... 5Concepts on Street Network Modelling ... 5
2.1.1. Graph Theory ... 5
2.1.2. Representation of Street Network ... 6
Cyclist Route Choices: through Spatial Cognition and Bikeability ... 9
Routing Algorithm ... 11
2.3.1. Current cyclist routing applications & their algorithms... 11
2.3.2. How studies integrate weights... 12
Reproducibility of Urban Studies ... 13
3. Methodology ... 15
Diagram & Workflow ... 16
Software & Platform ... 17
Case study area... 19
Graph Creation ... 20
3.4.1. Street Network data download ... 20
3.4.2. Create Primal Graph ... 21
3.4.3. Create Dual Graph ... 22
3.4.4. Graph Statistics & Visualization... 23
3.4.5. Mapping Weights ... 24
Impedance Modelling ... 25
3.5.1. Parameters Calculation ... 25
Impedance Calculation ... 28
3.6.1. Physical Difficultly: Slope and Length Impedance ... 28
3.6.2. Cognitive Difficulty: Angular Impedance ... 30
3.6.3. Comfort: Bike Path ... 31
3.6.4. Weighted sum model ... 31
Routes Creation & Visualization ... 32
viii | P a g e
3.7.2. Routing Algorithm ... 33
3.7.3. Mapping routes ... 34
3.7.4. Visualization ... 34
Routing Algorithm Evaluation ... 35
3.8.1. Visual Comparison ... 35
3.8.2. Quantitative Comparison ... 35
3.8.3. Street Network Analysis ... 36
4. Results & Analysis ... 37
Routes visualization ... 37
4.1.1. Visualization on Jupyter Notebook ... 37
4.1.2. Routes Comparison ... 38
Routes Statistics ... 44
4.2.1. Parameters Correlation ... 45
4.2.2. Street Network Analysis ... 47
5. Discussion ... 50
Route Characteristics ... 50
Spatial Configuration of cities and its influence ... 51
Reproducibility ... 53
Limitations & Recommendations ... 54
6. Conclusion ... 56
7. References ... 57
ix | P a g e
Figures
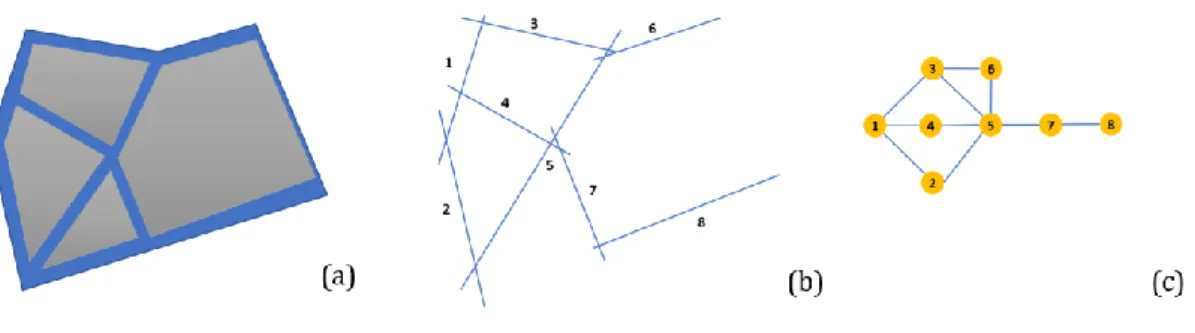
Figure 1: Derivation of Dual Graph representation in Axial Map Method: (a) Fictive street network, with grey as building blocks and blue as streets (b) Axial map representation (b) Dual connectivity map. An adaptation of street network presentation by Porta et al. (Porta, Crucitti, & Latora, 2006) Figure 2: Derivation of Dual Graph representation through Segments Map Method: (a) Primal Segments Graph (b) Dual Segments Graph
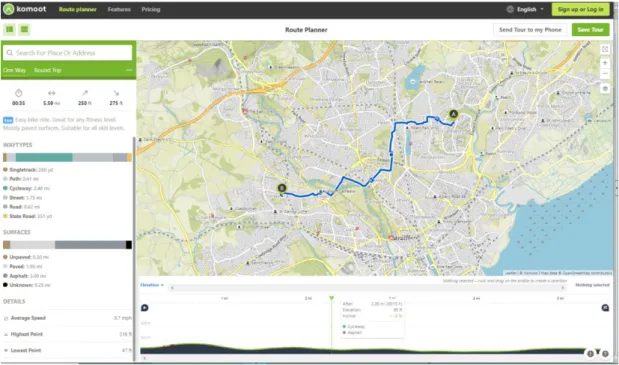
Figure 3: Web interface of route planner Komoot
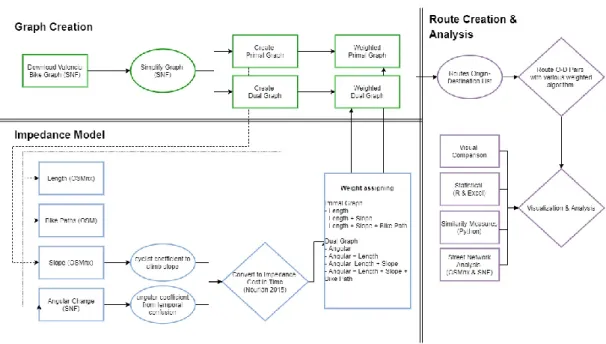
Figure 4: Excerpt of the 100 polar histograms of world cities orientation (Boeing 2017) Figure 5: Methodology workflow diagram of human centric routing algorithm
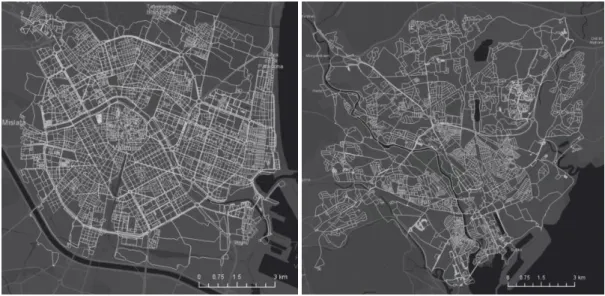
Figure 6: Primal edge of two cities. Left: 4km graph of Valencia, Right: 5km graph of Cardiff Figure 7: Gdf header from Jupyter Notebook, displaying the primal edges of Valencia Figure 8: Graphs and statistics of Valencia and Cardiff
Figure 9: Illustrates how weights are being mapped from a primal graph to a dual graph. (a) is a directed primal graph with a route going from node c to h in one direction. For instance the label ‘1/2’: the number in the front indicates the edgeID, while the number at the back indicates the weight on the edge. E.g. edgeID 1 has a weight of 2, while edgeID 9 has a weight of 3. (b)On a dual graph the directed connection between edge1&4 gets the weight of edge4 instead of edge1, since it marks the decision point of going towards the next edge.
Figure 10. Maps of nodes with elevation. Top: Valencia, bottom: Cardiff. Gradual increment of elevation from blue to red to yellow
Figure 11. Maps of bike paths in OSM data Figure 12: Weighted gdf from Jupyter Notebook
Figure 13: A plot of the model of cycling speed from Nourian (Nourian, Van Der Hoeven, et al., 2015), a function of slope at the constant power of 112 Watts. Note that the slope is display as degrees, where in our original data slope is in %.
Figure 14: Adapted from Nourian (Nourian, Van Der Hoeven, et al., 2015), (a) shows the angles computed based on the incoming direction of the cyclist. (b) shows a plot of the cognitive impedance as a dimensionless number despite the positive or negative angle
Figure 15: Locations of the three pairs of origin and destinations in Valencia (left) and Cardiff (right)
Figure 16: Path routed with Dijkstra Algorithm, greenline indicates the routed path
Figure 17: Map of Valencia OD 3, optimal route. Blue is the dual route, while red is the dual route mapped on a primal graph
Figure 18: Routes visualization on Jupyter Notebook with matplotlib, example of Valencia OD1 Figure 19: Routes result of Valencia OD1. Top is a map of the major routes, bottom is a table of parameter results, X-axis are the parameters of each route and y-axis are the name of the routes Figure 20: Routes result of Valencia OD2
Figure 21: Route results of Valencia OD3 Figure 22: Route results of Cardiff OD1 Figure 23: Route results of Cardiff OD2 Figure 24: Route results of Cardiff OD3
Figure 25: Correlation pairs between parameters. It shows scatter plot and distribution of the metrics. Numbers are correlation: black is correlation of 2 metrics for all data points, data points in blue are that from Valencia, reds are from Cardiff. There is a total of 48 routes, 24 routes per city
x | P a g e
Tables
Table 1: Modified Code snippet for creating Dual Graph
Table 2: Naming of routes generated based on different weights and the graph routed
Table 3: Summary of routes with highest angular confusion parameter, at each origin destination Table 4: Results of similarity measures by Frechet distance in meters, first two columns are the most similar and different routes for each origin destination, the last two columns are the most similar and different routes in comparison to the optimal route
Table 5: Results of Street network analysis of both cities in comparison with results in United States from (Boeing, 2018a)
1 | P a g e
Chapter 1
Introduction
Background
Cycling is an emerging means of active transport which is widely supported by sustainable transport in many cities all over the world. It is deemed to be a silver-bullet to urban problems, in order to reduce carbon emissions, traffic congestion and has been increasingly associated to multitude health, society, and economical benefits (Nordström & Manum, 2015).
This modal shift has been widely promoted in many cities in United Kingdom (UK) and some European Union Member states, where governments rolled out policies and provide budgets to improve cycling infrastructure and education program, there had seen a 200% increase of commuters opting for cycling as their usual commuting choice (e.g. in United States 62% increase in 4 years) (Liu et al., 2016).
Urban dwellers are opting for cycling to navigate through spaces to perform daily activities, from home to daily destinations, as well as unfamiliar places. Wayfinding in unfamiliar places could be a challenge to some, and wayfinding strategy could vary from person (Hrncir et al., 2014). Some would consider a more direct path and safety to be the best, while some might take distance and speed into consideration. Finding an optimal path which considers the wide variety of factors is not an easy task, therefore cyclists turn to route planners for support.
Cyclist route planner, in other words Routing Algorithm is a challenging Artificial Intelligence (AI) problem (Hrncir et al., 2014), due to its multiple routing scenarios and data representation required to model road network features as well as cyclists needs and preference. Routing Algorithm is widely utilized in many urban mobility studies. To verify cyclist route choices derived from GPS tracks and questionnaires, scholars generate routes based on origins and destinations for comparison with real life data, predict mobility flow and incorporating them into geosimulation or agent-based modelling (Filomena, Manley, & Verstegen, 2019; Manum et al., 2017; Raford, Chiaradia, & Gil, 2001). In another case, customized routing algorithm can be used along with Space Syntax on accessibility measures such as closeness centrality and betweenness centrality (Nourian, Van Der Hoeven, et al., 2015).
2 | P a g e
Motivation
It is clear that the built environment influences wayfinding strategy of pedestrians and cyclists, however there has been dividing views on how it influences their paths. Traditional transport planning and cyclist routing applications focused on shortest distance, slope, while some novel ones take into account the comfort level of the path or the amount of cycling infrastructure it provides (Hrncir et al., 2017). Another school in urban planning – the Space Syntax community highlighted the importance of cognitive wayfinding strategy: angular change, argued that it is the crucial element that explains the actual human wayfinding patterns (Shatu, Yigitcanlar, & Bunker, 2019), (Manum, Nordström, & Gil, 2018).
Despite the wide research on Bikeability with Space Syntax measures which are in turn based on street network analysis (SNA), the existing routing algorithm implemented with both physical and cognitive parameters are very limited. Even so, the available routing algorithm with Space Syntax measures are using outdating techniques: for example, axial mapping (Lee & Ryu, 2007), which is implemented mainly for pedestrians, does not take into account the importance of directionality in the algorithm (Nourian, Van Der Hoeven, et al., 2015) .
There exist difficulties in integrating street network physical variables with cognitive variables since the notion of graph theory is interpreted differently. In a geometrical street network, which is the traditional standard of transportation studies, street network is presented in a Junction-to-Junction graph where streets are links and junctions as nodes (Porta 2006). Whereas in Space Syntax which describes street network cognitively, the notion of navigation is on streets instead of junctions, using a Street-to-Street representation. The advantage of the cognitive spatial network representation is that it is the closer to the way people perceive their location in cities, also allowing modelling cognitive factors such as angular change easily (Raford, Chiaradia, & Gil, 2007).
The increasing availability of street network data had made the comparison of large scale city street layout possible (Boeing, 2019). The importance to study a diverse pattern of street network is also stated by Shatu et al., who suggested American and Australian cities are mainly of a grid pattern, which could show less interesting and varied results (Shatu, Yigitcanlar, & Bunker, 2019). The study of street network was once deemed complex due to the large amount of data and lengthy data cleansing process (Boeing, 2016). Thanks to the emergence of reproducible tools to work with street network data,
3 | P a g e
it has been a lot easier extracting and comparing street network data of a large scale, as seen in recent urban studies with large sample sizes spanning across countries and continents (Abad & van der Meer, 2018; Boeing, 2018a). Apart from the benefits of reproducibility, the larger sample size avoids generalization and provides more robust interpretability of urban structures; The study of Boeing compared city orientation through street network and discovered polarising difference between European cities – which is barely a grid, a result of organic growth laid down way before urban planning existed; VS American cities which observed a grid structure, a result of modern large-scale master plans(Boeing, 2018b). Apart from visual classification, he developed a set of metrics for quantifying these differences of street networks such as connectivity, centrality, complexity etc., and suggested how these street patterns contribute to the movement of people.
Research Questions
Inspired by a new comprehensive geodesic method for active transport develop by Nourain et al. (Nourian, Rezvani, et al., 2015), the authors modelled street network in a dual directed representation which takes into account both physical impedance of length, slope and cognitive angular change in each street segment. This algorithm is embedded in a plugin developed on CAD Grasshopper environment, which could be hardly replicated and further integrated into available Urban Analytics libraries. This thesis aims at creating a human centric routing algorithm which models physical properties and cognitive parameters, with open source tools guiding by reproducibility approach, which could be applied to many cities. This brings about research questions as follows:
What are the major cyclist route choices both physically and cognitively? How to model physical and cognitive cyclist route choices in routing algorithm? How does the routing algorithm perform when applying on different cities with different spatial configuration?
4 | P a g e
The overall objectives are:
1. To identify relevant cyclist route choices through literature review,
2. To create a routing algorithm with graph theory which applies both physical and cognitive cyclist route choices,
3. To apply the routing algorithm on different European cities,
4. To compare the routes generated by routing algorithm with visual and statistical methods, and
5. To discuss if some city configuration favours or inhibits cyclist behaviour.
Section Summary
This thesis is organized in the following sequence:
Chapter 2 presents relevant literature related to routing algorithm and Space Syntax
concept linked to wayfinding approach. It introduces the foundations of graph theory, Space Syntax, and describes its deeper connection to cyclist route choices and common parameters exist in routing algorithm.
Chapter 3 illustrates the methodology on creating a human centric routing algorithm
through extending various Python libraries based on graph theory and Space Syntax, with full documentation on Jupyter Notebook.
Chapter 4 displays the results of the routing algorithm and evaluates by comparing
bikeability metrics. It further illustrates the routes evaluation process by visual identification of spatial configuration and statistical approach, then further quantified SNA.
Chapter 6 discusses routes evaluation, the implications of spatial configuration on
cyclist wayfinding and connects the findings to the bigger picture of future urban planning practices.
Chapter 7 summarises the work of the thesis and suggests the limitations and future
5 | P a g e
Chapter 2
Literature Review
The creation of a Routing Algorithm that models both human cognition and physical aspects, it is a multi-disciplinary approach that combines theories of Mathematics, Computation, and also aspects of Environmental Psychology – Spatial Cognition and urban design in terms of the way the build environment influences wayfinding behaviour. This section of literature review illustrates and connects the underlying concepts of these schools of disciplines, and helps frame this thesis into context.
Modelling a Human Centric Routing Algorithm, one needs to have an understanding of the underlying theory of Street Network Modelling, including Graph Theory and Street Network Representation, which is underlined in section 2.1. Section 2.2 focuses on the bigger picture of Wayfinding behaviour in respective to Spatial Cognition to brings out the importance of adding Space Syntax techniques – angular change into routing algorithm, and further review important cyclist route choices revealed by Bikeability research. Section 2.3 reviews existing literature on cyclist routing algorithm and their methodology. Lastly section 2.4 states the recent advancements of Reproducibility in urban analytics hence its importance in this thesis.
Concepts on Street Network Modelling
2.1.1. Graph Theory
The network approach has been widely used to model social, biological, and man-made systems (Porta, Crucitti, & Latora, 2006; Sergio Porta et al., 2006). In particular, urban studies use transportation networks to model the complex relationships exhibit in the city, such as traffic flows and urban growth patterns (Porta, Crucitti, & Latora, 2006). The study of networks is built upon the foundation of graph theory, a branch of mathematics. Below are introducing some basic concept of graph theory which are used throughout this thesis.
6 | P a g e Graph, Nodes and Edges: Graph (G) is an abstract representation of a system
consisting of elements and connections. Elements are called nodes and drawn as a point, while the connections between them represented by lines, are called edges. Nodes and Edges are the basic units which constructs a graph. Edges could be undirected or directed.
Undirected and Directed graph: In undirected graph, edges could be
transverse in both directions, while in a directed graph, or digraph has directed edges. U→ v represents the direction of edge, while u is the origin (from) node and v is the destination (to) node. Graphs can also have multiple edges between the same nodes. Such graphs are called multigraphs, or multidigraphs if they are directed.
Weighted graph: A weighted graph’s edges is assigned with an attribute to
quantify some value, such as importance or impedance between connected nodes. A common weight is distance, and a path could be routed through an order of directed sequence of edges that connects to an ordered sequence of nodes.
Street network: a street network could be categorized as a complex spatial
network, which is a complex network which has neither a fully regular nor fully random configuration, with nodes and edges embedded in space.
2.1.2. Representation of Street Network
Street networks have been traditionally represented as a primal graph, since this node-to-node representation is the simplest way to capture distance, one of the most crucial geographic components. It was first introduced in the early sixties, and is still widely used in many transportation studies (Porta, Crucitti, & Latora, 2006). As long as places and junctions are points and relations are edges, distance can easily be associated with edges as a weight.
While in contrast, the dual graph inverts this representation, displaying city streets as nodes and intersections as edges. This method was introduced by a group urban designers and planners who studied Space Syntax, a method to model how humans interact with the built environment (Manum et al., 2017). Through representing intersections as edges, this Street-to-Street representation makes dual graph unique in a way that it stores relationships between two streets possible, such as angular change. Figure 1 illustrates the process of deriving dual graph from a fictional street network. Dual graph stems from an axial map (figure 1b), where each straight space (line of sight) is represented by one single straight line, an axial line. A dual connectivity
7 | P a g e
graph is then derived, each axial line is turned into a node, while each pair of connected axial nodes are linked with an edge. As seen in Figure 1b&c, street centreline 1 is connected to street 2,3,4, as presented in Figure 1c, represented in a non-metric way. The dual connectivity graph uses nodes to represent an axial line that is regardless of its metric length, and the measurements of accessibility could be calculated on the basis of a non-geographic distance called step-distance, giving the potential to help forecast movement activity in the city.
Figure 1: Derivation of Dual Graph representation in Axial Map Method: (a) Fictive street network, with
grey as building blocks and blue as streets (b) Axial map representation (b) Dual connectivity map. An adaptation of street network presentation by Porta et al. (Porta, Crucitti, & Latora, 2006)
Dual connectivity graph brought about from Space Syntax Study is constructed with axial lines (Dalton 2001) however, there raised a new syntactic representation of street network which integrates both topological and geometric configurations of space – Segments map. This is particularly useful in cities with uniform structure, in particular American cities such as Broadway in Manhattan, which displays a grid like structure with very less disruption and smooth linear streets that cross regular streets diagonally (K. Al Sayed et al., 2018). Furthermore some criticized on the difficult integration of axial lines into GIS, that even there has been continuous effort to automate the axial lines generation process, there still requires manual interference to decide if certain feature is important in the map (Turner, 2007; Jiang, Claramunt, & Klarqvist, 2002).
Instead of a continuous straight axial line, segments map breaks each axial line down into its individual street segment. For example in edge 1 as displayed in Figure 1b, it is represented in a segments map in Figure 2a as 2 edges: (1,2), and edge 5 is split into 2 edges: (6,7) Segments have geometric properties marking the angular change between each pair of intersecting streets, which is a useful method to analyse angular depth that can find the least angular path through the network. Then through representing the centroid of streets into nodes and the connection as edge, a dual segments graph is formed, as seen in Figure 2b.
8 | P a g e Figure 2: Derivation of Dual Graph representation through Segments Map Method: (a) Primal Segments
Graph (b) Dual Segments Graph
In this study, both the primal segments graph (as primal graph) and dual segments graph are opted for the routing algorithm. Primal graph takes into account geographic elements such as distance and elevation, and the original representation of street dataset available; while dual graph allows to model angular change, which is crucial element to analyse human activity in building environment.
9 | P a g e
Cyclist Route Choices: through Spatial Cognition and Bikeability
The urban built environment to some extent can facilitate or limit one’s wayfinding behaviour depending on the structure and characteristics of the physical element of the city. Lynch developed the idea of an Imageable City (Vaez, Burke, & Alizadeh, 2016). A strong imageable city is an environment that has an apparent clarity or legibility, which could facilitate human wayfinding due to its ease to be organized into a coherent pattern. Imageability is crucial for spatial cognition, since suggested by Montello, people acquire spatial knowledge from their environment and construct cognitive maps to aid their wayfinding task (Montello, 2010).
The cognitive behaviour of wayfinding by cyclist and pedestrians in unfamiliar environments are very similar, which is largely influenced by the spatial configuration of the network layout (Emo et al., 2012). People tend to choose well-connected paths and legible layouts which is easy to understand, in order to create a cognitive map which aids navigation. Spatially, one might say that an orthogonal grid with street segments of equal lengths to be an ideal urban configuration, since the line of sight is continuous and navigation space is constant. While an irregular grid has a lack of geometric order which blocks lines of sight and access, and therefore less intelligible (Hillier et al., 1993). Space Syntax theory and methodology provides theory and quantitative tools to describe and measure spatial configuration of urban space. This method is used by urban planners to model how human interact with the built environment (Manum et al., 2017). There are numerous Space Syntax Measures - which is also called Street Network Analysis (SNA) (Depthmap, 2005) such as Integration, Connectivity, Angular Segment Analysis and Betweenness Centrality etc., in particular many of these measurements use angular shortest path as a major input to calculate human movement flows. Instead of topological shortest distance path, angular shortest path was found to be highly associated with wayfinding behaviour (Manum et al., 2017; Turner, 2009; Raford, Chiaradia, & Gil, 2007). This is related to how people perceive distance, Turner suggested that one requires higher cognitive load for memory when memorizing turns, therefore people are more likely to minimise cognitive distance as they walk through a foreign environment (Hillier & Iida, 2005).
Apart from a legible spatial configuration aids spatial cognition, a simpler route could also enhance cyclist wayfinding performance.
Finding routes that properly consider all the above criteria is not an easy task, therefore cyclists can turn to navigation aids for route suggestion. Unlike driving navigation aids,
10 | P a g e
there are a limited number of options for cyclists wayfinding. De Waard et al., (2017) explored the influence on spatial cognition by cyclist navigation aid, and suggested that the use of visual map to provide cyclist navigation support is useful to build spatial knowledge. Cyclist support with visual map based on spatial memory could lead to errors and require the highest spatial cognition ability. While turn-to-turn navigation cyclist support by smartphones is more mentally demanding comparing to drivers support, which could be similar to texting and reading while driving, leading to safety concerns. In the light of spatial cognition in building a cognitive map to aid cyclist navigation, the motivation of providing the simplest and easiest path as optimal is crucial for cyclist to acquire route and survey knowledge and therefore reduce error when performing navigation tasks.
While there is another school of transport modelling where studies try to understand wayfinding behaviour, in another words route choices models or bikeability. Most of these studies are carried out in search of local insights in cyclist volume and identify locations where operational improvements would benefit the greatest number of cyclists. Studies suggested that individual traces are difficult to predict subject to a wide range of variables (Raford, Chiaradia, & Gil, 2001), however it is not always random and there is an emerging order of factors which influence cyclists route choices. There has been researches on cyclist behaviour had introduced more influencing environmental factors on cyclist route choices, such as presence of slope, bike lanes, pleasantness, weather factors, cyclist safety and air pollution, etc (Law, Sakr, & Martinez, 2014) (Hrncir et al., 2014) (Hood, Sall, & Charlton, 2011). A study in San Fracisco California revealed that steep slopes, length and turns were disfavoured, and the presence of bike lanes are preferred (Hood, Sall, & Charlton, 2011). The significance of cycling infrastructure is also highlighted by a research in Copenhagen, where cyclists prefer to cycle on shorter distances and segregated bikeways (Skov-Petersen et al., 2018). Many cases the product in these studies is a map with bikeability index displaying the suitability of street network for cycling. These insights are useful input for urban mobility and routing computational studies in providing factors on how cyclist find their way.
11 | P a g e
Routing Algorithm
2.3.1. Current cyclist routing applications & their algorithms
In the current landscape of cyclist routing problem, a majority of publicly available and popular routing applications mainly incorporates physical factors. Google maps supports bicycle trip planning in some areas, it does not allow setting up any cycling preferences and mainly provide route parameters of distance time and elevation. Komoot, a specialized outdoor experience route planning tool incorporates urban biking emphasizes on the route type, surface and elevation, provides an interactive display for various parameters (Komoot, 2020). Hrncir et al. developed a Multi-criteria Bicycle Routing Algorithm which allows user defined choice preferences and incorporated comfort level through the effect of route surfaces and traffic level (Hrncir et al., 2014). However, these routing algorithms are created solely focusing on physical parameters, and as suggested by many cyclist route choice studies, they have not accounted for angular change as a crucial component in human wayfinding.
Figure 3: Web interface of route planner Komoot
The cognitive aspects involved in wayfinding through street networks can be modelled with Space Syntax methods, as mentioned in previous chapter, by means of dual graph representation. Due to the limited number of studies focusing only on cognitive cyclist routing algorithm, cognitive pedestrians routing algorithm are also reviewed. Lee & Ryu developed a shortest path algorithm incorporating cognitive element through Axial Map (Lee & Ryu, 2007). The algorithm incorporated mean depth of nodes in terms of visited turns, discovered that axial mapping cannot incorporate direction which could be not
12 | P a g e
suitable for vehicle routing. Duckhman highlighted the importance of having least number of turn as a parameter and created a simplest path routing algorithm for pedestrians which however, it does not take into account geographic distance and created routes that are 50% longer than the corresponding shortest path (Duckham & Kulik, 2003). In a study of cyclist behaviour in London , axial map and segments map are used to find the fastest cognitive route, and compared the computer routes with cyclist traces, the authors discovered that cyclists tend to follow routes with least angular change (Raford, Chiaradia, & Gil, 2007). In 2015 Nourain extended the study of Duckhman, and designed a novel comprehensive geodesic algorithm to find ‘easiest path’ for walking and cycling, i.e. a path that is short, flat and cognitively simple. The algorithm used a using a directed dual graph to take into account both physical impedance of length, slope, direction and angular change of each street segment (Nourian, Rezvani, et al., 2015).
Many of these approaches are mainly designed for pedestrians since it is relatively easier to model the street network as un-directed graph. This implies that the graph created could be traversed from u→v and vice versa. Although for cyclist there is also less limitation regarding direction, safety constitutes a crucial factor to take into account. Furthermore, in order to model the behaviour of slopes, direction is crucial. Therefore, one can argue that the existing studies are not reproducible and have to be readjusted to cater for cyclist needs.
2.3.2. How studies integrate weights
To turn route choice of different units (degree, number of bike path, length (m) and slope (%)) into meaningful weights, merely just adding up the numbers are not enough. There have been various methods to combine routing weights.
Impedance is used in many urban analytics studies as a measurement to combine parameters of different units. Impedance is a transport analysis term derived from physics, indicating the resistance to movement (Manum & Nordstrom, 2013).
In the multi criteria cyclist routing algorithm deployed in Prague by Hrncir et al., in order to capture the unique topology of the city, the algorithm allows users to choose the weights on travel time (s), comfort (coefficient) and flatness (coefficient) (Hrncir et al., 2014). These three criteria have their own units, and are not combined as a single weight, but the algorithm finds a route with edges that gives the lowest value in every criterion. Travel time is defined by two functions which returns a value in time (seconds). One is a
13 | P a g e
slowdown function, which returns the slowdown in seconds given by crossings, while change in elevation is defined by a speed acceleration which penalize uphill rides. The comfort criteria capture a preference towards comfortable roads with good quality surfaces and low traffic, derived from type of road and number of junctions, which returns a coefficient. The importance of elevation is modelled again as the last criteria by giving a coefficient on the flatness of the edge. One challenge reflected in this study is that to gather various criteria data from a single source in geographic format is difficult, furthermore features are stored separately in edge and nodes. For example to model comfort, OSM tags mapping is utilized for surface type which is stored in edges, and combine it with obstacles which are features that slow down cyclist, that are stored as nodes (Hrncir et al., 2017).
To model the easiest paths by Nourian et al., the study combined physical and cognitive impedance and used a weighted sum model to model the total impedance of each edge (Nourian, Rezvani, et al., 2015). This method is used since it is simple and the only way that was found to combine angular change with other impedance.
Reproducibility of Urban Studies
Reproducibility is stressed as a fundamental principle in science by many GIScientists. Computers and computational analysis become an indispensable part of research, and they argued that the results and workflow should be reproduced, challenged and tested by other researchers (Nüst et al., 2018).
In many urban street network studies, they often adopt of industry specific platforms and software such as transportation modelling tools and proprietary software such as CAD and ArcGIS. While such tools can provide a graphical interface for experts from various backgrounds, yet a major limitation is the lack of consistent, open-source and easy-to-use research tools, making other researchers in replicating and further develop on the study a difficult task (Boeing 2015). For instance, street network dataset is a core component of many of these urban studies, however there is yet to be a standard workflow or tool that offers a ‘consistent, scalable, configurable method’ to collect street network data for anywhere in the world and assemble it into graph theoretic objects. Nourian developed a ‘easiest path algorithm’ as a plugin tool in C# and VB.NET for Rhinoceros CAD software application (Nourian, Rezvani, et al., 2015). While Manum utilizes ArcGIS Network Analysis tool and SDNA+ for network creation and bicycle flow
14 | P a g e
estimation (Manum et al., 2019). Comparing to a script which could provide full documentation of the workflow a study, the above studies are often not open source and could not be easily replicated.
Given the limitation in this area of research, Boeing developed OSMnx a Python package for easy acquisition and analysis of street networks everywhere around the world. It allows automated downloading of urban data from OpenStreetMap (OSM), network simplification, convert into a multidigraph, perform route searches, visualization and saving them into interoperable formats (Boeing, 2017). The library utilizes NetworkX, another Python package for general network analysis. Figure 4 illustrates the ease to extract street network from anywhere in the world.
15 | P a g e
Chapter 3
3.
Methodology
There are many routing algorithms available and developed in various platforms (see section 2.3.1). However, these studies are difficult to replicate at areas outside of the study area due to the wide range of data required and inconsistent data sources and street network formats. The aim of this thesis is to tap into the new source of geospatial data from OSM, which has considered as increasingly reliable due to its completeness and accuracy in European countries.
In addition, the complex architecture and proprietary software used in many urban analytics studies have slowly seen a shift in computational workflow, into an easier-to-use Python environment. The shift to an easier computational environment can also prompt more interest and usage from wide range of users and researchers. This thesis observed such a trend, integrate various available Python based libraries and created a workflow that could be easily replicated and extended, especially with the use of Jupyter Notebooks (Millman & Pérez, 2019).
The first two parts of the methodology provide a detailed description on the steps taken to create the human centric routing algorithm, through graph creation and modelling impedances. Next, based on research on the influence of the built environment on wayfinding, the routing results are generated and contrasted between two cities: Valencia and Cardiff. Lastly the generated routes are evaluated with statistics approach in relation to the quantitative results from the SNA.
16 | P a g e
Diagram & Workflow
The diagram in Figure 5 illustrates the stepwise methodology of the computational workflow. The workflow is separated into three parts: 1: Graph Creation, 2: Impedance Model which are based on Python, and Route Creation & Analysis on Python, ArcGIS Pro, R and Excel.
Figure 5: Methodology workflow diagram of human centric routing algorithm
Firstly, Graph creation is described at section 3.4, a street network is downloaded with OSMnx and resulted with a primal street network. Then at section 3.5 the Primal Graph is then further processed to add various impedances with data from the street network, such as presence of bike paths. The primal graph is converted into a dual graph with reference to Street Network Functions (SNF). Then various weights are calculated based on an impedance model and the two graphs are ready to route, as described at section 3.6.
Next in Route Creation and Analysis of sections 3.7 & 3.8, origins and destinations (OD) are picked, routes are created from respective graphs. Lastly the routes are visualized with matplot lib and ArcGIS Pro, data tables are created with geopandas and exported to excel as csv to create charts. For further interpretation of spatial configuration of the city, SNA is used also in Python.
17 | P a g e
Software & Platform
The computational workflow runs mainly in Python, integrating various libraries and recreating functions to create routing algorithm. The main part of analysis workflow such as similarity measures and SNF are in Python, while the comparison of parameters is with R.
Python, Jupyter Notebook, Anaconda
Python is a scripting language with simple and easy to learn syntax emphasising readability, making it attractive to beginners and professionals alike to write clear and logical code for small- and large-scale projects. The extensive modules and packages supported allows users to program in a modular style such that code could be reused across a variety of projects; in order words, code developed in this language is highly scalable and reproducible (Python Software Foundation).
To program with Python, one requires a computational environment. For this thesis, the Jupyter Notebook environment was chosen due to its interactivity and its ability to display stepwise workflows and easy-to-readiness. Jupyter Notebook is an open-source web application which allows programmers to edit, display, run and visualize code in each cell, add text and comments, making code prototyping and sharing very easy (Seltzer, 2017). Python version 3.7 is used with the following packages.
The Python Libraries used in this thesis is explained below.
Street Network Functions
SNF is the underlying code of the human centric routing algorithm. This Python library was developed by Gabriele Filomena for a study “Computational approach to The Image of City” using street network to extract cognitive map with network analysis measures (Filomena, Verstegen, & Manley, 2019). It utilised packages such as OSMnx and GeoPandas, which integrated the ability to model street networks as graph objects that preserves relationship between networks, and the flexibility of Pandas dataframe. One of the most valuable functions borrowed this thesis is the creation of dual graph and angular measurements. Other functions such as street network downloading, simplification and primal graph creation were also employed in this thesis.
18 | P a g e OSMnx
OSMnx is a Python package for working with OSM street network data, from downloading, graph creation, network simplification, SNA and visualization. OSMnx can download OSM street network data and construct it into NetworkX graphs. This package made it possible to apply the algorithm in any city around the world since it utilizes OSM data as a central repository of street network data, and quickly construct it into a graph – which could have been inconsistent and difficult in the past for researchers.
NetworkX
NetworkX is a free and open-source Python Package which is the core of OSMnx, supports graph-theoretic network analysis, in particular keeping track of connections between networks (Hagberg, Swart, & Schult, 2008). Apart from graph creation, it is also the library that provide a series of routing algorithm to compute paths with weights in a directed graph.
Pandas & GeoPandas
Pandas is a powerful Python library for data analysis, while GeoPandas is a Python module which is built on top of Pandas extending its ability to work on spatial data. It stores data in DataFrame (df) or GeoDataFrame (gdf), a table like object which is flexible to select and work with large amount data (Tenkanen, 2017).
Similarity Measures
Frechet distance is used to support the visual similarity of routes, by providing a minimum distance to connect two generated routes. The Github library similarity measures is used for the algorithm (Jekel et al., 2019).
Routing Functions
Routing Functions (rf) are created to compile code from various libraries as a result of this thesis. Functions include graph download, routes generation, visualization and analysis.
R GGally
GGally, a package built upon GGPlot that combines various plots into matrix for correlation (Schloerke et al., 2017).
19 | P a g e
Case study area
This thesis aims to create a human centric routing algorithm based on reproducibility standards, therefore by applying on different cities can test the usability of the algorithm and also compare its performance base on different spatial configuration and street network properties. Two European cities of similar size are chosen as the case study area: Valencia in Spain and Cardiff in Wales, UK.
With over 700,000 inhabitants, Valencia is one of the major cities of Spain with a size of 150 km2 where active transport is widely support. More than 50% of interior commuting
is made by walking and cycling (Valencia, 2017). In particular cycling takes up 5% of total daily commuting means, had seen a 20% increment in 3 years ((Valencia, 2013)p16) In Valencia’s sustainable Mobility Development Plan, it shows the transparency and open attitude of the city towards data and smart mobility, therefore with its database and the city size, it is a very suitable city as a case study area.
Cardiff is the capital of Wales, also its largest city of 140 km2 is home of 400,000
inhabitants. Due to its ongoing government initiative in supporting cycling, 6% of the daily commuting is made with cycling, which is the highest in Wales (Welsh Government, 2019; Cardiff Council & Freshfield Foundation, 2017).
The two European cities have quite opposite spatial configuration. Valencia built around the historic centre outside the ring road regulated on a grid pattern by Francisco Mora. The grid pattern developed by Francisco Mora an architect in the 18th century is named
the Ensanche Plan, the layout was an orthogonal grid within a grid, marking an urban unit of houses bordered by perpendicular streets (Torreño Calatayud, 2005). While Cardiff exhibits a distinctive pattern, described as a fan-like or similar to a ‘hand and fingers’ layout. The city has a relatively flat bay area at the centre, with development extending outwards towards the hills, some argues that its physical geography poses challenges for future growth (Neil Harris, 2018).
20 | P a g e
Graph Creation
The aim of this thesis is to create a routing algorithm which considers both physical aspect of streets (distance and slope), bike path and angular change. To define the graphs required in a deeper level, a primal directed graph and a dual directed graph are needed to generate the most optimal routes.
The reason of requiring both primal and dual graphs are illustrated in section 2.1.2: primal graph representation is required to faithfully retain all geographic, spatial metric information essential to urban form of street networks. On the other hand, a dual graph representation can be deployed to represent angular relationships between street segments, and it allows to compute further topological measures. Both graphs are required since the dual graph is derived from the primal graph, and when the routes are created across the dual graph, the primal graph is employed to map the routes back from a dual representation to a primal network.
The creation of primal graph uses OSMnx to convert gdfs to graph. A directed graph is created which preserves directionality, that is crucial in the next step when calculating the slope of the streets, and also to prevent routing in the other direction in a one-way street.
Creation of dual graph take reference of SNF and NetworkX. SNF provides the possibility to create a dual graph, however, it was originally created for pedestrian SNA, requirements are simpler since pedestrian has no restrictions and ignores one-way directionality, and connect adjacent nodes with reciprocal directed edges. Therefore, the code was modified to only create links between edge of the same direction, calculate angular change between two streets, and create graph.
3.4.1. Street Network data download
From the SNF module, there are a few methods to download a street network from OSMnx and save them as gdfs. The street networks are primal with street name, type and preserve directionality. Street networks could be downloaded through a shapefile, directly from an OSM Polygon, or on the basis of distance from a given address. The latter approach is used since it gives a uniform area from a bounding box which could be easily visualized. There are various types of networks to be downloaded, to name a few:
drive: get drivable public streets (but not service roads)
walk: get all streets and paths that pedestrians can use (this network type ignores one-way directionality by always connecting adjacent nodes with reciprocal directed edges)
bike: get all streets and paths that cyclists can use
21 | P a g e
Then the graph is given a projection system in EPSG code, in this case we are using WGS 84 which is a standard world coordinate system. Since graph object is difficult to access and manipulate in Python street network graphs are converted into gdfs. Then the network is simplified and cleaned. Below is the edges of the two cities, Valencia and Cardiff.
Figure 6: Primal edge of two cities. Left: 4km graph of Valencia, Right: 5km graph of Cardiff
Here is a header of Valencia edges. It presents streetID, the length, oneway, type of street, origin (u) and destination (v). The column ‘key’ is also added since this column is necessary to run OSMnx functions.
Figure 7: Gdf header from Jupyter Notebook, displaying the primal edges of Valencia
3.4.2. Create Primal Graph
When the graph is downloaded, it is composed of two gdfs: nodes (street junctions) and edges (street segments). This makes modifying parameters of the graph much easier. The graph is then simplified to ensure nodes only exist when intersections between different street segment exist; this is crucial when transforming primal graph into a dual graph.
22 | P a g e
Next, to ensure the graph preserves directionality, edges that can be routed both ways are copied, and the UVs are flipped by using the function rf.copy_DiEdges.
This ensures that when such edges are used to calculate slope in the next section, slopes from u→v and v→u can be assigned to the respective edges. Originally before such a function was created, when slope is calculated for edges that could be routed both ways, since there is only one edge present, only one direction of slope is calculated. However, in reality the slope is different while going upwards and downwards at the same edge.
3.4.3. Create Dual Graph
Dual Graph is derived from Primal Graph based on its parameters and spatial features. It involves two steps – 1: creating dual edges gdf from primal edges gdf, and then combining it into a dual graph, and 2: mapping the weights back to a dual graph.
As mentioned, the SNF library was created for pedestrians, which could be routed in both directions. Therefore, when creating dual edges, the original function disregarded directions and created dual connection edges for all adjacent edges. However, in the case of routing algorithm, directions has to be respected, therefore changes were made to the function.
First, centroids are created for each edge segment. Then instead of mapping all possible interactions with a ‘OR’ clause, possible interactions are found ONLY if the ‘to’ street’s origin node ‘u’ is the same with the destination node ‘v’ of the ‘from’ street.
Table 1: Modified Code snippet for creating dual graph ORIGINAL SNF
possible_intersections = centroids_gdf.loc[(centroids_gdf['u'] == from_node) | (centroids_gdf['u'] == to_node) | (centroids_gdf['v'] == to_node) | (centroids_gdf['v'] == from_node)]
MODIFIED RF
possible_intersections = centroids_gdf.loc[(centroids_gdf['u'] == to_node) & (centroids_gdf['v'] != from_node)]
Then the weights computed for each street are added to the centroids (i.e. original edges) based on the matching edgeID. Afterwards connecting edges (i.e. nodes, or intersections) are created between two centroids.
23 | P a g e 3.4.4. Graph Statistics & Visualization
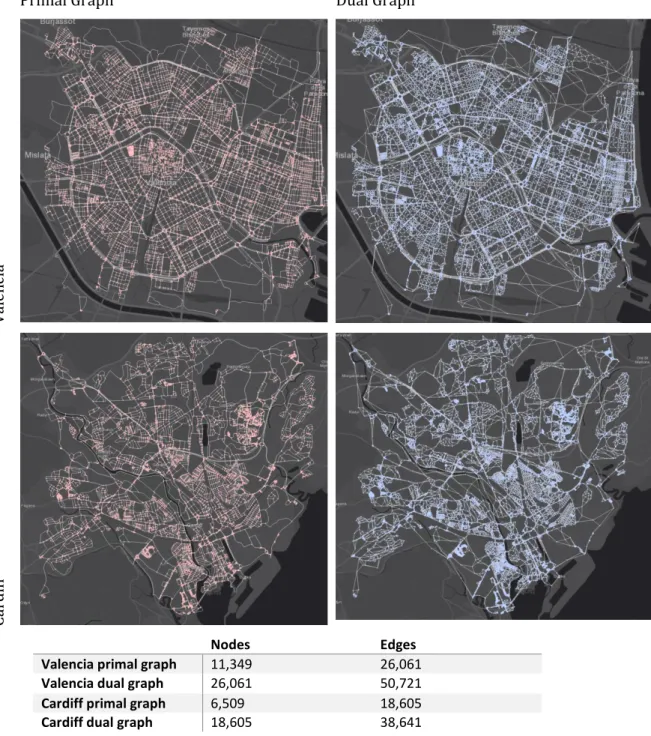
Below is a diagram of some basic statistics of the primal and the dual graph of Valencia and Cardiff respectively. Note that despite the city area is similar, the graph taken for Valencia is from a 4000km buffer, while from Cardiff is a 5000km buffer, yet the size of the cycling Graph in Cardiff is smaller than that of Valencia by almost a half.
Primal Graph Dual Graph
V ale nc ia Ca rdi ff Nodes Edges
Valencia primal graph 11,349 26,061
Valencia dual graph 26,061 50,721
Cardiff primal graph 6,509 18,605
Cardiff dual graph 18,605 38,641
24 | P a g e 3.4.5. Mapping Weights
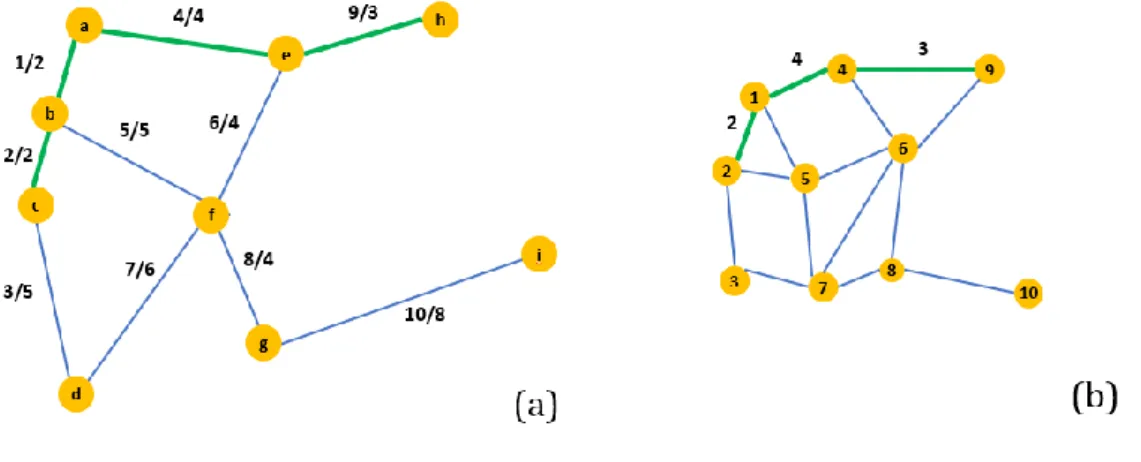
One might ask how to map the weights on a primal graph onto a dual graph, since the notion of edges on a primal graph is the same with real life which edges are streets and the physical properties are stored on the same edge. While on a dual graph the edges indicates the connection between two streets or segments. An important method to note is that in a dual graph, value of the to-primal-street (v) is mapped on the connected edge. An example could be seen in the below figure. The dual edge(1,4) takes the value of edge 4. A function created to automate this process is rf.mapCol_dual.
Figure 9: Illustrates how weights are being mapped from a primal graph to a dual graph. (a) is a directed
primal graph with a route going from node c to h in one direction. For instance the label ‘1/2’: the number in the front indicates the edgeID, while the number at the back indicates the weight on the edge. E.g. edgeID 1 has a weight of 2, while edgeID 9 has a weight of 3. (b)On a dual graph the directed connection
between edge1&4 gets the weight of edge4 instead of edge1, since it marks the decision point of going towards the next edge.
25 | P a g e
Impedance Modelling
This part entails the modelling of impedance that is extracting the parameters from OSM and calculating impedance in the light of Nourian’s research (Nourian, Rezvani, et al., 2015).
3.5.1. Parameters Calculation
From the literature review of cyclist route choices at section 2.2, distance, slope, angular change and bike path are considered in this thesis as an parameters for the routing algorithm. For distance and slope, primal graph is employed, whereas angular change is calculated with dual graph.
Distance
Edge length is calculated with osmnx.add_edge_lengths to add length between nodes u and v in meters.
Slope (from Elevation)
Next to find the slope for each edge, functions from OSMnx are used.
Firstly, a primal graph is passed to osmnx.add_node_elevations, to find the elevation on each node and added it to the node as an attribute. It takes a google maps elevation API, and therefore an API key is created for this function. Next, osmnx.add_edge_grades is used to add the grade of each edge. It calculates the difference in elevation from origin(u) to destination(v), then divides by the edge length. This function creates two attributes, grade and grade_abs, where grade contains negative values (as in going downhill) and positive (uphill), while grade_abs contains the absolute value of grade.
As a part of the exploratory results, the average and median street grade is as follows. Average street grade in Valencia is 1.2%, Median street grade in Valencia is 0.8%. While That of Cardiff is 2.1% and 1.2% respectively.
26 | P a g e Figure 10. Maps of nodes with elevation. Top: Valencia, bottom: Cardiff. Gradual increment of elevation
27 | P a g e Bike path
Street classification tags such as primary, secondary, pedestrian and bike path etc., is provided in the OSMnx dataset, therefore there was not a need for extra data merging. A column ‘hasBikeP’ is added to define if the edge allows the passage of cyclists.
Below shows a map of paths that are identified as bike path. Bike paths from Valencia are compared with GIS data from Valencia Open Data Portal (Valencia’s Transparency and Open Data Portal, 2020), which displays a high accuracy of data. Whereas the only data source of bike path in Cardiff is in pdf format (Cardiff Council, 2018), despite it displayed a slightly more connected bike path map, it remains fairly scarce as shown at Figure 11.
Figure 11. Maps of bike paths in OSM data. Left: Valencia, right: Cardiff
Angular Change
In order to calculate the angular change of a route, a dual graph is required. (see section 3.4.3). The angle between two streets are calculated and stored at the connected edge of dual graph with a modified formula taken from SNF. The deflection angle is a positive degree from 0 to 180. It is also converted to radians for further processing.
The parameters are added to the graph, and weights are assigned through a uniform unit of time.
28 | P a g e Figure 12: Weighted gdf from Jupyter Notebook
Impedance Calculation
To turn these parameters of different units (degree, number of bike path, length (m) and slope (%)) into meaningful weights, merely just adding up the numbers is not enough. There has been various methods to combine routing weights.
Impedance is used in many urban analytics studies as a measurement to combine parameters of different units. Impedance is a transport analysis term derieved from physics, indicating the resistance to movement (Manum & Nordstrom, 2013).
In this thesis, the method of a weighted sum model proposed by Nourain is taken as a reference to model both physical slope impedance and cognitive angular confusion (Nourian, Van Der Hoeven, et al., 2015). The weighted sum model takes all impedances: length, slope, bike path and angular confusion, and model them in terms of time (seconds) – which is a commensurate unit, and therefore is possible to model the total impedance of various weight combination.
3.6.1. Physical Difficultly: Slope and Length Impedance
Physical strength is required heavily when a person is cycling. Depending on the steepness and the length of a street this effects the speed of cyclying, and becomes a ccontributing factor on the willingness of whether or not to take certain routes. The speed could be calculated by taking into account the effect of slope per each road segment, and the physical power a person could sustain. In a case where 2 edges have the same distance, the algorithm penalizes higher slope angle and favours the edge with a smaller slope, which in turns requires less time to be traversed.
29 | P a g e Figure 13: A plot of the model of cycling speed from Nourian (Nourian, Van Der Hoeven, et al., 2015), a
function of slope at the constant power of 112 Watts. Note that the slope is display as degrees, where in our original data slope is in %.
The aim is to obtain a model of temporal cost of traversing an edge in terms of its slope angle. The temporal cost is considered as cycling impedance and is denoted as 𝑆𝐼𝑘, of the 𝑘𝑡ℎ edge, which is illustrated in equation 1. Since time equals to distance divided by speed, therefore 𝑑𝑘 is the distance of edge 𝑘, while 𝑠 is the speed. While speed could be further break down as power 𝑃 divided by 𝑚 mass of an average person assumed to be 85𝑘𝑔 and 𝑔 for gravitational acceleration equals to 9.81𝑚/𝑠2 , 𝑎
𝑘 as in the slope angle of the 𝑘𝑡ℎ edge, and 𝐹
𝑓 denoting a nominal force of friction that is to be counteracted by the bicyclist which is 25.
𝑆𝐼𝑘 = 𝑑𝑘 𝑠 = 𝑑𝑘(𝑚𝑔 × 𝑎𝑘+ 𝐹𝑓) 𝑃 = 𝑑𝑘(85 × 9.81 × 𝑎𝑘+ 25) 112 - Equation 1 𝑎𝑘 = 𝑔𝑟𝑎𝑑𝑒 × 100 × 0.57 × 𝑟𝑎𝑑 = 𝑔𝑟𝑎𝑑𝑒 × 100 × 0.57 × 𝜋 180° - Equation 2
The slope angle of the 𝑘𝑡ℎ edge 𝑎
𝑘 is caculated from grade, illustrated in equation 2. The grade calculated from OSMnx is in %, it is then converted into a decimal angle, where each grade is equals to 0.57° (Engineering ToolBox, 2009). Then the angle is converted into radians by multiplying it to 𝜋
180° .
The cost 𝑆𝐼𝑘 is computed in terms of seconds it takes to traverse an edge. This algorithm calculates the temporal cost to traverse a uphill slope, which is defined as grade > 0. However in case of a downhill slope where the grade < 0, this algorithm does not take into account the higher speed of cyclist, and assumes the speed is the same as cyclist cycling on a flat street where grade equals to 0.
30 | P a g e 3.6.2. Cognitive Difficulty: Angular Impedance
Based on the underlying theory of wayfinding, a route which has the least angular change is easier to remember and to traverse without falling into errors. Moreover people tend to remember straighter paths since they form the main roads in a cognitive map (Shatu, Yigitcanlar, & Bunker, 2019).
This equation disregarded the original part applied by Nourian (Nourian, Van Der Hoeven, et al., 2015), that the angular confusion is calculated only if the streets of degree is and larger than 2, which is not the angular degree but the number of neighbouring streets the edge leads to. Street degree is valid in the original equation since it splits a street centerline into equal segments. However in the case of this thesis, such segments is already simplified in eliminated, therefore edges are only segmented when there are junctions in real situation, meaning that all the decision points (nodes) are real life decision junctions.
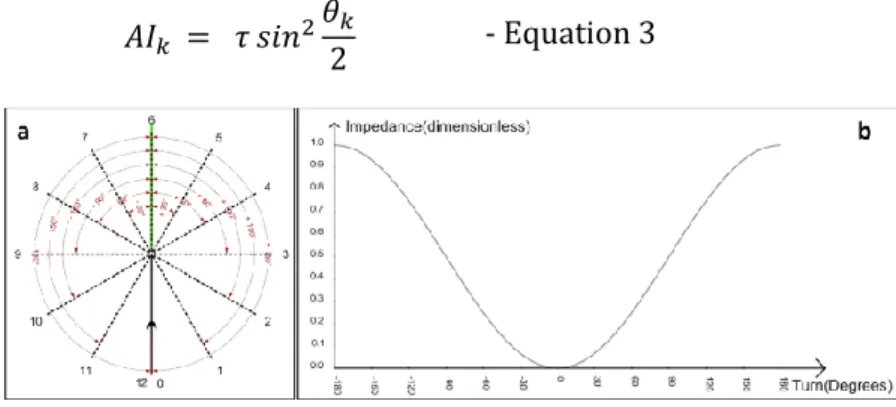
The calculation of Angular impedance could be referred to equation 3. Angular impedance is denoted as 𝐴𝐼𝑘 , which is composed of the angular change to traverse from one edge to another, multiply by 𝜏, an arbitary ‘angular confusion’ coefficient of time. Angular confusion is introduced in Nourian (2015), which indicates the time in seconds a person and in this case cyclist would take to decide which is the next street to take. The maxmium 𝜏, time taken to decide the next link is 10 seconds in the case of maximum change of direction. While square sine of theta 𝑠𝑖𝑛2 𝜃𝑘
2 is a sigmoid function that could accept arguments in radians and can work consistently as a relative impedence function. The angle is converted from degree to radians as a dimensionless number, since as seen in Figure 14, the changing direction in negative or positive degree does not make any difference in angular confusion in seconds.
𝐴𝐼𝑘 = 𝜏 𝑠𝑖𝑛2𝜃𝑘
2 - Equation 3
Figure 14: Adapted from Nourian (Nourian, Van Der Hoeven, et al., 2015), (a) shows the angles computed
based on the incoming direction of the cyclist. (b) shows a plot of the cognitive impedance as a dimensionless number despite the positive or negative angle
31 | P a g e 3.6.3. Comfort: Bike Path
The prescence of cyclist infracstructure can enhance the performance of a cyclist, and hence sustain a higher speed. By comparing two paths of the same distance, cyclist could sustain a higher speed at a bike path than on an average street either pedestrian or car roads. There are many benefits to choose bike paths than a sidewalk or main road. First, it could be paved with a surface that is well maintained, and it avoids separates cyclist and traffic which induce safeness (Manum et al., 2017).
This criteria is an addition to Nourian’s routing algorithm. The prescence of bike path is added as an impedance to reduce time required to traverse the edge.
𝐵𝐼𝑘 = 𝑑𝑘 𝛽 = 𝑑𝑘
100× 4 - Equation 4
In equation 4, 𝐵𝐼𝑘 is the comfort impedance as a temporal cost in seconds. It is hypothesized that on an edge without bike path, the time will increase by 4 seconds every 100m. The distance of the edge k is 𝑑𝑘 . The coeficient of slowing down due to the absecen of bike path is 𝛽, which could be defined as 0.04.
3.6.4. Weighted sum model
At this stage all individual weights are calculated with a commensurate unit of time, they are inputed into a weighted sum model to model the total impedance of each edge. Equation 5 shows the calculation of weightA4, which is hypothesized to give the most optimal route.
𝑤𝑒𝑖𝑔ℎ𝑡𝐴4𝑘 = 𝑆𝐼𝑘 + 𝐴𝐼𝑘 + 𝐵𝐼𝑘 - Equation 5
Table 2 summarises the weights indicating the combination of impedance for each weight. The weights for distance, slope and bike path are calculated originally on a primal graph, giving weightP1 to P4. Then the weights are mapped onto a dual graph (illustrated in section 3.4.5). While the weights are summed with the impedance of angular change, giving weightsA1 to A4, with weightA4 according to our hypothesis as the weight which may give the most optimal route, namely the flatest, easiest and the most comfortable path.
32 | P a g e Table 2: Naming of routes generated based on different weights and the graph routed
Primal Graph Impedence Dual Graph Impedance
WeightP1 Distance WeightA1 Angular Change
WeightP2 Distance Slope WeightA2 Angular Change , Distance WeightP3 Distance, Slope, Bike Path WeightA3 Angular Change, Distance & Slope WeightP4 Bike Path WeightA4 Angular Change, Distance, Slope,
Bike Path
Routes Creation & Visualization
This section entails the methodology on picking origins and destinations to be imported into the routing algorithm, routes generation and visualization of the data.
3.7.1. Origin Destination List
In order to have comparable results between the two cities and analyse the performance within the city, 3 origin and destination (OD) pairs are picked around the major districts or landmarks in the city. ODs separated by an average of 5000m (Euclidean distance) are chosen for consistency in distance.
The coordinates of the origin-destination pairs are taken from OSM and stored as points which will be used directly in the routing algorithm.