i
COMPARING THE PERFORMANCE OF OVERSAMPLING
TECHNIQUES IN COMBINATION WITH A CLUSTERING
ALGORITHM FOR IMBALANCED LEARNING
Mariana Matoso Pereira
Dissertation presented as partial requirement for obtaining
the Master’s degree in Statistics and Information
i
MEGI
201
ii
NOVA Information Management School
Instituto Superior de Estatística e Gestão de Informação
Universidade Nova de Lisboa
COMPARING THE PERFORMANCE OF OVERSAMPLING TECHNIQUES
IN COMBINATION WITH A CLUSTERING ALGORITHM FOR
IMBALANCED LEARNING
by
Mariana Matoso Pereira
Dissertation presented as partial requirement for obtaining the Master’s degree in Information Management, with a specialization in Knowledge Management and Business Intelligence
Advisor: Fernando Bação
iii
ABSTRACT
Imbalanced datasets in supervised learning are considered an ongoing challenging task for standard algorithms, seeing as they are designed to handle balanced class distributions and perform poorly when applied to problems of the imbalanced nature. Many methods have been developed to address this specific problem but the more general approach to achieve a balanced class distribution is data level modification, instead of algorithm modifications. Although class imbalances are responsible for significant losses of performance in standard classifiers in many different types of problems, another aspect that is important to consider is the small disjuncts problem. Therefore, it is important to consider and understand solutions that not only take into the account the between-class imbalance (the imbalance occurring between the two classes) but also the within-class imbalance (the imbalance occurring between the sub-clusters of each class) and to oversample the dataset by rectifying these two types of imbalances simultaneously. It has been shown that cluster-based oversampling is a robust solution that takes into consideration these two problems. This work sets out to study the effect and impact combining different existing oversampling methods with a clustering-based approach. Empirical results of extensive experiments show that the combinations of different oversampling techniques with the clustering algorithm k-means – K-Means Oversampling - improves upon classification results resulting solely from the oversampling techniques with no prior clustering step.
KEYWORDS
iv
INDEX
1. Introduction... 1
2. Related Work ... 3
3. Research Methodology ... 6
3.1. Metrics ... 7
3.2. Oversamplers ... 8
3.3. Classifiers ... 8
3.4. Datasets ... 10
3.5. Experimental Framework ... 11
4. Experimental Results ... 12
4.1. Random Oversampling ... 13
4.2. SMOTE ... 14
4.3. Borderline SMOTE... 15
4.4. G-SMOTE ... 16
5. Conclusion ... 19
6. Bibliography... 20
7. Annexes ... 22
v
LIST OF FIGURES
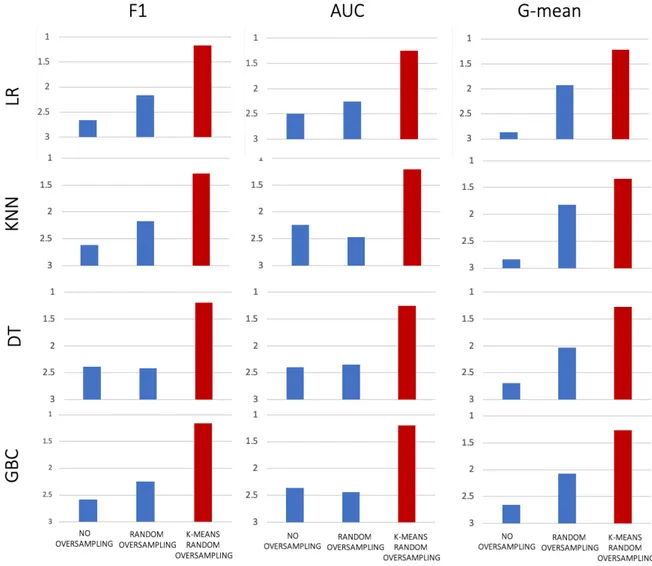
Figure 1 - Mean ranking results for Random Oversampling ... 13
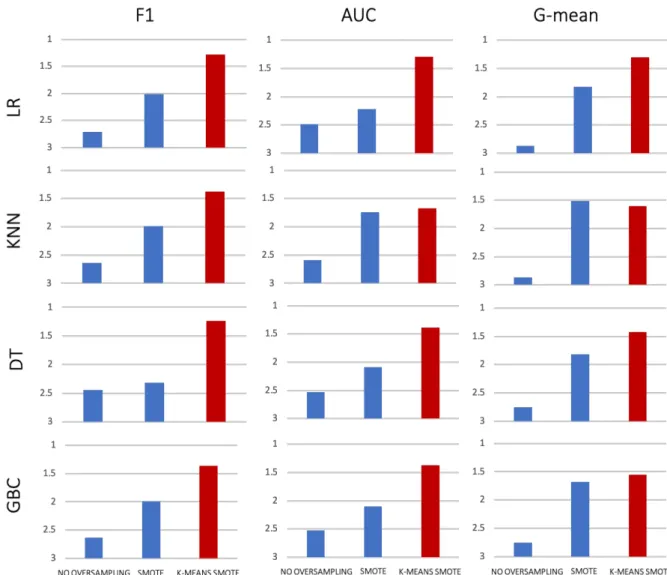
Figure 2 - Mean ranking results for SMOTE ... 14
Figure 3 - Mean ranking results for Borderline SMOTE ... 15
vi
LIST OF TABLES
Table 1 - Confusion Matrix ... 7
Table 2 - Description of the datasets ... 10
Table 3 - Mean ranking results for all oversampling methods across the datasets ... 18
vii
LIST OF ABBREVIATIONS AND ACRONYMS
A-SUWO Adaptive Semi-Unsupervised Weighted Oversampling
ROC AUC Area Under ROC Curve KNN K-Nearest Neighbors LR Logistic Regression DT Decision Tree
SMOTE Synthetic Minority Oversampling Technique SOMO Self-Organizing Map Oversampling
1
1. INTRODUCTION
In light of the growing development in the fields of science and technology that have enabled the exponential increase and availability of raw data, the imbalanced learning problem that arises with the huge amounts of data available has drawn a significant amount of interest from academia, industry, and government funding agencies (HE & Garcia, 2010). Imbalanced learning can be considered a problem when any given data set exhibits an unequal distribution between its classes (HE & Garcia, 2010). It is also important to note that class imbalance is not merely innately binary (or two-class), there is also the possibility of imbalance across multiple classes in multiclass data (HE & Garcia, 2010). Since the predictive capability of classification algorithms is weakened by class imbalance, the challenge when facing this problem is how to improve the prediction results on the under-represented class while managing the trade-off with false positives (Fernández, García, Herrera, & Chawla, 2018). Many of the existing algorithms perform poorly since the minority classes contribute less to the minimization of the objective function. Furthermore, they aim at maximizing classification accuracy, a measure which is biased towards the majority class.
A classifier can achieve high classification accuracy even when it does not predict a single minority class instance correctly. In conclusion, by optimizing classification accuracy, most algorithms assume and are designed to handle a balanced class distribution which explains why learning from imbalanced data remains challenging (Last, Douzas, & Bacao, 2017). Additionally, there is another inherent assumption that many classification algorithms must consider which is equal misclassification costs. This constitutes a problem since this is a situation that seldom occurs in real-world problems.
Class imbalance is a significant problem that can be found in the most diverse of real-word domains and it is considered a recurring issue with high importance (HE & Garcia, 2010). In various domains, imbalanced datasets are actually considered the norm due to the nature of the data space, such as fraud detection in online transactions, rare medical diagnoses, product categorization, detection of oil spills in satellite radar images (HE & Garcia, 2010; Kubat, Holte, & Matwin, 1998; More, 2016).
Typically, in the situations above mentioned, misclassifying the minority class as the majority class has a higher cost associated with it than the other way around.
Lastly, the common problem that can be found in imbalanced datasets and referred to as "small disjuncts problem". This happens when the induction rules that describe the minority concepts are often fewer and weaker than those of majority concepts. This means that the minority class is often both outnumbered and underrepresented (HE & Garcia, 2010) and rule induction is more susceptible to error. Therefore, it is important that classifiers pay adequate attention to small disjuncts.
Dealing with this type of data and still be able to obtain precise predictions is important. It's crucial not only because of the high costs that may occur when a certain instance is misclassified, and misclassifying the minority class as the majority class has a higher cost associated with it than the other way around, but also failing to identify and further investigate what could be novel interesting information (Georgios Douzas & Bacao, 2017b). Therefore, it is evident that a classifier that increases the accuracy for the minority classes without severely risking the accuracy of the majority class is required. Furthermore, this also suggests that the conventional evaluation practice of using singular
2 assessment criteria, such as the overall accuracy or error rate, does not provide adequate information in the case of imbalanced learning (HE & Garcia, 2010).
Many imbalanced dataset resampling methods have been proposed and have proven to be effective in real-word domains, particularly SMOTE which considerably improved upon random oversampling. Additionally, there can be found several variations of SMOTE that aim to combat the weaknesses that still exist when using the original algorithm. However, many of these approaches suffer from either being too complex and not being easily ready for practitioners and researchers or focusing on a single one of SMOTE’s vulnerabilities. Building on from the idea that numerous extensions have been and continue to be proposed, some proposed methods employ clustering techniques before applying random oversampling or SMOTE in order to combat some weaknesses of the existing oversampling algorithms.
The use of clustering enables the oversampling methods to identify and target areas of the input space where the generation of artificial data is most effective. The focus is on eliminating both between-class and within-class imbalances while at the same time avoiding the generation of noisy samples. The appeal of these methods has to do not only with both the widespread availability and simplicity of the chosen clustering algorithm but also with the effectiveness of the methods themselves.
This work suggests the combination of the k-means clustering algorithm in combination with several other oversampling methods to combat some of the other oversamplers’ shortcomings with a simple-to-use technique, K-Means Oversampling. The goal of this study is therefore to investigate and analyze the impact and effectiveness of the additional clustering procedure, prior to the oversampling step, in the imbalanced class distribution environment. For this reason, the outcome of this extra clustering step and its value is explored by analyzing how each individual oversampler technique, with and without the clustering step, fares against each other. Additionally, the focus of this work is put into binary classification tasks.
The remainder of this work is organized as follows. In section 2, related literature is summarized and the currently available different oversampling methods are introduced, with significant focus on oversamplers that employ a clustering procedure. In section 3, a framework with the goal of evaluation and comparison of the oversampling techniques is established. The experimental results are shown in section 4, which is followed by section 5 presenting the conclusions.
3
2. RELATED WORK
It is possible to distinguish three main approaches to learning from imbalanced data. The first approach is the direct modification/creation of algorithms that reinforce the learning towards the minority class. The second approach proposes the hybridization of sampling and cost-sensitive methods at the data or algorithmic level to minimize higher cost errors. The third and more general approach is the modification at the data level by re-sampling the original dataset and modifying the class distribution to make it suitable for a standard learning algorithm (Chawla, Bowyer, Hall, & Kegelmeyer, 2002; G. Douzas & Bacao, 2018; HE & Garcia, 2010; Krawczyk, 2016). After the re-sampling step, the current state of the art classifiers can be used, without further modifications.
In contrast to algorithm-level methods, which are bound to a specific classifier, and cost-sensitive methods, which are problem-specific and need to be implemented by the classifier, methods that address the problem by modification of the data itself and more specifically, oversampling methods that address the problem through the generation of artificial data, constitute a more general approach compared to algorithmic modifications (Georgios Douzas & Bacao, 2017b).
The aforementioned data level solutions include many different forms of resampling. Resampling is the process of manipulating the distribution of the training examples in an effort to improve the performance of classifiers (Jo & Japkowicz, 2004). Generally, sampling methods can be categorized as undersampling and oversampling. Undersampling reduces the number of majority class samples by removing samples from the training set. On the other hand, oversampling works by generating synthetic examples for the minority class and adding them to the training set. It has been shown that both oversampling and undersampling can be effective depending on the specific problem that is being addressed (Chawla et al., 2002). These methods can be further categorized into random and heuristic approaches. The first selects random examples and the latter will take into account the distribution of the instances of the given imbalance learning problem.
With this in mind, when comparing the two methods, it is clear that undersampling excludes information from the learning process which may negatively affect the performance of the classifier in cases where the data set is small (He, Bai, Garcia, & Li, 2008). On the other hand, oversampling creates extra information by generating synthetic examples, which can lead to overfitting.
Several oversampling techniques have been proposed and studied in the past. A simple approach commonly used due to its simplicity and ease of implementation, that has been proven to perform well is known as Random Oversampling. This method works uninformed and aims to balance class distribution through the random replication of minority class examples. With this in mind, since the examples are merely replicated, the likelihood of overfitting occurring increases (Batista, Prati, & Monard, 2004).
In 2002, as an attempt to add information to the training data, Chawla et al. (Chawla et al., 2002) proposed an alternative oversampling method called SMOTE (Synthetic Minority Oversampling Technique). Instead of replicating existing observations, synthetic samples are generated. This is achieved by linear interpolation between a randomly selected sample of the minority class and one of its minority neighboring observations (Georgios Douzas, Bacao, & Last, 2018; Fernández et al., 2018; Liu, Ghosh, & Martin, 2007). SMOTE is the most popular oversampling method that was proposed to improve random oversampling.
4 However, it is important to note that the skewed class distribution - between-class imbalance - is not the only drawback for performance degradation in algorithms. The distribution of the data within each class - within-class imbalance - is also relevant.
The fact that SMOTE randomly chooses a minority instance to oversample with uniform probability allows for an effective solution combating between-class imbalance, leaving other issues such as within-class and small disjuncts unsolved. Input areas containing a large number of minority samples have a high probability of being inflated further, while there can be underrepresented concepts located in small areas of the data that are likely to remain sparse (Fernández et al., 2018) Another concern is the fact that the method is susceptible to noise generation because it doesn’t distinguish overlapping class regions from so-called safe areas.
Despite its weaknesses, the technique is still considered the standard in the framework of learning from imbalanced data. In order to combat its disadvantages and improve its performance under the different possible situations, several modifications and extensions have been proposed throughout the years. They usually address a specific weakness from the original method, such as emphasizing certain minority class regions, combating within-class imbalance, or even attempting to avoid noise generation (Last et al., 2017).
The most frequent properties exploited by the techniques are the initial selection and adaptive generation of synthetic examples. Filtering is becoming more common in recent years, as well as the use of kernel functions. Regarding the interpolation procedure, it is also usual to replace the original method with other more complex ones, such as clustering-based or derived from a probabilistic function (Fernández et al., 2018).
Safe-Level SMOTE modifies the SMOTE algorithm by applying a weight degree, the safe level, in the data generation process. The safe level provides a scale to differentiate between noisy and safe instances (Bunkhumpornpat, Sinapiromsaran, & Lursinsap, 2009).
Similarly, there are two other enhancements of SMOTE called Borderline SMOTE1 and Borderline SMOTE2, in which only the minority examples near the borderline are oversampled. For the minority class, experiments show that our approaches achieve better TP rate and F-value than SMOTE and random over-sampling methods (Han, Wang, & Mao, 2005). Along with this variation, MWMOTE (Majority Weighted Minority Oversampling Technique for Imbalanced Data Set Learning) (Barua, Islam, Yao, & Murase, 2014; He et al., 2008), and its variation KernelADASYN (Tang & He, 2015) aim to achieve the same result.
G-SMOTE (Georgios Douzas & Bacao, 2017a) improves the diversity of generated samples by linearly interpolating generated samples between two minority class instances. G-SMOTE extends the linear interpolation mechanism by introducing a geometric region where the data generation process occurs. The methods above described deal with the between-class imbalance problem and as previously mentioned, there can be two kinds of imbalance present in a data set. To solve this, there are clustering-based methods proposed to effectively reduce not only the between-class imbalance but also the within-class imbalance and to oversample the data set by rectifying these two types of imbalances simultaneously. Firstly, they divide the input space into clusters and in a posterior phase
5 use sampling methods to adjust the size of the newly built clusters (Georgios Douzas & Bacao, 2017b; Jo & Japkowicz, 2004).
Among these clustering-based approaches there is cluster-based oversampling. The algorithm applies random oversampling, after clustering the training examples in the minority and the majority classes, so that the majority and minority classes are of the same size (Jo & Japkowicz, 2004). Nonetheless, since the approach does not generate new data and it merely replicates already existing samples, it is prone to overfitting.
Cluster-SMOTE (Cieslak, Chawla, & Striegel, 2006) initially applies the k-means algorithm to the minority class and then SMOTE is used in the clusters in order to generate artificial data. Similarly, DBSMOTE (Bunkhumpornpat, Sinapiromsaran, & Lursinsap, 2012) uses the DB-SCAN algorithm to discover arbitrarily shaped clusters and then generates synthetic instances along a shortest path from each minority class instance to a pseudo-centroid of the cluster. As a more sophisticated approach, there is A-SUWO (Nekooeimehr & Lai-Yuen, 2016) which creates clusters of the minority class instances with a size, which is determined using cross-validation and generates synthetic instances based on a proposed weighting system.
SOMO (Self-Organizing Map Oversampling) (Georgios Douzas & Bacao, 2017b) creates a two- dimensional representation of the input space and based on it, applies the SMOTE procedure to generate intra-cluster and inter-cluster synthetic data, preserving the underlying manifold structure. Another clustering-based approach called CURE-SMOTE (Ma & Fan, 2017) uses the hierarchical clustering algorithm CURE to cluster the samples of the minor class and remove the noise and outliers before applying SMOTE. The goal of the method is to eliminate the noise points at the end of the process and reduce the complexity because there is no need to eliminate the farthest generated artificial samples after the SMOTE algorithm runs. While it avoids noise generation, possible imbalances within the minority class are ignored.
Consequently, another clustering-based approach that was introduced named K-Means SMOTE (Last et al., 2017) employs the popular k-means clustering algorithm in conjunction with SMOTE oversampling in order to avoid the generation of noise by oversampling only in safe area and shifting its focus not only to fix between-class imbalance but also within-class imbalance. The method attempts to deal with the small disjuncts problem by inflating sparse minority areas and is easily implemented due to its simplicity and the widespread availability of both k-means and SMOTE.
6
3. RESEARCH METHODOLOGY
Ultimately, the purpose of resampling methods is to improve classification results and it is possible to observe that there has been a lot of progress towards this goal when dealing with imbalanced datasets. Most importantly, a lot of the research is focused on clustering-based approaches as a way of countering the effects of class imbalance, as well as attempting to mitigate the existing weaknesses of several oversampling techniques. With this in mind, this study aims to investigate and understand the role and effect of an additional clustering step in the improvement of classification results and how effective it proves to be.
When it comes to analyzing classification results, it is possible to observe that the prediction quality of any given classifier is to be improved subsequent to the resampling step. In other words, the effectiveness of an oversampling method can only be assessed indirectly by evaluating a classifier’s performance that has been trained on oversampled data. This proxy measure, i.e. the classifier performance, is only meaningful when compared with the performance of the same classification algorithm trained on data that has not been resampled. Multiple oversampling techniques can then be ranked by evaluating a classifier’s performance with respect to each modified training set produced by the sampling methods.
A general concern in classifier evaluation is the bias of evaluating predictions for previously seen data. Classifiers may perform well when making predictions for rows of data used during training, but poorly when classifying new data. This problem is also referred to as overfitting. Oversampling techniques have been observed to encourage overfitting, which is why this bias should be carefully avoided during their evaluation. A general approach is to split the available data into two or more subsets and only one is used during training while the other is used to evaluate the classification. The latter is referred to as the holdout set, unknown data, or test dataset.
Arbitrarily splitting the data into two sets, however, may introduce additional biases. One potential issue that arises is that the resulting training set may not contain certain observations, preventing the algorithm from learning important concepts. Cross-validation combats this issue by randomly splitting the data many times, each time training the classifier from scratch using one portion of the data before measuring its performance on the remaining share of data. After a number of repetitions, the classifier can be evaluated by aggregating the results obtained in each iteration. In k-fold cross-validation, a popular variant of cross-validation, k iterations, called folds, are performed. During each fold, the test set is one of k equally sized groups. Each group of observations is used exactly once as a holdout set. K-fold cross-validation can be repeated many times to avoid potential bias due to random grouping (Japkowicz, 2013).
While k-fold cross-validation typically avoids the most important biases in classification tasks, it might distort the class distributions when randomly sampling from a class-imbalanced dataset. In the presence of extreme skews, there may even be iterations where the test set contains no instances of the minority class, in which case classifier evaluation would be ill-defined or potentially strongly biased. A simple and common approach to this problem is to use stratified cross-validation, where instead of sampling completely at random, the original class distribution is preserved in each fold (Japkowicz, 2013).
7
3.1. METRICS
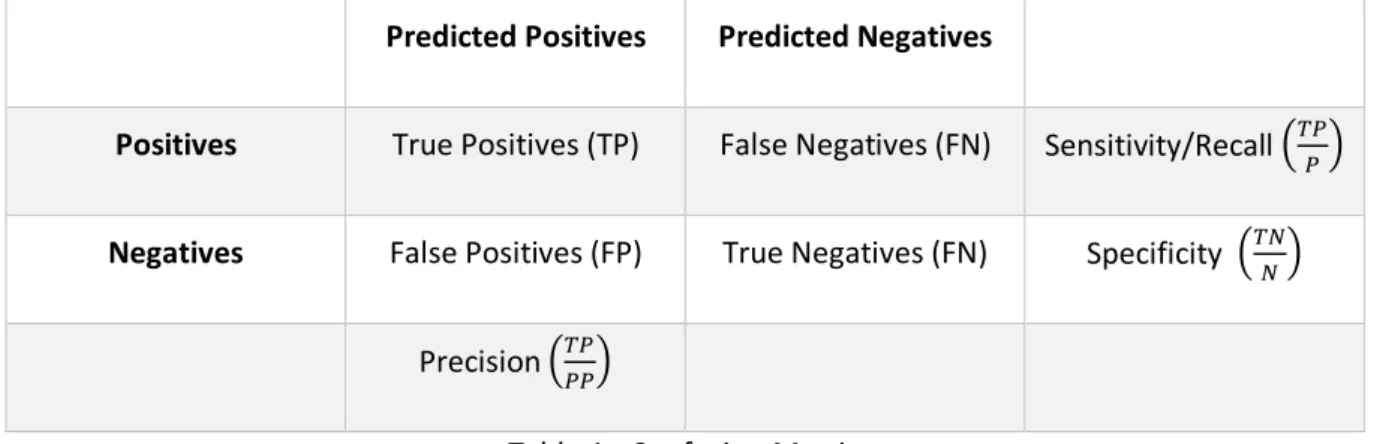
Regarding the assessment metrics that are traditionally used to evaluate classifier performance, not all are suitable when the problem is of the imbalanced nature and the class distribution is skewed. These assessment metrics compare the class membership of each observation with the predictions made by the classifier. With the predictions, it is possible to build the confusion matrix, as seen in Table #.
The most commonly used metrics for classification problems for a balanced dataset are accuracy and error rate, its inverse.
!""#$%"& = )* + ), * + , -$$.$ /%01 = 1 − !""#$%"&
For example, a trivial classifier that always predicts the negative class, the accuracy will be equal to the proportion of negative class observations in the data set, but it will misclassify every positive class observation. Therefore, the total accuracy will be high, suggesting an effective classifier, whereas it is pretty clear that it isn’t since no single minority instance was correctly predicted (HE & Garcia, 2010).
Predicted Positives Predicted Negatives
Positives True Positives (TP) False Negatives (FN) Sensitivity/Recall 45667
Negatives False Positives (FP) True Negatives (FN) Specificity 45887
Precision 456667
Table 1 - Confusion Matrix
Sensitivity, also referred to as recall or true positive rate, explains the prediction accuracy among minority (HE & Garcia, 2010). Precision is the rate of correct predictions among all instances predicted to belong to the minority class, indicating how many of the positive predictions are correct (HE & Garcia, 2010).
As explained above, in the presence of imbalanced data, these metrics show a bias toward the majority class which makes it difficult for a classifier to perform well on the rare classes (Kotsiantis, Kanellopoulos, & Pintelas, 2006).
However, metrics that are able to cope with imbalanced class distribution have been developed and coming into widespread use by being employed when total accuracy is not suitable in order to provide a comprehensive assessment of the problem. With this in mind, in order to determine a general ranking amongst oversampling method, there is no special aspect that is more important than the others, so the following unweighted metrics are chosen: F-measure, g-mean and Area Under Roc Curve (AUC).
8 The F1 score, or F-Measure metric, combines precision and recall as a measure of the effectiveness of classification in terms of a ratio of the weighted importance on either recall or precision as determined by the β coefficient set by the user (HE & Garcia, 2010).
:1 = (1 + <)>× $1"%@@ × A$1"BCB.D < × $1"%@@ + A$1"BCB.D =
(1 + <) × 4)** ×)***7 )*
* × < +)***
Another chosen metric is the geometric mean, or G-Mean metric, which is defined as the geometric mean of sensitivity and specificity (HE & Garcia, 2010).
E − F1%D = GC1DCB0BHB0& × CA1"BIB"B0& = J)** ×), ,
Finally, the last metric to be considered is the AUC (Area Under the ROC Curve). The ROC curve is obtained by plotting the False Positive Rate (FPR) defined as i.e. the proportion of misclassified negative examples relative to the total number of negative class observations, represented in the X-axis versus the Y-X-axis, the True Positive Rate, defined above. Varying the classification threshold of the classifier identifies different points of the ROC curve. Since the ROC curve depends on the classification threshold, the AUC (Area Under the ROC Curve) is a useful metric for the performance of the classifier as it is independent of the decision criterion (HE & Garcia, 2010).
3.2. OVERSAMPLERS
The performance of the following oversamplers was evaluated and compared against their clustering counterparts: Random Oversampling, SMOTE, Borderline and G-SMOTE. For SMOTE and its two variations, more specifically Borderline SMOTE and G-SMOTE, the optimal value of k nearest neighbors was selected as k ∈ {3, 5}.
Furthermore, a hyper-parameter grid was generated for G-SMOTE including the three different selection strategies, the number of nearest neighbors k ∈ {3, 4}, the truncation factor Ltrunc ∈ {−1.0,
0.0, 1.0} and the deformation factor Ldef ∈ {0.0, 0.5, 1.0}. Regarding the K-Means Oversampling
methods, while the hyper-parameters concerning the oversampling technique remain the same, the clustering algorithm adds the following hyper-parameters to the grid:
§ n_clusters ∈ {0.0, 0.25,0.5,0.75, 1.0}; § distances_exponent ∈ {0, 1, 2}; § filtering_threshold ∈ {0.5, 1.0};
3.3. CLASSIFIERS
When it comes to classifiers, several different classification algorithms were chosen to make sure that the results can be generalized and are not constrained to the usage of a specific one. The chosen
9 classifiers were Logistic Regression (LR), Gradient Boosting Classifier (GBC), K-Nearest Neighbors (KNN) and Decision Tree (DT).
Logistic Regression (LR) is a generalization of linear regression which can be used for binary classification. Fitting the model is an optimization problem which can be solved using simple optimizers which require no hyperparameters to be tuned (McCullagh & Nelder, 1989). Because of this, results produced by LR are conveniently reproducible, and therefore, appropriate to be used as a benchmark for more sophisticated approaches.
Additionally, another classification algorithm used can be referred to as k-nearest neighbors (KNN). The algorithm assigns an observation to the class most of its nearest neighbors belong to. The number of neighbors that are considered is determined by the method’s hyperparameterk(Fix and Hodges Jr., 1951).
Finally, Gradient Boosting Classifier (GBC) is an ensemble technique used for classification. In the case of binary classification, one shallow decision tree is induced at each stage of the algorithm. Each tree is fitted to observations which could not be correctly classified by decision trees of previous stages. Predictions of GBC are made by majority vote of all trees. In this way, the algorithm combines several simple models (referred to as weak learners) to create one effective classifier. The number of decision trees to generate, which in binary classification is equal to the number of stages, is a hyperparameter of the algorithm (J. H. Friedman, 2001).
Different combinations of hyper-parameters were used and tested for each of the classifiers mentioned above. The classifiers are used with the default parameters unless stated otherwise. More specifically, the GBC hyper-parameter grid included the combinations resulting from max depth ∈ {3, 6} and number of estimators ∈ {50, 100}. For the Decision Tree Classifier, the combinations resulting from max depth ∈ {3, 6} are tested. Additionally, for KNN, the number of neighbors ∈ {3, 5}.
10
3.4.
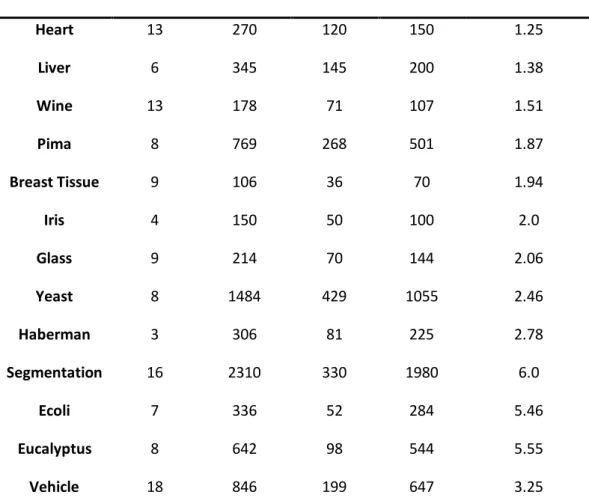
DATASETSIn order to test the performance of the different oversamplers, 13 imbalanced datasets from Machine Learning Repository UCI were used. Table 2 shows a summary of the datasets and their characteristics. Furthermore, to generate additional datasets with higher imbalance ratios, each of the aforementioned datasets was randomly undersampled to generate various other datasets. Undersampled versions of the original datasets are omitted from the table.
Dataset Name # Features # Instances # Minority # Majority Imbalance Ratio
Heart 13 270 120 150 1.25 Liver 6 345 145 200 1.38 Wine 13 178 71 107 1.51 Pima 8 769 268 501 1.87 Breast Tissue 9 106 36 70 1.94 Iris 4 150 50 100 2.0 Glass 9 214 70 144 2.06 Yeast 8 1484 429 1055 2.46 Haberman 3 306 81 225 2.78 Segmentation 16 2310 330 1980 6.0 Ecoli 7 336 52 284 5.46 Eucalyptus 8 642 98 544 5.55 Vehicle 18 846 199 647 3.25
11
3.5.
EXPERIMENTAL FRAMEWORKTo evaluate the different methods, all of the oversamplers, metrics, datasets, and classifiers previously discussed in this section are used. In this study, while many other clustering algorithms could have been selected, the k-means algorithm was adopted due to its simplicity and popularity. K-means works as follows: k training examples are first selected at random as representative of each cluster. The input vector of these representative examples represents the mean of each cluster.
The other training examples are processed one by one. For each of these examples, the distance between it and the k cluster centers is calculated. The example is attributed to the cluster closest to it. The cluster that received the example, has its mean vector updated by averaging the input vectors of all its corresponding examples (Jo & Japkowicz, 2004).
In order to evaluate the performance of the algorithms, results are obtained by applying k-fold cross-validation with k = 3. In each dataset, every metric is computed by averaging their values across runs. In addition to the arithmetic mean, the standard deviation is calculated. Furthermore, in order to achieve optimal results for all classifiers and oversamplers, a grid search procedure is used. For this purpose, each classifier and each oversampler is used with a set of possible values for every hyperparameter.
Subsequently, all possible combinations of an algorithm’s hyperparameters are generated and the algorithms are executed once for each combination. All metrics are used to score all resulting classifications, and the best value obtained for each metric is saved.
Summing up, the experimental procedure was repeated three times and the implementation of the classifiers and standard oversampling algorithms was based on the Python library Scikit-Learn (Pedregosa et al., 2012).
12
4. EXPERIMENTAL RESULTS
Since the main objective of the analysis is to gauge the effects of the different oversampling techniques in combination with a clustering algorithm, results are shown for each individual technique, along with the results of what occurs when there is no oversampling and just the oversampler sans the prior clustering step.
Taking into consideration the recommendations for evaluating classifier performance across multiple datasets (Demšar, 2006), the obtained scores are not compared directly, but instead ordered to derive a ranking. Having said that, the goal is to compare oversamplers, hence the method being adapted to rank the oversampling techniques, instead of classification algorithms.
To derive the rank order, cross-validated scores are used, assigning a ranking score to each oversampling method for every combination of the datasets, 3 metrics and the 4 classifiers. The result is a different ranking for each of the experiment repetitions, divided by dataset, metric and classifier. Keeping in mind that there are three methods being compared, rank one will be attributed to the best performing one and rank three to the worst performing one. Moreover, each method's rank is averaged across datasets and experiment repetition. A method's rank is a real number from the interval [1;3]. The mean ranking results for each combination and classifier, regarding each individual oversampling technique are shown in Figures 1-4.
By testing the null hypothesis that the classifiers do not perform similarly in the mean rankings across the oversampling methods and evaluation metrics, the Friedman test (M. Friedman, 1937) determines the statistical significance of the derived mean ranking. The test is chosen to detect the differences in results across the multiple experiments because it does not assume normality of the obtained scores (Demšar, 2006). At a significance level of a = 0.05, the null hypothesis is rejected for all evaluated classifiers and evaluation metrics. Therefore, all of the rankings are assumed to be significant. The results of the application of the Friedman test for each of the oversampling methods are shown in annex in Table 4.
13
4.1. R
ANDOMO
VERSAMPLINGConsidering the mean ranking results when random oversampling is applied it is possible to observe that the random oversampler when coupled with the clustering algorithm, which can be referred to as K-Means Random Oversampling, seems to outperform the other two methods (no oversampling and random oversampling) regarding all metrics and all classifiers. In all possible twelve combinations, K-Means Random Oversampling achieves a mean rank better than two.
Furthermore, it is the only method with a mean ranking better than two in two particular metrics, F1 score and AUC. Additionally, in three out of nine cases, it can be seen that K-Random Oversampling boosts classification results when Random Oversampling accomplishes a rank worse than no oversampling.
However, it is clear that when no oversampling is applied, the results are the worst amongst the three methods.
14
4.2. SMOTE
Similarly, when the clustering procedure is added before applying SMOTE, thus resulting in K-Means SMOTE, it can be seen that the method frequently outperforms the remaining two, which are no oversampling and regular SMOTE. Significantly, this can be observed regardless of the metric or choice of classifier since the improvement can be seen in eleven out of twelve cases, consistently achieving a mean rank better than two.
The remaining case in which the improvement does not happen is regarding the combination of G-Mean and the KNN classifier where it accomplishes a slightly inferior rank.
15
4.3.
B
ORDERLINESMOTE
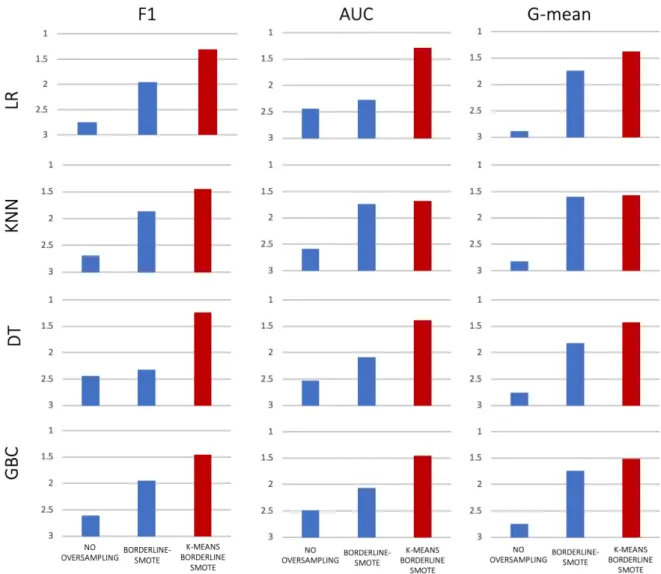
When it comes to the Borderline SMOTE oversampling technique, the evidence shows that the K-Means Borderline SMOTE algorithm outperforms the other two methods (no oversampling and Borderline SMOTE) in all metrics and regardless of the choice in classifiers.
Similarly, it is possible to note that no oversampling provides the worst results.
16
4.4. G-SMOTE
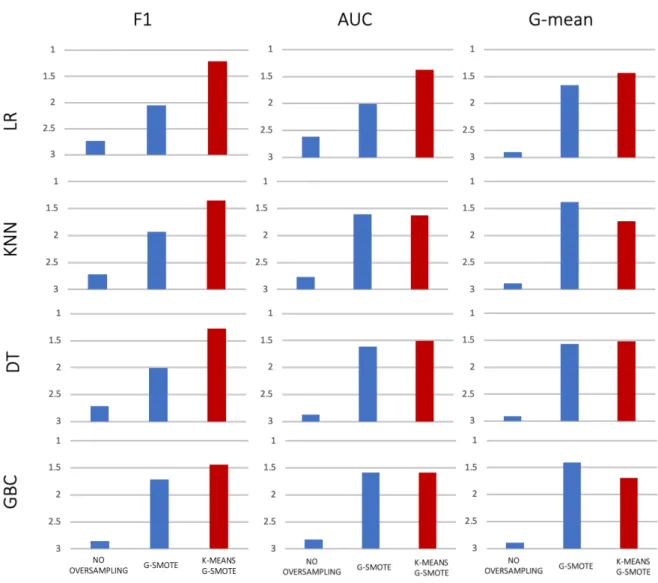
Contrary to what happens in the previous cases, when the oversampler that follows the K-Means algorithms is G-SMOTE the mean ranking results show that the algorithm – K-Means G-SMOTE – only outperforms the other two methods (no oversampling and G-SMOTE) in eight out of twelves cases regarding the various combinations of metrics and classifiers.
This happens in contrast to the evidence previously shown, as it does not always outperform the oversampler with no clustering procedure and the imbalanced data with no oversampling.
However, as previously seen, no oversampling continues to provide the worst results.
Figure 4 - Mean ranking results for G-SMOTE
Taking into consideration the conclusions taken from studied oversampling techniques regarding the different choices in metrics and classifiers, the mean ranking results show that the performance of the different oversampling methods is improved when in combination with a clustering procedure - the k-means clustering algorithm – therefore making it possible to conclude that it adds value to the classification process. Generally, it can be observed that the combination frequently achieves the best
17 results in comparison with the other methods (no oversampling and the oversampling technique with no prior clustering step). This demonstrates that the strength of such an approach is in improving classifier performance in situations in which the original algorithm is not able to achieve any improvement.
To summarize, the mean ranking results of the different methods across the datasets for each combination of a classifier and evaluation metric is presented in Table 3.
Classifier Metric LR KNN DT GBC No Oversampling F1 2,65942029 2,61594203 2,391304348 2,586956522 AUC 2,492753623 2,24637681 2,398550725 2,362318841 G-MEAN 2,862318841 2,83333333 2,695652174 2,65942029 Random Oversampling F1 2,166666667 2,17391304 2,413043478 2,246376812 AUC 2,253623188 2,47101449 2,347826087 2,442028986 G-MEAN 1,920289855 1,82608696 2,036231884 2,072463768 K-Means Random Oversampling F1 1,173913043 1,2826087 1,195652174 1,166666667 AUC 1,253623188 1,21014493 1,253623188 1,195652174 G-MEAN 1,217391304 1,34057971 1,268115942 1,268115942 No Oversampling F1 2,710244928 2,637681159 2,442028986 2,637681159 AUC 2,485507246 2,586956522 2,528985507 2,52173913 G-MEAN 2,869565217 2,869565217 2,753623188 2,760869565 SMOTE F1 2,014492754 1,985507246 2,31884058 2 AUC 2,217391304 1,739130435 2,086956522 2,101449275 G-MEAN 1,826086957 1,52173913 1,81884058 1,68115842 K-Means SMOTE F1 1,275362319 1,376811594 1,239130435 1,362318841 AUC 1,297101449 1,739130435 1,384057971 1,376811594 G-MEAN 1,304347826 1,608695652 1,427536232 1,557971014
18 No Oversampling F1 2,746376812 2,688405797 2,442028986 2,608695652 AUC 2,442028986 2,578710145 2,528985507 2,485507246 G-MEAN 2,884057971 2,826086957 2,753623188 2,746376812 Borderline-SMOTE F1 1,949275362 1,862318841 2,31884058 1,942028986 AUC 2,442028986 1,739130435 2,086956522 2,065217391 G-MEAN 1,739130435 1,601449275 1,81884058 1,739130435 K-Means Borderline-SMOTE F1 1,304347826 1,449275362 1,239130435 1,449275362 AUC 1,289855072 1,68115942 1,384057971 1,449275362 G-MEAN 1,376811594 1,572463768 1,427536232 1,514492754 No Oversampling F1 2,739130435 2,724637681 2,717391304 2,855072464 AUC 2,615942029 2,768115942 2,876811594 2,826086957 G-MEAN 2,905797101 2,891304348 2,905797101 2,898550725 G-SMOTE F1 2,050724638 1,927536232 2,007246377 1,710144928 AUC 2,007246377 1,608695652 1,615942029 1,586956522 G-MEAN 1,65942029 1,376811594 1,572463768 1,405797101 K-Means G-SMOTE F1 1,210144928 1,347826087 1,275362319 1,434782609 AUC 1,376811594 1,623188406 1,507246377 1,586956522 G-MEAN 1,434782609 1,731884058 1,52173913 1,695652174 Table 3 - Mean ranking results for all oversampling methods across the datasets
As mentioned in the previous section, the results discussed above are based on 10-fold cross-validation with ten repetitions, using tests to make sure of their statistical significance.
Overall, it is possible to conclude that coupling oversampling methods with clustering adds significant value, as it can be seen by the results, and it can be considered effective in generating samples which will ultimately help the classifiers’ performance in the presence of skewed data distribution.
Remarkably, the superiority of the methods - K-Means Oversampling - can be observed independently of the classifier, thus proving the relevance of the clustering procedure.
19
5. CONCLUSION
Imbalanced learning in supervised learning remains a challenging task for standard algorithms. There are many existing methods developed to address this problem, the more general approach to achieving a balanced class distribution is data level modification, instead of algorithm modifications. Although class imbalances are responsible for significant losses of performance in standard classifiers in many different types of problems, another aspect that is important to consider is the small disjuncts problem.
However, most oversamplers do not take into consideration class distribution within the minority class. Therefore, it is important to consider and understand solutions that not only consider the between-class imbalance (the imbalance occurring between the two classes) but also the within-class imbalance (the imbalance occurring between the sub-clusters of each class) and to oversample the data set by rectifying these two types of imbalances simultaneously. It has been shown that cluster-based oversampling is a robust solution that takes into consideration these two problems and combats some of the other oversamplers’ shortcomings. By adding a clustering step, the oversampler is able to identify and target areas of the input space where the generation of data will be most effective. Empirical results show that training various types of classifiers using data oversampled with the combination of the k-means clustering algorithm and different oversampling techniques leads to better classification results than training with unmodified, still imbalanced data. More significantly, these cluster-based approaches consistently outperform the most widely available oversampling techniques such as SMOTE, Borderline-SMOTE, and Random Oversampling. Additionally, the results are statistically robust and can be applied to the various metrics suited for the evaluation of imbalanced data classification.
Every technique results of the combination of the clustering algorithm, k-means, and an oversampler, so all the algorithms presented are easily reproducible, since all components are easily available in many programming languages. Thus, making it simple for researchers and users to implement these effective methods in their individual problems. As imbalanced learning continues to be a significant problem in real-world applications, obtaining robust results, in an efficient and simple manner, independently of the chosen classifier and dataset makes a significant impact in the field.
Future work may include extending this type of clustering-based oversampling approaches to multi-class problems. Cases might happen, especially in real-world applications, where multiple multi-classes are present and the solutions available for binary-class problems may not be directly applicable or may achieve a lower performance than expected.
20
6. BIBLIOGRAPHY
Barua, S., Islam, M., Yao, X., & Murase, K. (2014). MWMOTE--Majority Weighted Minority
Oversampling Technique for Imbalanced Data Set Learning. Knowledge and Data Engineering, IEEE Transactions on (Vol. 26). https://doi.org/10.1109/TKDE.2012.232
Batista, G. E. A. P. A., Prati, R. C., & Monard, M. C. (2004). A Study of the Behavior of Several Methods for Balancing Machine Learning Training Data. SIGKDD Explor. Newsl., 6(1), 20–29.
https://doi.org/10.1145/1007730.1007735
Bunkhumpornpat, C., Sinapiromsaran, K., & Lursinsap, C. (2009). SMOTE: Safe-level-synthetic minority over-sampling technique for handling the class imbalanced problem. Lecture
Notes in Computer Science (Including Subseries Lecture Notes in Artificial Intelligence and Lecture Notes in Bioinformatics), 5476 LNAI, 475–482.
https://doi.org/10.1007/978-3-642-01307-2_43
Bunkhumpornpat, C., Sinapiromsaran, K., & Lursinsap, C. (2012). DBSMOTE: Density-Based Synthetic Minority Over-sampling TEchnique. Applied Intelligence, 36(3), 664–684.
https://doi.org/10.1007/s10489-011-0287-y
Chawla, N. V., Bowyer, K. W., Hall, L. O., & Kegelmeyer, W. P. (2002). SMOTE: Synthetic minority over-sampling technique. Journal of Artificial Intelligence Research, 16, 321–357.
https://doi.org/10.1613/jair.953
Cieslak, D. A., Chawla, N. V., & Striegel, A. (2006). Combating imbalance in network intrusion datasets. 2006 IEEE International Conference on Granular Computing, 732–737.
https://doi.org/10.1109/GRC.2006.1635905
Demšar, J. (2006). Statistical Comparisons of Classifiers over Multiple Data Sets. Journal of Machine
Learning Research, 7, 1–30. https://doi.org/10.1016/j.jecp.2010.03.005
Douzas, G., & Bacao, F. (2017a). Geometric SMOTE: Effective oversampling for imbalanced learning through a geometric extension of SMOTE, 1–22. Retrieved from
http://arxiv.org/abs/1709.07377
Douzas, G., & Bacao, F. (2017b). Self-Organizing Map Oversampling (SOMO) for imbalanced data set learning. Expert Systems with Applications, 82(October), 40–52.
https://doi.org/10.1016/j.eswa.2017.03.073
Douzas, G., & Bacao, F. (2018). Effective data generation for imbalanced learning using conditional generative adversarial networks. Expert Systems with Applications, 91, 464–466.
https://doi.org/10.1016/j.eswa.2017.09.030
Douzas, G., Bacao, F., & Last, F. (2018). Improving imbalanced learning through a heuristic oversampling method based on k-means and SMOTE. Information Sciences, 465, 1–20. https://doi.org/10.1016/j.ins.2018.06.056
Fernández, A., García, S., Herrera, F., & Chawla, N. V. (2018). SMOTE for Learning from Imbalanced Data: Progress and Challenges, Marking the 15-year Anniversary. Journal of Artificial
Intelligence Research. Journal of Artificial Intelligence Research.
Friedman, J. H. (2001). Greedy function approximation: A gradient boosting machine. Annals of
21 Friedman, M. (1937). The Use of Ranks to Avoid the Assumption of Normality Implicit in the Analysis
of Variance. Journal of the American Statistical Association, Vol. 32, No. 200, (Dec., 1937), Pp.
675- 701, 32(200), 675–701.
Han, H., Wang, W., & Mao, B. (2005). Borderline-SMOTE : A New Over-Sampling Method in, 878–887. He, H., Bai, Y., Garcia, E. A., & Li, S. (2008). ADASYN: Adaptive synthetic sampling approach for
imbalanced learning. Proceedings of the International Joint Conference on Neural Networks, (3), 1322–1328. https://doi.org/10.1109/IJCNN.2008.4633969
HE, H., & Garcia, E. a. (2010). Learning from Imbalanced Data Sets. IEEE Transactions on Knowledge
and Data Engineering, 21(9), 1263--1264. https://doi.org/10.1109/TKDE.2008.239
Japkowicz, N. (2013, June 10). Assessment Metrics for Imbalanced Learning. Imbalanced Learning. https://doi.org/doi:10.1002/9781118646106.ch8
Jo, T., & Japkowicz, N. (2004). Class imbalances versus small disjuncts. ACM SIGKDD Explorations
Newsletter, 6(1), 40. https://doi.org/10.1145/1007730.1007737
Kotsiantis, S., Kanellopoulos, D., & Pintelas, P. (2006). Handling imbalanced datasets : A review, 30. Krawczyk, B. (2016). Learning from imbalanced data: open challenges and future directions. Progress
in Artificial Intelligence, 5(4), 221–232. https://doi.org/10.1007/s13748-016-0094-0
Kubat, M., Holte, R. C., & Matwin, S. (1998). Machine learning for the detection of oil spills in satellite radar images. Machine Learning, 30(2–3), 195–215. https://doi.org/10.1023/A:1007452223027 Last, F., Douzas, G., & Bacao, F. (2017). Oversampling for Imbalanced Learning Based on K-Means and
SMOTE, 1–19. Retrieved from http://arxiv.org/abs/1711.00837
Liu, A., Ghosh, J., & Martin, C. E. (2007). Generative Oversampling for Mining Imbalanced Datasets.
International Conference on Data Mining, 66–72. https://doi.org/10.1.1.91.7206
Ma, L., & Fan, S. (2017). CURE-SMOTE algorithm and hybrid algorithm for feature selection and parameter optimization based on random forests. BMC Bioinformatics, 18(1), 1–18. https://doi.org/10.1186/s12859-017-1578-z
McCullagh, P., & Nelder, J. A. (1989). Generalized Linear Models, Second Edition. https://doi.org/10.1007/978-1-4899-3242-6
More, A. (2016). Survey of resampling techniques for improving classification performance in unbalanced datasets, 10000, 1–7. Retrieved from http://arxiv.org/abs/1608.06048
Nekooeimehr, I., & Lai-Yuen, S. K. (2016). Adaptive semi-unsupervised weighted oversampling (A-SUWO) for imbalanced datasets. Expert Systems with Applications, 46, 405–416.
https://doi.org/https://doi.org/10.1016/j.eswa.2015.10.031
Pedregosa, F., Varoquaux, G., Gramfort, A., Michel, V., Thirion, B., Grisel, O., … Duchesnay, É. (2012). Scikit-learn: Machine Learning in Python. Journal of Machine Learning Research, 12, 2825–2830. https://doi.org/10.1007/s13398-014-0173-7.2
Tang, B., & He, H. (2015). KernelADASYN: Kernel based adaptive synthetic data generation for imbalanced learning. In 2015 IEEE Congress on Evolutionary Computation (CEC) (pp. 664–671). https://doi.org/10.1109/CEC.2015.7256954
22
7. ANNEXES
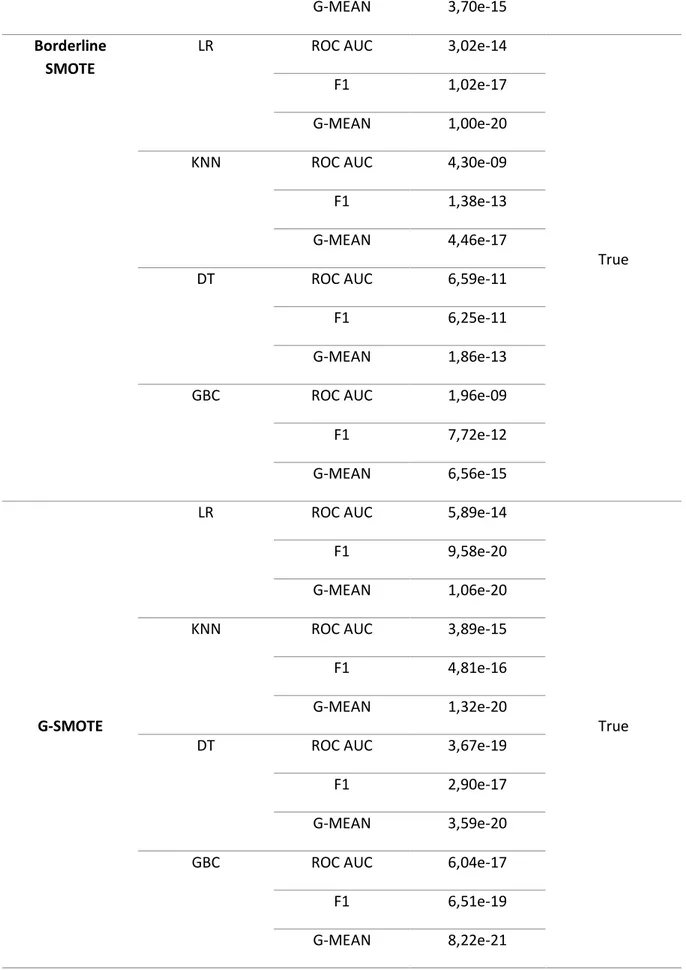
The following table shows the output that results of application of the Friedman test, concerning all tested oversamplers.
Oversampler Classifier Metric p-value Significance
Random Oversampling
LR ROC AUC 8,33e-16
True
F1 8,07e-20
G-MEAN 4,39e-23
KNN ROC AUC 9,36e-15
F1 1,85e-18
G-MEAN 8,65e-21
DT ROC AUC 3,03e-14
F1 2,76e-16
G-MEAN 4,33e-17
GBC ROC AUC 2,85e-16
F1 1,06e-18
G-MEAN 1,13e-16
SMOTE
LR ROC AUC 1,62e-14
True
F1 4,92e-18
G-MEAN 2,51e-21
KNN ROC AUC 2,41e-09
F1 8,92e-14
G-MEAN 5,75e-19
DT ROC AUC 1,54e-11
F1 4,81e-15
G-MEAN 1,00e-15
GBC ROC AUC 2,14e-11
23
G-MEAN 3,70e-15
Borderline SMOTE
LR ROC AUC 3,02e-14
True
F1 1,02e-17
G-MEAN 1,00e-20
KNN ROC AUC 4,30e-09
F1 1,38e-13
G-MEAN 4,46e-17
DT ROC AUC 6,59e-11
F1 6,25e-11
G-MEAN 1,86e-13
GBC ROC AUC 1,96e-09
F1 7,72e-12
G-MEAN 6,56e-15
G-SMOTE
LR ROC AUC 5,89e-14
True
F1 9,58e-20
G-MEAN 1,06e-20
KNN ROC AUC 3,89e-15
F1 4,81e-16
G-MEAN 1,32e-20
DT ROC AUC 3,67e-19
F1 2,90e-17
G-MEAN 3,59e-20
GBC ROC AUC 6,04e-17
F1 6,51e-19
G-MEAN 8,22e-21