CATÓLICA LISBON SCHOOL OF BUSINESS & ECONOMICS
Complements or Substitutes?
Understanding the impact of Trade
Secrecy & Covenants not to
Compete on invention value
Master Thesis
Júlio Lopes 12/15/2012
The purpose of this thesis is to understand the relationship of trade secrecy and covenants not to compete. To accomplish this task a differences-in-differences analysis was conducted on a sample of 659,945 U.S. patents generated by U.S. public companies. Empirical findings highlight that the use of both trade secrecy and covenants not to compete has a positive impact on the expected value and variance of the invention value distribution.
1
Contents
Introduction ... 2
Literature Review ... 4
Methods ... 8
Sample and data ... 8
Measures ... 9 Dependent Variable ... 9 Independent Variables ... 10 Control Variables ... 11 Empirical Strategy ... 12 Results ... 13 Robustness Checks ... 15 Discussion &Conclusions ... 17 References ... 19 Appendix ... 22 Appendix 1. ... 22 Appendix 2. ... 24 Appendix 3. ... 25
2
Introduction
“Don’t let your employees do to you what you did to your former boss!” – Roger Borovoy, Counsel in the Silicon Valley office of Fish & Richardson P.C.
Innovation is a crucial aspect of business in knowledge intensive industries. It may topple market leaders and transform the industry completely. Any firm needs to pursue new knowledge and protect it in order to appropriate the returns successfully (Agarwal et al. 2009, Shaver and Flyer 2000).
However, knowledge may not be easy to protect due to its tacit nature. Tacit knowledge is inserted in the human capital of researchers and inventors. As such, the only way to protect this knowledge is by binding their employees with legal tools such as trade secrecy or covenants not to compete.
Statistics show us that these types of protections are in fact increasingly used by companies. Trade Secret (hereafter TS) litigation doubled from 1988 to 1995 and doubled again from 1995 to 2004 (Almeling et. al 2010). As for covenants not to compete (hereafter CNC), nowadays virtually 70% of start-ups receiving venture capital funds are required to sign a CNC (Kaplan and Stromberg 2003), whereas, in the IT industry, 80% of its new employees sign a non-compete contracts (Holley 1998).
The effect of TS and CNC is strongly debated among scholars and policy-makers. On one hand, TS and CNC limit knowledge diffusion, which is crucial for innovation and economic growth (Snowdon& Vane 2005). On the other hand, they create incentive to innovate, by granting to the innovator a: a sort of “monopoly” over the new knowledge (Samila and Sorenson 2011, Franco & Mitchel 2008).
Previous research has generally treated TS and CNC as substitute, due to the similarity of their purpose. Thus, we still lack an understanding of how the protection granted by TS and CNC interact with each other. The goal of this study is precisely to investigate this interaction between these two legal tools, in order to ascertain their joint impact on the invention value distribution. In particular, I hypothesize that TS and CNC are complements, inducing firms to undertake risky but more valuable R&D paths.
3 In order to verify this hypothesis, I applied a difference-in-difference analysis using data collected from NBER database from 1976 to 2006. Specifically I relied on the number of forward citations as a measure of invention value (Albert et al, 1991 Trajtenber 1990, Hall, Jaffe, and Trajtenberg 2005, Gambardella et al., 2008). Moreover, I took advantage of both Png’s (2011) Uniform Trade Secrets Act (UTSA) enactment chronology and Garmaise’s (2009) non-compete Enforceability Index as measures of application and strength of those legal tools.
Results show that the joint enforceability of TS and CNC leads companies to pursue more daring and valuable inventions. The evidence of a complementary relation between these legal tools not only fills a gap in the academic literature it draws important conclusions for policy maker and business management.
The structure of this thesis is as follows. Firstly, I make a brief literature review encompassing all relevant research for my analysis. Then I illustrate the empirical approach and the results obtained. I conclude discussing the results, and describing the contributions and limitations of this work.
4
Literature Review
To effectively become and remain competitive, firms should pursue new knowledge, capture its value and protect it (Agarwal et al. 2009, Shaver and Flyer 2000). Indeed, limiting leakages in R&D intensive companies is crucial for retaining a competitive advantage over competitors (Ceccagnoli 2009).
However the protection of knowledge might be difficult. Knowledge is the accumulation of information through experience, communication or inference (Zack 1999), and can be explicit or tacit. Both types of knowledge are abstract, but the easiness to transfer them is what that makes them different. The former can be codified through books, computer code or formulas. The latter, can instead only be transferred through conversation, story-telling and shared experience.
The difficulty to articulate tacit knowledge makes its protection more difficult. Patents are usually useless regarding tacit knowledge, which leads managers to use other type of legal means. Even so knowledge could slip out of their control. Thus the question of how to appropriate the returns of tacit knowledge remains. The answer lies in the vehicle of knowledge transfer, their employees. ‘The best way to send information is to wrap it up in a person - J. Robert Oppenheimer’ (quoted in Stephan 2006)
To counter this threat, companies seek out to protect themselves in other ways to successfully appropriate their returns on their R&D investment. Indeed Cohen et al. (2000) shows that there is a preference of using other means for capturing value from innovation, such as lead time, complementary assets and most importantly secrecy. Trade Secrecy law dates back to the nineteenth century when capitalism start evolving with the industrial age. The Peabody v. Norfolk case, in 1860, enabled the Massachusetts Supreme Judicial Court to crystallize the law of trade secrets in the United States (Bone 1998). In 1939 in the Restatement (First) of Torts trade secret law was defined as “any formula, pattern, device or compilation of information which is used in one's business, and which gives him an opportunity to obtain an advantage over competitors who do not know or use it". However, only in 1979 with the National Conference of Commissioners on Uniform States Law the Uniform Trade Secrets Act
5 (UTSA) was created a reference regulation for all US states, even if the timing of adoption was different across states..
Trade Secrecy is one of the most important tools to appropriate returns of innovation, especially, technical innovation (Arundel and Kabla 1998; Arundel 2001). Its main advantage, relatively to patents, is its broader protection: knowledge does not need to be novel in order to be protected and it is protected by TS as long as companies find it useful. Companies, such as Coca-Cola, Google or Intel, use trade secrecy and it is part of what enables them to sustain their competitive advantage.
One of the most important cases is the one of Intel against Broadcom. In March 2000, Broadcom and four ex-employees were sued by Intel for misappropriation of trade secrets. According to Intel those ex-employees would “inevitably disclose” Intel’s trade secrets. Additionally, Intel asked for an injunction that forbidden its ex-employees working for their competitors. Of the four ex-employees one was indeed barred from working for Broadcom.
Similarly, covenants not to compete are also aimed to impede the transfer of knowledge. A CNC contract states that if an employee leaves their current job, he cannot work for competing firms, including newly formed companies. One could say that a CNC is sort of a signed confession of the ‘inevitability of disclosure’ of trade secrets by the employee. The CNC contract enforcement may be limited in time or even geography pending on court’s decision.
CNC date back to the time of crafting Guilds. At that time, there was no need to do formalized CNC, since they were an inherent part of any master and apprentice relation. It was only in the eighteenth century in England with the Mitchel v. Reynold case (Fisk 1999) that formal rules were established.
This logic on CNC’s spread also to the United States which accepted the enforceability of CNC’s. However the regulation of CNC, contrary to trade secrets, varies from state to state, as there is no uniform Act regulating non-compete contracts1. CNC’s are commonly used in many states. According to Kaplan and Stromberg (2003), about 70% of entrepreneurs receiving venture capital funds are required to sign a covenant not to
1Trade secrecy law can also rely on common law. In fact there are four states who still abide to the
Restatement of Torts and use still common law to rule trade secrecy cases ( Massachusetts; New York, New Jersey, Texas and North Carolina)
6 compete. At the same time, almost 80% of new IT professionals are required to sign a CNC contract (Holley 1998).
Both TS and CNC’s are extensively used by companies to appropriate the returns of their R&D investments, though at the expense of their employees’ mobility. This tradeoff between knowledge protection and diffusion is widely debated. On the one hand, they limit employee mobility and knowledge diffusion, and eventually hamper innovation, as also pointed out by the endogenous growth theories (Snowdon & Vane 2005 pg. 626). Gilson (1999) and Hyde (2001) argue that the statute in California (California Business and Professions Code, Section 16600), which prohibits CNC’s, determined the rising of Silicon Valley as the best technology cluster in the United States, at the expense of Route’128 in Massachusetts ,which instead enforced CNC’s. Along similar lines, Graves and Diboise (2006) argue that the ‘inevitable disclosure’ theory poses a great threat to innovation due to its overbroad restriction. Employers have in many cases malicious intent, in that they only aim at blocking their former employee. Hence, they use and “swamp” accusations of misappropriation of secrecy even when they are not true. Due to the misuse of TS, employee mobility and (legal) knowledge spillovers, which are fundamental to innovation, are hampered.
On the other hand, both CNC’s and TS may instead foster innovation. Franco & Mitchel (2008) discuss the importance of CNC enforceability in a new industry in order to incentive and stimulate new ideas, entrepreneurship and ultimately innovation. On top of that, CNC’s do not block innovation but instead give firms the incentive to pursue risky but potentially path-breaking R&D projects. In this sense, they create a trade-off between entrepreneurship and intrapreneurship (Conti, forthcoming): with higher CNC enforceability, companies are more inclined to take riskier R&D projects, which more likely lead to a path-breaking discovery. Moreover, Png (2012) shows that the TS do not limit inventor mobility in high-tech companies, which puts into question the detrimental effect of trade secret law on knowledge spillovers and thus innovation. Previous studies have generally considered TS and NC as substitutes, in the sense that both of them help companies protect their knowledge, impeding employees to bring valuable information to other employers. However, one might instead argue that TS and CNC’s are quite different. First, TS ensure a protection ex post, whereas CNC provide with a protection ex ante. That is, TS limit the knowledge leakages only once
7 employees have left the company. Instead, CNC directly prevent the employees from moving to a competitor. Second, TS impede the transfer of knowledge regardless whether the new employer is a direct competitor or not. By contrast, CNC prevent knowledge leakages only to direct rivals. Hence, TS and CNC might ensure a more effective protection only when they are used together. The purpose of this study falls exactly into this question: are CNC’s and TS complements, in that the protection granted by one legal tool is enhanced by the concurrent use of the other, or substitutes, in that they essentially play the same role?
In order to seek out the answer to my research question, I analyze the interaction between CNC and TS on both the expected value and the variance of the invention value. With respect to Png (2012), this work differs in two dimensions. First, I am explicitly interested in the joint impact of TS and CNC, rather than in their separate effect. Second, I consider the impact on firm R&D outcome, rather than on employee mobility. I expect that firms operating in states where both TS and CNC are enforceable are in fact provided with a broader knowledge protection with respect to firms in states where just one of these legal means is enforceable. As a result, I hypothesize that TS and CNC complement each other, and they jointly induce companies to pursue more daring R&D paths which in turn lead to more valuable outcomes (Conti, forthcoming).
8
Methods
Sample and data
To investigate the impact of CNC and TS on invention value, I used the latest National Bureau of Economic Research (NBER) patent database. This database provides information about all patents applied and granted in US between 1976 and 2006, including the citations they have received over time, which is crucial for the present empirical analysis.
The choice to restrict the analysis just to patents applied for by US public companies was to facilitate the assignation of patent to an organization unequivocally. The concordance file provided by Bessen (2009) enabled the connection between the assignee identification number of the NBER patent dataset and the GVKEY identification number of Compustat database, which contains information exclusively on companies traded in the US stock market. Then with the GVKEY identification code, all patents owned by a company’s subsidiaries were univocally assigned to the parent firm. Furthermore, in order to keep the sample sound, I only considered the perfect matches between the NBER and Compustat databases. I also dropped any observation that had negative R&D expenditure.
Following Png (2011), which I used as a source of UTSA adoption in US, I chose 1976-2006 for the period of analysis. The UTSA was first enacted with effect from 1981, therefore I start the analysis five years before the first elective date of the UTSA. As for the reasoning behind the last year covered by the analysis, it is because it is the last year covered by the NBER Patent Database.
This period, however, might raise a problem due to the fact that the Garmaise (2009) index about CNC enforceability covers only the time period between 1992 and 2004. However, according to Samila and Sorenson (2011), no critical changes were registered in the last thirty years, with exception of four states. Within these four states only two, Michigan in 1985 and Oregon in 2008, are not covered in the time period. From those two, I was able to include Michigan change, as it will be explained later.
Totally I gathered 659,945US patents applied and granted to public companies during 1976-2006.
9
Measures
After providing the characteristics of the sample used in the analysis, this section will provide the information about the variables constructed to execute the analysis of the relationship between covenants not to compete and trade secrecy regarding the
invention value. For an easier comprehension, Table 1 sums up all the variables used in the empirical analysis.
Table 1. Measure
Variables
Definition
Invention Value
Number of forward citations received by a patent
Source: NBER patent database
TS
Dummy variable that takes the value of 1 if the state in which the patent was applied has enacted the UTSA in that year.
Source: Non-competition Enforcement Index (Png, 2011)
CNC
Degree of enforceability of non-competes ranging from 0 to 9 Source: Non-competition Enforcement Index (Garmaise, 2009)
TSxCNC Interaction variable of TS and GCNC
R&D Expenditure
Research & Development expenditure of the firm that holds the patent (MM$)
Source: NBER Database
Employees
Number of employees of the firm that holds the patent (M)
Source: NBER Database Source: NBER Database
Year Dummies Dummy variable coded as 1 for each year of the sample period 1976-2006 State Dummies Dummy variable coded as 1 for each
state of the U.S.
Dependent Variable
Invention Value
In order to assess the impact on the firm invention value I used the number of forward citations received by a patent. The number of citations is highly correlated with many
10 measures of economic or technological value, including the contribution to an organization’s value (Hall, Jaffe, and Trajtenberg, 2005), inventors’ assessments of economic value (Gambardella et al.,2008), expert evaluations of patent value (Albert et al, 1991), patent renewal rates (Harhoff et al.,1999) and consumer surplus generated (Trajtenberg, 1990).
Independent Variables
Trade Secrecy (TS)
To assess the impact of trade secrecy regulation, following Png (2011), I coded the variable TS to be equal to 1 if the state of the firm’s headquarters in that given year has already enacted the UTSA, and zero otherwise. The UTSA established a comprehensive statute for all states without significant case law (Png 2011), and also expanded the definition of a trade secret (Lydon 1987, Samuel and Johnson 1990).
According to Png (2011) the timing of adherence to the UTSA is completely unrelated to anything besides the legislation agenda which is consistent with prior research by Ribstein and Kobayashi 1996. Therefore it is possible to conclude that the time of enactment of UTSA is truly exogenous.
Garmaise Non- Competion Enforcement Index (GCNC)
In order to measure the enforceability of covenants not to compete across the states of U.S., I used the Non-Competition Enforcement Index elaborated by Garmaise (2009). The enforceability index consists on a factor score considering the effects of changes in state regulations over time and cross-sectional differences in state laws based on the 12 questions formulated by Malsberger (2004). These questions had the objective of assessing the different aspects of covenants not compete legislation across the fifty states of U.S. and D.C. The factor score was done by assigning one point to each question if the state’s CNC enforcement exceeded a given threshold, hence, the index range of zero to twelve.
Garmaise (2009) Index starts only in 1992. Yet, according to Samila and Sorenson (2011) no major changes took place on the enforcement of covenants to compete in the last thirty years, except four cases. Two of them (Florida in 1996 and Texas in 1994) are already included in Garmaise (2009) index. The other two are Michigan in 1985 and
11 Oregon in 2008. According to Marx et al (2007), Michigan, in 1905, passed the statute 445.761 which has a great similarity to the California section 16600, “All agreements and contracts by which any person…agrees not to engage in any avocation or employment…are hereby declared to be against public policy and illegal and void.”, meaning it explicitly prohibited any form of covenants not to compete. The law changed again only in 1985 due to the Michigan Antitrust Reform Act, which repealed the prohibition. Hence, I assumed that the enforcement degree of Michigan before 1985 was zero, as in California.
All the changes in the state legislature regarding CNC can be considered exogenous. The first change in Michigan in 1985 was due to an antitrust reform secondary effect. Similarly is Texas which changed its legislation due to a Texas Supreme Court. It is likely that companies in both cases were not aware of the inbound change in the enforcement. More dubious is the change in Florida enforcement which was caused by a direct change in state legislation, so companies would most likely be aware of the impending change and adapt their R&D practices.
Trade Secrecy*Covenants Not to Compete
To assess the relationship of Trade Secrecy and Covenants Not to compete, I made an interaction variable with the enforcement index and the trade secrecy variables. This variable is crucial to answer the research question of this study.
Control Variables
In order to reduce the risk of over or underestimation some control variables were introduced in the analysis: R&D expenditure and number of employees. The first one, R&D expenditure has the intention of controlling the effect the total investment in R&D might have in the number of citations, as well as the second, the number of employees, since big companies tend to have more patents and consequently might have more forward citations.
12
Empirical Strategy
To analyze the relationship between trade secrecy and covenants not to compete, I used a differences-in-differences technique. The various states enacted the UTSA and made changes to the enforceability of CNCs with effect in different years. Hence, I used the procedure of Acharya et al. (2010) using panel estimation to implement a differences in differences in a setting of multiple treatment groups over multiple years. Specifically, I estimated the following model through OLS:
In the equation, represents the number of forward citations and is the
idiosyncratic error for company i in state s in year t. Further, =1 for any year t in which the UTSA was effective in state s and zero otherwise; is the enforceability level of a state s in a given year i. Finally represents the interaction of
both described variables. are the firm, time and state fixed effects.
Still, a problem that might arise from using the difference-in-differences estimation is the inconsistency in standard errors that can result from serial correlations among observations and that may be extremely high if the analysis includes several periods of time. This issue may lead to false statistical significance in the treatment. Hence, I clustered the errors to the state level following the strategy of Bertrand et al. (2004). I have specified all absolute variables, R&D expenditure, number of employees and forward citations as logarithms; and relative measures, CNC and TS, in their native form.
As robustness checks I first shorten the period of analysis from 1990 to 2006, to not only shorten the number of observations but also to focus mainly on the period of that changes occurred in the CNC enforceability to confirm the relation between the two legal tools. Secondly, I collapsed the sample at the firm level. I did an OLS regression using as dependent variable the average value of inventions produced by a firm (through OLS). These actions were performed using STATA v.12 software.
13
Results
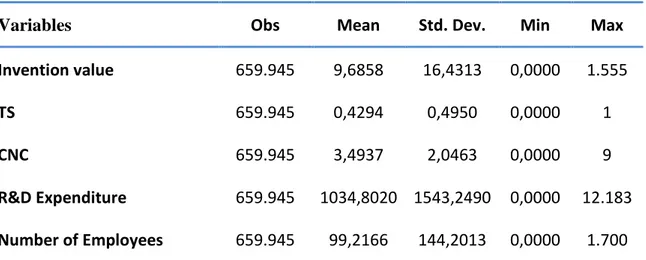
Before presenting the regressions I provide some descriptive statistics and the correlation matrix of the variables used.
Table 2. Descriptive Statisitcs
Variables Obs Mean Std. Dev. Min Max
Invention value 659.945 9,6858 16,4313 0,0000 1.555
TS 659.945 0,4294 0,4950 0,0000 1
CNC 659.945 3,4937 2,0463 0,0000 9
R&D Expenditure 659.945 1034,8020 1543,2490 0,0000 12.183 Number of Employees 659.945 99,2166 144,2013 0,0000 1.700
As we can observe in Table 3, it is visible a similar effect that Png (2011) discovered which is the negative impact of UTSA enactment in forward citations, even if we cannot really infer anything from a mere bivariate correlation
Table 3. Correlation Matrix
Variables 1 2 3 4 5 1 Invention value 1,0000 2 TS -0,0676 1,0000 3 CNC 0,0220 -0,3124 1,0000 4 R&D Expenditure -0,0368 -0,0212 -0,0558 1,0000 5 Number of Employees 0,0355 -0,2023 0,0817 0,6022 1,0000
14 Also worth mentioning is the high correlation between the control variables which enhances the chances of multicollinearity problems. Though, with such a large pool observations this chance is quite limited.
Results in Table 4 enlighten the relationship of TS with CNC. Column (1) depicts the first regression regarding the overall period of analysis, 1976-2006. Our main focus of analysis is the interaction variable which in this regression shows a significant positive coefficient of 0,0325 (±0,0137). This means that at the average of CNC enforceability (3,49~3) the interaction effect of the enactment of the UTSA on the invention value (number of forward citations) is around 11,2%; and a change in 1 point of the enforceability of CNC of a given state which has the UTSA enacted has an interaction effect of approximately 3,25% on the invention value. These results confirm our initial expectation of the complementary relationship between these two legal tools since both affect positively each other.
Table 4. Invention Value Regressions (1)
Overall Period
(2)
Variance Overall Period
(3) >1990
VARIABLES Invention Value Invention Value Variance Invention Value
TS -0.0461 0.0108 0.0164 (0.0420) (0.0352) (0.0542) CNC 0.0258 -0.0678*** -0.00441 (0.0193) (0.0206) (0.0200) TSxCNC 0.0325** 0.0217*** 0.0506*** (0.0137) (0.00793) (0.0126) Log(R&D Expenditure) -0.000604 -0.0181 -0.0647 (0.0410) (0.0313) (0.0582) Log(employees) -0.110** -0.0706** -0.0855 (0.0414) (0.0280) (0.0732) Constant 2.497*** 1.583*** 3.001*** (0.234) (0.110) (0.378) Year Dummy Y Y Y State Dummy Y Y Y Observations 659,945 659,945 441,869 R-squared 0.315 0.035 0.377 Number of firms 4,294 4,294 3,233
Robust standard errors in parentheses *** p<0.01, ** p<0.05, * p<0.1
15 It was also performed a regression regarding the residuals of the first regression similarly to Fleming and Sorenson (2004). The purpose of this regression is to assess the impact of the usage of both legal tools on the invention value variance, which can be interpreted as R&D riskiness. We can observe that interaction effect is also significant and positive which means that the complementary protection increases the variance of e invention value. To be precise, the interaction effect causes an increase of 2,17% (±0,00793) in the variance of the invention value.
In other words, when firms are protected by both trade secrecy and covenants not to compete they undertake riskier R&D projects whose outcome is more unpredictable. Though, if you view these results in addition to the previously stated, you can conclude the effects of TS and CNC’s are complementary since, the usage of both, incentives firms to pursue riskier projects but with also more value.
Robustness Checks
In a large sample size, the differences-in-differences analysis may raise some questions since even small effects could show up as statistically significant. In order to address this problem, I replicated the analysis two times using different criteria to confirm my results.
Firstly, I replicated the analysis using a shorter period of analysis: 1990-2006 (Table 4. Column (3)).The reasons for this choice are basically because it reduces the number of observations and because it limits the period of analysis to be the same of Garmaise (2009).The findings were the same as the previous analysis. The interaction variable presented a positive and significant impact on the invention value, thus confirming the complementarity of TS and CNC.
16 Table 5. Firm level Regressions
Xtreg
VARIABLES Invention Value
TS -0.205 (-1.058) CNC -0.147 (0.499) TSxCNC 0.536* (0.288) R&D Expenditure -0.000437 (0.000881) Employees -0.0137*** (0.00501) Constant 15.50*** Year Dummy Y State Dummy N -1.803 Observations 26,217 R-squared 0.180 Number of gvkey 4,153 *** p<0.01, ** p<0.05, * p<0.1
Secondly, I collapsed the data at the firm and year level and replicated the analysis (Table 5. Column (1)). The regression reported the same results as the previous, with a significant and positive impact of the interaction on the invention value. On the other hand, the reduction in the sample caused a loss in the significance from p<0,001 to p>0,1 but the overall model continued to have a great adherence with the F-Test reporting a p<0,001.
17
Discussion &Conclusions
This study shows that trade secrecy and covenants not to compete jointly increase the expected value of inventions. Furthermore, the use of both legal tools also has a positive impact on the risk taking in R&D. Hence it is possible to say that covenants not to compete, together with trade secrecy, jointly lead firms to invest in riskier but also more valuable R&D projects.
The findings of this study are interesting for both policy makers and managerial practices. Both policy makers and managers should not focus on only one of these types of protection. Using both tools provide in fact firms with the protection necessary to invest in more risky but potentially more valuable innovations.
In this respect, similar to Conti (forthcoming), my results indicate that the enforcement and application of both legal tools could result in an increase of intrapreneurship since it provides companies “safe” grounds to pursue riskier R&D paths.
A limitation of this study regards the dependent variable, as I did not exclude self-citations. The inclusion of self-citations might reduce its part as invention value indicator since it is believed that they are an indicator of a patent unfitness to market (Sorenson, Stuart 2001). Another limitation regards the trade secrecy as independent variable. The Png (2011) chronology is a mere measure of state enactment though the UTSA (Samuel and Johnson 1990). However, this act could be enforced differently by different states, based on the common law principles. The Bureau of National Affairs has published a similar survey of Malsbergeret. al (2008) that could account for both statute and common law. It was not easy to codify though.
An underlying assumption of this study is that companies regarded in the sample indeed use trade secrecy and covenants not to compete to appropriate innovation. Then again, we can assume this is true. Almeling et al. (2010), Kaplan and Stromberg (2003) and Cohen et al. (2000) provide in fact strong evidence that companies use both trade secrecy and covenants not to compete, whenever possible.
Many interesting paths could be taken to complement this study and reinforce its findings. One interesting path would be to replicate the same study but with the inclusion of private companies. Private companies differ in their management
18 comparing to public companies being more often more daring and secretive. Indeed the ownership structure of a company might have directly influence its risk taking (Jensen and Meckling, 1976; May, 1995). By using both private and public companies the study could provide with a better understanding of the effect of trade secrecy and covenants not to compete interaction. I would expect that my results would be reinforced since private companies, due to lack of size, lack the complementary assets to exploit their inventions thus needing legal tools to appropriate returns (Cohen et. al 2000).
Another path for future research would be to focus on the joint effect of CNC and TS on entrepreneurship, analyzing whether they foster or inhibit both the creation and the survival of new firms. I believe this analysis would contribute greatly to the understanding the critical factors that enabled California’s Silicon Valley surpassing of Massachusetts Route 128 that has been much debated by scholars (Gilson, 1999; Hyde, 2003).
19
References
Acharya, Viral V., Ramin P. Baghai, and Krishnamurthy V. Subramanian, \Wrongful Dis-charge Laws and Innovation", Working Paper 1570663, SSRN, March 14, 2010. Agarwal R., Ganco M., Ziedonis RM. 2009. Reputations for toughness in patent enforcement: implications for knowledge spillover via inventor mobility. Strategic Management Journal 30: 1349-1374.
Albert MB, Avery D, Narin F, McAllister P. 1991. Direct validation of citation counts as indicators of industrially important patents. Research Policy 20: 251-259.
Almeida P., Kogut B. 1999. Localization of Knowledge and the Mobility of Engineers in Regional Networks.Management Science Vol. 45, No 7.
Almeida P., Dokko G., Rosenkopf L. 2003. Startup size and the mechanisms of external learning: increasing opportunity and decreasing ability?. Research Policy: 301-315. Almeling, David S., Darin W. Snyder, Michael Sapoznikow, Whitney E. McCollum, and Jill Weader, 2010.A Statistical Analysis of Trade Secret Litigation in Federal Courts, Gonzaga Law Review, Vol. 45 No. 2.
Arundel A. 2001. The relative effectiveness of patents and secrecy for appropriation.ResearchPolicy Vol. 30: 611-624.
Arundel A., KablaI. 1998. What percentage of innovations are patented? Empirical estimates for European firms. Research Policy Vol. 27: 127-141.
Bertrand M, Duflo E, Mullainathan S. 2004. How much should we trust differences-in-differences estimates? Quarterly Journal of Economics 119(1): 249-275.
Bessen J. 2009. Matching Patent Data to Compustat Firms, www.nber.org/ ~jbessen/matchdoc.pdf
Bone RG. 1998. A new look at trade secret law: Doctrine in Search of Justification. California Law ReviewVol. 86 No. 2: 241-314.
Cava A. 1990. Trade Secrets and Covenants not to compete: Beware of Winning the Battle but Losing the War. Journal of Small Business Management: October 1990 Ceccagnoli M., 2008. Appropriability, Preemption and Firm Performance. Strategic Management Journal 29: 0081-0098
Cohen MD, Nelson RR, Walsh JP. 2000. Protecting their intellectual assets: appropriability conditions and why U.S. manufacturing firms patent (or not). NBER working paper 7552, National Bureau of Economic Research, Cambridge, MA. Available at: http://www.nber.org/papers/w7552.
20 Conti R. forthcoming Do non-competition agreements lead firms to pursue path-breaking inventions? Strategic Management Journal.
Fisk CL. 2001Working Knowledge: Trade Secrets, Restrictive Covenants in Employment and the Rise of Corporate Intellectual Property. Harvard Law Journal Vol.52: 442-534
Fleming L., Sorenson O. 2004. Science as Map of Technological Search. Strategic Management Journal 25: 909-928.
Franco A, Mitchell MF. 2008. Covenants not to compete, labor mobility, and industry dynamics. Journal of Economics and Management Strategy 17 (3): 581-606.
Garmaise M. 2011. Ties that truly blind: non-competition agreements, executive compensation and firm investment. Journal of Law, Economics and Organization 27(2): 376-425.
Gilson R.J. 1999. The legal infrastructure of high technology industrial districts: Silicon Valley, Route 128, and covenants not to compete. New York University Law Review 74: 575-629.
Graves CT., Diboise JA. 2006. Do Strict and Non-Competition Laws Obstruct innovation? Entrepreneurial Business Law Jornal Vol1:2: 324-344.
Holley R. 1998. Looking at the legalities of non-compete agreements. Computer Reseller News 80, 139.
Hall BH, Jaffe AB, Trajtenberg M. 2001, The NBER patent citations data file: lessons, insights and methodological tools. NBER working paper 8498.
Harhoff D, Narin F, Scherer FM, Vopel K. 1999. Citation frequency and the value of patented inventions. Review of Economics and Statistics 81(3): 511-515
Hyde A. 2003. Working in Silicon Valley: Economic and Legal Analysis of a High-Velocity Labor.Armonk, NY: M.E. Sharpe.
Kaplan SN, Stromberg P. 2003. Financial contracting theory meets the real world: an empirical analysis of venture capital contracts. Review of Economic Studies 70: 281-315.
Lerner J. 2006Using Litigation to Understand Trade Secrets: A Preliminary Exploration. Working Paper 922520, SSRN,
Levin RC, Klevorick AK, Nelson RR, Winter SG, Gilbert R, Griliches Z. 1987. Appropriating the returns from industrial research and development; comments and discussion. Brookings Papers on Economic Activity 3: 783-831.
Lydon J.C. 1987. The Deterrent Effect of the Uniform Trade Secrets Act.Journal of Patent & Trademark Office Society Vol.69: 427-444.
21 Malsberger B. 2004, Covenants Not to Compete: A State-by-State Survey. BNA Books: Washington D.C.
Marx M, Singh J, Fleming L. 2011. Regional disadvantage? Non-competes and brain drain. INSEAD working paper.
Marx M, Strumsky D, Fleming L. 2009. Mobility, skills, and the Michigan non-compete experiment. Management Science 55: 875-889.
Motta M., Ronde T. 2002. Trade Secret Laws, labor mobility, and innovations.CEPR Discussion Paper No. 3615
Png2011. Law and Innovation: Evidence from the Uniform Trade Secrets Act. Working Paper, University of Singapore
Png 2012. Trade Secrets, Non-Competes, and Inventor Mobility: Empirical Evidence. Working Paper, University of Singapore
Samila S., Sorenson O. 2011. Non Compete Covenants: Incentives to Innovate or Impediments to Growth. Management Science Vol.57 No.3: 425-438.
Samuels L., Johnson B. 1991. The Uniform Trade Secrets Act: The State’s Response. Creighton Law Review Vol.24: 49-98.
Saxenian A. 1994, Regional Advantage: Culture and Competition in Silicon Valley and Route 128. Harvard University Press: Cambridge, MA.
Shaver JM, Flyer F. 2000. Agglomeration economies, firm heterogeneity, and foreign direct investment in the United States, Strategic Management Journal 21(12): 1175:1193.
Snowdon B., Vane H., Modern Macroeconomics Its Origins, Development and Current State, Edward Elgar, Northampton, MA 626-632
Thompson P. 2005. Patent citations and the geography of knowledge spillovers: a reassessment. American Economic Review 95(1): 450-460
Trajtenberg M. 1990. A penny for your quotes: patent citations and the value of innovations. RAND Journal of Economics 21: 172-187.
Zack, M.H. (1999), “Managing Codified Knowledge”. Sloan Management Review, 40 (4): 45-58
22
Appendix
Appendix 1.Questions and Thresholds to assess non-Competes Enforceability The list of questions and thresholds is taken by Garmaise (2009). Each state is granted onepoint for each question concerning which its laws lie above the threshold.
Question 1.Is there a state statute of general application that governs the enforceability of covenants not to compete?
Threshold 1.States with statutes that enforce non-competition agreements outside a sale-of-business context receive a score of one.
Question 2. What is an employer's protectable interest and how is it defined?
Threshold 2.States in which the employer can prevent the employee from future independent dealings with all the firm's customers,notmerely with the customers with whom the employee had direct contact, receive a score of one.
Question 3.What must the plaintiff be able to show to prove the existence of an enforceable covenant not to compete?
Threshold 3.Laws that place greater weight on the interests ofthe firm relative to those of the former employee are above the threshold. For example, a law that requires that the contract be reasonably protective of the firm's business interests and only meet the condition of not being unreasonably injurious to the employee's interests would receive ascore of one.
Question 4.Does the signing of a covenant not to compete at the inception of the employment relationship provide sufficient consideration to support the covenant? Threshold 4. States for which the answer to Question 4 is clearly "Yes" are above the threshold.
Question 5. Will a change in the terms and conditions of employment provide sufficientconsideration to support a covenant not to compete entered into after the employment relationship has begun? Threshold 5. States for which the answer to Question 5 is clearly "Yes" are above the threshold.
Question 6. Will continued employment provide sufficient consideration to support a covenant not to compete entered into after the employment relationship has begun? Threshold 6.States for which the answer to Question 6 is clearly "Yes" are above the threshold.
Question 7. What factors will the court consider in determining whether time and geographic restrictions in the covenant are reasonable?
23 Threshold 7.Jurisdictions in which courts are instructed not to consider economic or other hardships faced by the employee are above the threshold.
Question 8.Who has the burden of proving the reasonableness or unreasonableness of the covenant not to compete?
Threshold8. States in which the burden of proof is clearly placed on the employee are above the threshold.
Question 9.What type of time or geographic restrictions has the court found to be reasonable? Unreasonable?
Threshold 9.Jurisdictions in which three-year statewide restrictions have been upheld receive a score of one.
Question 10. If the restrictions in the covenant not to compete are unenforceable becausethey are overbroad, are the courts permitted to modify the covenant to make therestrictions more narrow and to make the covenants enforceable?
Threshold 10. States for which the answer to Question 10 is clearly "Yes" are above the threshold.
Question 11.If the employer terminates the employment relationship, is the covenant enforceable?
Threshold 11. States for which the answer to Question 11 is clearly "Yes" are above the threshold.
Question 12.What damages may an employer recover and from whom for breach of a covenant not to compete?
Threshold 12.If, in addition to lost profits, there is a potential for punitive damages against the former employee, the state receives a score of one. States that explicitly exclude consideration of the reasonableness of the contractfrom the calculation of damages are also above the threshold.
24
25