An Active Seismic Zone in Intraplate West Iberia Inferred
From High-Resolution Geophysical Data
Catarina Matos1 , Susana Custódio1 , Josep Batlló2, Jiˇrí Zahradník3 , Pierre Arroucau4,5 , Graça Silveira6 , and Sebastian Heimann7
1Instituto Dom Luiz, Faculdade de Ciências, Universidade de Lisboa, Lisbon, Portugal,2Institut Cartogràfic i Geològic
de Catalunya, Barcelona, Spain,3Faculty of Mathematics and Physics, Charles University, Prague, Czech Republic,
4Geophysics Section, School of Cosmic Physics, Dublin Institute for Advanced Studies, Dublin, Ireland,
5EDF-DIPNN-DI-TEGG, Aix-en-Provence, France,6Instituto Dom Luiz and Instituto Superior de Engenharia de Lisboa,
Lisbon, Portugal,7GFZ German Research Centre for Geosciences, Potsdam, Germany
Abstract
Intraplate Iberia is a region of slow lithopsheric deformation (<1 mm/yr) with significant historical earthquake activity. Recent high-quality instrumental data have shown that small-magnitude earthquakes collapse along clusters and lineaments, which however do not bear a clear relationship to geologically mapped active structures. In this article, we investigate the controls of these earthquake clusters. In particular, we study two of the identified clusters—the Arraiolos and the Évora seismic zones (ASZ and ESZ), located in the Western Ossa Morena Zone, southwest Iberia. The ASZ marks a sharp boundary between a seismically active region to its south and a more quiet region to its north. We revise historical earthquakes in order to clarify whether earthquake activity in the region is persistent. We use data from a local network to compute accurate epicenters, focal depth, focal mechanisms, and spatiotemporal clustering, thus characterizing ongoing small-scale fracturing. Finally, we analyze complementary data sets, including tomographic models, Global Navigation Satellite Systems data, magnetic anomalies, and gravity anomalies, in order to discuss the factors that control seismogenesis in the two seismic zones. Consistency between earthquake locations, focal mechanisms and Global Navigation Satellite Systems data suggests that the ASZ is an active right-lateral shear zone, which divides two blocks within the Western Ossa Morena Zone. The ESZ seems to localize microseismicity due to its granitic lithology. These results suggest that high-resolution geophysical data have the potential to reveal blocks with different seismogenic and rheological behaviors, which may be used to improve our understanding of fault systems and the assessment of earthquake hazard in slowly deforming regions.Plain Language Summary
Mainland Portugal is a region of slow lithospheric deformation. This means that changes in Earth’s outmost layer—the lithosphere—occur at very low rates (<1 mm/yr). In such environments, faults producing earthquakes are not easy to identify at the Earth’s surface, both because their evidence can be gradually erased by wind and water or simply because they do not reach the surface. Recent studies have shown that small earthquakes in mainland Portugal group together delineating seismically more active regions. In this article we focus in two particular groups of earthquakes—the Arraiolos and the Évora seismic zones (ASZ and ESZ) and we investigate why they occur in these particular locations. We obtain precise maps of earthquake epicenters. When possible, we also analyze the direction of slip during the earthquake and the orientation of the fracture on which it occurred. We compare our results with other data sets, such as images of the Earth’s interior, that could give hints about the constitution of crust beneath the ASZ and the ESZ. Earthquakes epicenters show fault sections at depth in the ASZ. These faults separate two crustal blocks with distinct material properties. In the ESZ earthquakes are associated to contrasts in crustal materials.1. Introduction
The seismogenic potential of active faults and seismic source zones is a basal input to seismic hazard assessment. Its characterization relies chiefly on earthquake catalogs—both instrumental and historical (e.g., Cornell, 1968; Frankel, 1995; Vilanova & Fonseca, 2007; Wiemer et al., 2009), geomorphological and
RESEARCH ARTICLE
10.1002/2017JB015114
Key Points:
• Historical and instrumental seismicity and GNSS data reveal an active shear zone in intraplate Iberia
• The localization of deformation is controlled by a crustal boundary and rheological contrasts between plutons and host rock
• Our results suggest that the detailed analysis of small earthquakes has the potential to image active faults in regions of slow deformation
Supporting Information: • Supporting Information S1 • Data Set S1 Correspondence to: C. Matos, cpomatos@fc.ul.pt Citation:
Matos, C., Custódio, S., Batlló, J., Zahradník, J., Arroucau, P., Silveira, G., & Heimann, S. (2018). An active seismic zone in intraplate west Iberia inferred from high-resolution geophysical data. Journal of Geophysical Research:
Solid Earth, 123, 2885–2907.
https://doi.org/10.1002/2017JB015114
Received 17 OCT 2017 Accepted 7 FEB 2018
Accepted article online 12 FEB 2018 Published online 16 APR 2018 Corrected 4 MAY 2018
This article was corrected on 4 MAY 2018. See the end of the full text for details.
©2018. American Geophysical Union. All Rights Reserved.
paleoseismic evidence (e.g., Camelbeeck & Meghraoui, 1998; Canora et al., 2015; Meghraoui et al., 2001; Wesnousky et al., 1984), seismotectonic domains—large structural domains that encompass regions with similar faulting styles (e.g., Lavecchia et al., 2002; Meletti et al., 2000; Phuong, 1991; Vilanova et al., 2014) and geodetic data (e.g., Camelbeeck & Meghraoui, 1998; Mazzotti & Townend, 2010; Newman et al., 1999; Prescott et al., 1981).
In regions of fast-moving faults (i.e., faults that slip at rates>10 mm/yr), earthquake epicenters typically align over fault traces (e.g., Hauksson et al., 2012; Pesicek et al., 2010; Qiu et al., 2017), geomorphology shows dis-tinctly the surface traces of faults (e.g., Arrowsmith & Zielke, 2009; Chevalier et al., 2016), paleoseismological studies allow the quantification of the amount of slip in, and timing of, past earthquakes (e.g., Goldfinger et al., 2007; Natawidjaja et al., 2006), and geodesy data records present-day strain rates across faults (e.g., Calais et al., 2002; Kahle et al., 2000; Spinler et al., 2010). In turn, the characterization of faults that slip at low rates is more challenging: Earthquake catalogs capture only a very brief period of the earthquake cycle, which may not be representative of the long-term processes at work. Changes to the landscape created by active faults can be very subtle and become quickly overprinted by erosion and sedimentation. Surface deformation may be too low to generate a signal discernible by recording geodetic networks. Adding to the above challenges, litho-spheric deformation that occurs at low rates is often accommodated by complex fault networks that extend across broad regions (e.g., Ahorner, 1975; Brocher et al., 2017; Buforn et al., 1995; Talwani, 2016; Villasenor et al., 2001), which tend to be more sparsely observed than regions of fast deformation. All together, these limitations result in a severe underobservation of slowly deforming regions (SDRs, i.e., regions deforming at rates<2 mm/yr).
Although high-magnitude earthquakes in SDRs are rare, low-magnitude earthquakes are often abundant and might be a valuable source of information—if correctly decoded. The seismicity observed in SDRs is often described as diffuse (Borges et al., 2001; Crone et al., 1985; Sartori et al., 1994). However, several studies have shown that this apparently diffuse pattern is often a consequence of the poor quality of earthquake catalogs (Chiu et al., 1992; Custódio et al., 2015; Sherburn & White, 2005). When relocated with high-quality data sets, a significant portion of epicenters collapses into well-defined seismic clusters and lineaments. The seismicity of these regions may be considered diffuse only in the sense that deformation is accommodated by complex fault networks (e.g., Bowman et al., 1990; Camelbeeck et al., 2007; Gagnepain-Beyneix et al., 1982; Terrinha et al., 2009; Tuttle et al., 2002). Whether the seismic clusters and lineaments of low-magnitude earthquakes mark potentially active and hazardous seismic zones remains a conspicuous open question.
Western (W) Iberia, located on the southwestern (SW) tip of Europe, is a region of slow lithospheric defor-mation that has unleashed some of the highest-magnitude earthquakes in the European historical record (Stich et al., 2005; Stucchi et al., 2013; Vilanova & Fonseca, 2007). Destructive events are documented both on the onshore intraplate domain and on the offshore diffuse plate boundary domain. Custódio et al. (2015) analyzed the Portuguese instrumental earthquake catalog (1961–2013) and showed that low-magnitude earthquakes cluster along seismic belts oriented mostly NNE-SSW and WNW-ESE, both onshore and offshore. The relationship between many of these seismic belts and geologically mapped faults remained unclear. Several hypotheses can be thought of to explain the low-magnitude earthquake locations and their mismatch with respect to geologically mapped structures (Custódio et al., 2016):
1. Small earthquakes mark rheological boundaries that localize stress due to contrasts in elastic properties. However, these boundaries do not correspond to active faults in the sense that they do not accumulate significant slip over time.
2. Small earthquakes occur inside blocks that are weaker than neighboring blocks, therefore break more easily, accommodating deformation on distributed, small, new fractures.
3. Small earthquakes mark the terminations or other geometrical or frictional heterogeneities of major active faults.
4. Geologically mapped faults are currently locked, slipping aseismically, or not currently active, thus not generating microseismicity.
5. Small earthquakes mark active faults that slip at very low rates. Therefore, they barely generate a geomor-phological signature and surface deformation is below detection level.
In this article we study in detail low-magnitude earthquake clusters in central Portugal, west Iberia. In par-ticular, we focus on the Arraiolos seismic zone (ASZ) and on the Évora seismic zone (ESZ), both located in the Western Ossa Morena zone (WOMZ). In particular, we (1) evaluate the historical seismicity of the region,
(2) relocate high-quality earthquake data for 2011–2012, (3) estimate the Gutenberg-Richter b value, (4) compute focal mechanisms, and (5) evaluate the spatial and (6) temporal clustering of earthquakes. We then discuss surface deformation in the region, as imaged by satellite geodesy data, and the relation-ship between earthquake activity and Earth structure at depth. We finally discuss our results in terms of implications for local active tectonics and seismic hazard assessment.
2. Seismotectonic Framework and Geological Inheritance
The center of Iberia lies ∼400 km north of the plate boundary that separates Eurasia from Nubia (Figure 1a). Locally, the two plates converge obliquely at a rate of 4–5 mm/yr, with convergence oriented WNW-ESE (Nocquet, 2012, and references therein). The convergence is mostly accommodated along a broad, ∼300 km wide seismic belt that has been classically described as a diffuse plate boundary (Buforn et al., 1995; McKenzie, 1972; Sartori et al., 1994). Early satellite geodesy data showed that Iberia was mostly fixed with respect to sta-ble Eurasia (Fernandes et al., 2007; Nocquet & Calais, 2004). However, a recent analysis of improved geodetic data has suggested that Iberia rotates clockwise with respect to stable Eurasia at a low but detectable rate of 0.07∘/Myr (Palano et al., 2015).
Because the continental crust of W Iberia was not deformed by major Mesozoic or Cenozoic orogenies, Neogene rifting, volcanism or convergence, and is not crossed by major plate boundaries, it has been con-sidered a stable continental region (Johnston, 1989; Vilanova & Fonseca, 2007). Nevertheless, a number of destructive earthquakes have affected the region throughout time, including the 1531 M6.9 ± 0.3 Lower Tagus Valley earthquake, the 1858 M7.1 ± 0.3 Setúbal earthquake, and the M6 ± 0.2 1909 Benavente earthquake (Figure 1a) (Johnston, 1996a, 1996b; Locati et al., 2014; Stich et al., 2005; Stucchi et al., 2013).
Figure 1a shows the distribution of earthquakes in W Iberia. We display the epicenters of earthquakes with M≥ 4, divided according to observation period: The epicenters of earthquakes that occurred from 1146 to 1899 rely on macroseismic data (Stucchi et al., 2013). These locations are likely biased by the noncompleteness of the historical record. Epicenters in the 1900–1968 period result from a mix of instrumental and macro-seismic data and have variable quality (Grünthal & Wahlström, 2012, and references therein). Epicenters from 1969 to the present rely on instrumental data and are the most accurate. Figure 1 also shows the epicenters of earthquakes of all magnitudes recorded between 1969 and 2016 (small black dots, Carrilho et al., 2004), which collapse into clear clusters and lineaments (Custódio et al., 2015). An ML4.9 earthquake that occurred
in 15 January 2018, during the revision of this article, is plotted with a red star. This is the highest-magnitude earthquake that occurred in the study region in the instrumental record.
Most earthquakes in NW Iberia correlate well with major mapped faults, whereas to the south the associa-tion of epicenters with mapped faults becomes less clear (Custódio et al., 2015; Veludo et al., 2017). A sharp transition in both epicenter density and cumulative seismic moment—marked with a thick dashed line in Figure 1a—is visible around 39∘N in the WOMZ (Custódio et al., 2015). Earthquakes directly south of this boundary form two earthquake clusters (Figure 1b): The ASZ, where epicenters outline a narrow, 100 km long, WNW-ESE oriented seismic belt; and the ESZ, where epicenters extend along a broader region. The national earthquake catalog indicates mostly shallow focal depths (<15 km) (Figure 1b).
W Iberia is composed of four distinct tectonic domains assembled during the Paleozoic amalgama-tion of Pangea, at the western end of the Variscan orogeny (e.g., Ribeiro et al., 1990) (Figure 1c): The Galicia-Trás-os-Montes zone (GTMZ) is the northernmost domain and has a peri-Gondwanan origin (e.g., Gutiérrez Marco et al., 1990). To its south, the Central Iberian zone (CIZ) and the Ossa Morena zone (OMZ) are thought to have belonged to the northern Gondwana margin (e.g., Gutiérrez-Alonso et al., 2008; Quesada, 1991). Finally, the southerly South Portuguese zone (SPZ) is interpreted as part of Avalonia.
Figure 1c shows that to the north and to the west, the OMZ is bounded by two major Variscan fracture zones: the Tomar-Badajoz-Cordoba (TBCSZ) and the Porto-Tomar-Ferreira do Alentejo shear zones (PTFASZ), respectively (Burg et al., 1981; Pereira et al., 2010; Ribeiro et al., 1980, 1990). To the south, the Beja-Acebuches ophiolite marks the transition between the OMZ and the SPZ (Dallmeyer et al., 1993; Fonseca & Ribeiro, 1993; Quesada, 1991; Ribeiro et al., 2010).
The evolution of the OMZ is tied to the geological processes that formed Pangea. During the Carboniferous, after the collision between Gondwana and Laurussia, sedimentary basins developed within the OMZ (e.g., Eguiluz et al., 2000; Pereira et al., 2009). They formed in an extensional regime and were accompanied
Figure 1. Maps of W Iberia: (a) Significant earthquakes (M≥ 4): green = 1146–1899 (Stucchi et al., 2013); purple = 1900–1968 (Grünthal & Wahlström, 2012); cyan = 1969–2016 (Carrilho et al., 2004; Custódio et al., 2015). Major earthquakes discussed in the text are identified with date and magnitude. TheML4.9 15 January 2018 earthquake is plotted with a red star (IPMA, 2018). The thick dashed line separates regions with distinct levels of seismic activity. Topography from Jarvis et al. (2008). In panels (a), (c), (d), and (e) the epicenters of earthquakes of all magnitudes recorded between 1969 and 2016 (Carrilho et al., 2004; Custódio et al., 2015), with an azimuthal gap<180∘,
are displayed as small black dots. Those with larger azimuthal gap are shown as gray dots in panel (a). The surface traces of neotectonic faults (Cabral, 2012) and of potentially active faults identified in the SHARE database (Basili et al., 2013) are shown in black and white. The study area is delimited by the black rectangle. (b) Distribution of epicenters within the study area (azimuthal gap<180∘, color coded by focal depth) recorded by the permanent seismic network (green triangles) in the period 1969–2016. Dashed lines delimit the Arraiolos Seismic Zone (ASZ). Dashed circle outlines the more diffuse Évora Seismic Zone (ESZ). Black lines outline neotectonic faults: LTV = Lower Tagus Valley; PS = Ponte de Sôr; SO = Serra da Osssa; Cib = Ciborro; Mess = Messejana; VM = Vidigueira-Moura; Torr = Torrão; SSSZ = Santa Susana Shear Zone; Gran = Grândola. White dots mark towns and villages. (c) Simplified geologic units (after Rodriguez Fernández, 2004). Dashed black lines delineate the geotectonic units: GTMZ = Galicia-Trás-os-Montes Zone;
CIZ = Central Iberian Zone; OMZ = Ossa Morena Zone, and SPZ = South Portuguese Zone. The major geological features that limit the OMZ are the Tomar-Badajoz-Cordoba shear zone (TBCSZ), the Porto-Tomar-Ferreira do Alentejo shear zone (PTFASZ), and the Beja-Acebuches ophiolite (BAO). The white dashed line delimits the Évora Massif. (d) Magnetic anomalies (Miranda et al., 1989). (e) Gravity anomalies (Sandwell et al., 2014).
by deep crustal metamorphism and emplacement of voluminous magmatism (Giese & Bühn, 1994; Mata & Munhá, 1990; Pereira et al., 2015; Sánchez-Garcıa et al., 2003). The IBERSEIS deep reflection profile (Carbonell et al., 2004; Simancas et al., 2003), wide angle transects (Palomeras et al., 2009), petrophysical analysis (Brown et al., 2012), and geophysical modeling (Palomeras et al., 2011) suggest that Carboniferous magmatism is responsible for the emplacement of a large amount of magma at midcrustal depths (12–14 km) in the region. Most outcropping rocks in the ASZ and ESZ are part of the Évora Massif (Fernández et al., 2017; Pereira et al., 2007), a metamorphic dome mainly composed of gneisses, migmatites, schists, amphibo-lites, and minor gabbros and diorites (Figure 1c). This metamorphic complex is contemporaneous with the emplacement of igneous rocks, including calc-alkaline felsic and mafic magmas represented by outcropping plutons of tonalites, gabbros, diorites, granodiorites, and granites (Pereira et al., 2015). Toward the west, the region is covered by the recent Cenozoic sediments of the Tagus and Sado river basins.
The OMZ displays a complex pattern of magnetic and gravity anomalies, which together with outcropping rocks suggest a heterogeneous crust (Figures 1d and 1e). Most small wavelength (<10 km) and medium amplitude (∼100 nT) magnetic anomalies in the OMZ trend N125∘E and are associated with gabbro-dioritic complexes (Miranda et al., 1989). The coincidence between low gravity and low magnetic anomalies is some-times used to identify granitic intrusions (e.g., Wang et al., 2013). Earthquakes in the study region occur preferentially along low magnetic (−70 nT to 0 nT) and gravity anomalies (20 to 60 mGal), suggesting a lithological control of igneous and metamorphic blocks on the localization of earthquakes(Figures 1d and 1e). Mapped neotectonic faults (<2.6 Ma, Cabral, 1995, 2012) in the WOMZ include the Lower Tagus Valley, Ponte de Sôr, Serra da Ossa, Ciborro, Messejana, Vidigueira-Moura, Torrão and Grândola faults, and the Santa Susana shear zone (Figure 1b). Of all these faults, only the Lower Tagus Valley and Vidigueira-Moura faults have been convincingly documented as potentially active (Basili et al., 2013; Canora et al., 2015; da Silveira et al., 2009). The Messejana fault (also known as Alentejo-Plasencia or Odemira-Ávila) is a major tectonic structure of Iberia, whose geomorphology suggests left-lateral strike-slip motion (e.g., Villamor et al., 2012). It is still debated whether the fault is currently active, and if so, along which segments (Basili et al., 2013; Villamor et al., 2012). Interestingly, in our study region, the Messejana fault seems to separate a region of lower seismic activity, to its SE, from a region of higher seismic activity, to its NW. The latter encompasses the ASZ and the ESZ (Figure 1b). Detailed geological mapping of the WOMZ (e.g., Carvalhosa, 1999; Zbyszewski et al., 1979, 1980) shows the existence of several contact faults between different lithologies. In particular, the Ciborro fault marks the contact between granites and sedimentary rocks of the Tagus basin (Zbyszewski et al., 1979, 1980) and has been associated with alignments of earthquakes with the same direction (Araújo et al., 2010; Pereira et al., 2014; Veludo et al., 2017). Many other contact faults exist in the region, both at the boundary between plu-tons and host rock and inside pluplu-tons. Lima et al. (2012) suggested that some of the pluplu-tons emplaced in the WOMZ grew by injection of multiple magma batches with distinct compositions, with contact faults bordering geologic units originated in distinct magma pulses.
In spite of the many structures mapped in the region, a clear relationship between the ASZ or the ESZ and the surface traces of mapped neotectonic faults, potentially active faults, or contact faults does not exist (Figure 1b).
3. Active Seismicity of the Western Ossa Morena Zone
3.1. Historical and Early Instrumental Earthquake CatalogWe reviewed the locations of earthquakes that occurred inside the study region in the historical (1568–1899) and early instrumental (1900–1960) periods (Figure 2). We started by considering events reported in sev-eral regional catalogs: Choffat and Bensaúde (1912), Pereira de Sousa (1914), Oliveira (1986), Martínez Solares and Mezcua (2002), Grünthal and Wahlström (2012), and Stucchi et al. (2013). We further considered the macroseismic intensity database of Portugal (Batlló et al., 2012). We revised the historical seismicity as fol-lows: (i) Merging of catalogs. We merged all catalogs, assigning to each reported solution a different ID. (ii) Identification and removal of fake events. We removed fake events by cross-checking existing catalogs with the macroseismic intensity database of Portugal. When possible, we consulted additional historical docu-ments. (iii) Identification and merging of duplicate events. We identified solutions concerning the same events and merged them into one same ID. (iv) Relocation of historical events. When enough intensity data points were available, we relocated the earthquakes. We used the macroseismic location algorithm BOXER (Gasperini et al., 1999) and the attenuation law proposed by Gomez-Capera et al. (2015) for stable continental regions.
Figure 2. Revised historical earthquake catalog for the Western Ossa Morena zone. Circles show the epicenters of
earthquakes, color coded according to their quality. Blue ellipses show uncertainties of locations obtained in this study. Dashed lines delimit the Arraiolos Seismic Zone (ASZ) and the Évora Seismic Zone (ESZ).
(v) Removal of events located inside the study region but with epicenter at its edges. Such events include the M7.1 1858 Setúbal earthquake, the M6 1909 Benavente earthquake, and their numerous aftershocks (Figure 1a), which are clearly unrelated to the seismic zones studied in this work. (vi) Assessment of epicen-ter quality. We assessed the quality of earthquake locations by taking into account the number of available intensity data points. Text S1 in the supporting information describes in detail how the quality scores were attributed. Table S1, available as supporting information, shows the revised earthquake catalog, with epicen-ters classified from A (high quality) to D (poor quality). When available, we keep the magnitude reported in the original catalogs, which is based on empirical relationships between magnitude and maximum observed intensity—Imax(original relationships are reported in the catalogs’ description).
Earthquakes that occurred before 1900 are poorly documented; therefore, their epicenters are poorly con-strained. The most poorly documented earthquake in the study region occurred on 27 November 1791. Two locations are reported for this event: one in Beja (Oliveira, 1986) and the other offshore SW Portugal (Martínez Solares & Mezcua, 2002). De la Torre (1997) discusses the available data and the inferred locations, showing arguments in favor and against both solutions. The low population density in the region and its uneven distri-bution makes the location of moderate-magnitude events problematic. According to our revision procedure, we assigned a quality D to the location of this event.
The three earthquakes that were relocated in the current study were assigned quality A. They were located based on 8–63 intensity data points, and epicentral errors range between 13 and 38 km.
The revision of the historical catalog shows that earthquakes of moderate magnitude (M< 5.5) have occurred throughout the historical period (1568–1958) in the study region. However, the limited data quality does not permit assigning earthquakes to specific locations (e.g., ASZ, ESZ, particular faults, or specific structures). 3.2. High-Resolution Instrumental Earthquake Catalog
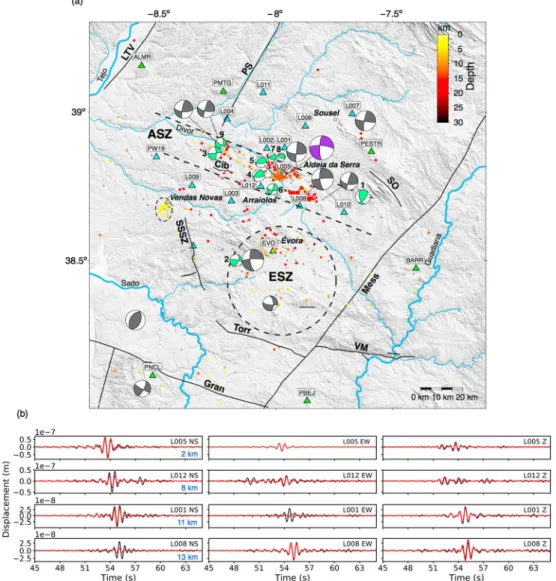
A local broadband array was deployed in the WOMZ for 16 months, between June 2011 and September 2012, in the scope of the Deep Ocean Test ARray (DOCTAR) experiment (Figure 3a). In order to improve data coverage
Figure 3. (a) Earthquake locations and focal mechanisms obtained using the Deep Ocean Test Array data
(blue triangles). Shown epicenters were obtained using the PRISM3D model. Earthquakes well located, that is, events belonging to classes A and B, are color coded according to focal depth. Earthquakes in class C are shown as gray dots. Major and minor rivers are shown as blue lines. Neotectonic faults are also shown (Cabral, 2012). Dashed contours mark the Arraiolos Seismic Zone (ASZ) and the Évora Seismic Zone (ESZ). Gray beachballs display regional focal mechanism solutions (Custódio et al., 2016). Green beachballs are events whose focal mechanisms were calculated in this study and are numbered according to the event ID (see Table 1). The purple focal mechanism is that of the recentML4.9, 15 January 2018 earthquake (IPMA, 2018). Beachballs are scaled according toMw. In order to facilitate the visualization, green beach balls are scaled to 120% of itsMw. (b) Fit between observed (black) and synthetic (red) displacement waveforms for event number 5. Note that the signal that is modeled is composed essentially ofSwaves. We used stations in the epicentral distance range of 2–13 km (blue numbers). The EW component of L005 station was removed from inversion due to instrumental disturbances. The global variance reduction for this inversion is 0.53.
at the edges of the study area, we complemented the data set with data recorded by nearby permanent and temporary stations. We continuously scanned waveforms, searching for very low amplitude signals coherent across the network (López-Comino, Cesca, Heimann et al., 2017; López-Comino, Cesca, Kriegerowski et al., 2017; Matos et al., 2016). Preliminary locations were then computed using LOKI, a waveform-based earthquake locator (Grigoli et al., 2013, 2014).
The DOCTAR array data have an excellent signal-to-noise ratio. Seismograms of local earthquakes show clear high-frequency P and S waves. The high signal-to-noise ratio is likely a consequence of wave propagation in an area of low seismic attenuation (Q0> 275) (Noriega et al., 2015). Figure S2b, available as supporting information, shows vertical ground motion recorded during a Mw 2.0 earthquake, located in the center
Ta b le 1 Fo ca lM echanisms S olutions O b tained b y Full W a ve form In version Dat e b OT c La t d Lo n e D f Fr e q h CD j Stk/Dip/R k k Stk/Dip/R k k %D C l ID a yyyy /m m /d d h h :m m :s s (d e g ) (d e g ) (km ) ML g (H z) Mw i (k m) (deg/deg/deg) (deg/deg/deg) (deg) V R m CN n FM V a r o PA p 1 2012/7/13 13:54:08.54 38.72 − 7.63 15.2 2.7 1.0 – 2.0 2.4 17.8 162/48/43 40/60/129 64.3 0.30 6.5 5 ± 27 /1 2 2011/12/25 15:01:21.22 38.50 − 8.18 8.3 2.3 1.0 – 2.0 2.0 13.0 18/54/12 281/81/144 60.5 0.44 2.9 3 ± 2 14/1 3 2011/11/1 18:23:41.48 38.86 − 8.26 8.8 2.0 1.0 – 2.0 2.2 10.9 86/90/ − 164 355/74/0 77.4 0.33 7.2 3 ± 1 14/0 4 2011/12/19 16:45:20.28 38.78 − 7.98 12.8 2.0 1.0 – 2.0 2.0 13.6 89/66/120 214/37/41 89.1 0.55 2.8 4 ± 3 15/0 5 2011/9/2 16:58:51.84 38.78 − 7.98 12.7 1.8 1.0 – 2.0 1.9 13.4 88/64/116 220/36/48 69.5 0.53 2.7 5 ± 3 11/0 6 2012/5/28 14:37:14.84 38.74 − 8.01 19.8 1.8 1.0 – 2.0 1.8 19.2 13/85/ − 20 105/70/ − 175 97.8 0.26 3.5 4 ± 3 10/0 7 2012/4/13 20:26:37.54 38.78 − 7.99 12.3 1.2 1.7 – 2.6 1.5 15.3 115/53/130 241/52/49 75.7 0.29 2.8 5 ± 39 /0 8 2011/9/24 01:56:31.60 38.78 − 7.98 12.9 1.0 1.5 – 2.6 1.3 13.0 241/52/49 289/25/87 65.9 0.44 3.8 7 ± 45 /0 9 2011/9/22 17:42:30.45 38.89 − 8.23 23.3 1.5 1.5 – 2.5 1.8 26.0 19/54/ − 21 121/73/ − 142 90.6 0.45 3.1 14 ± 23 8/0 aEar thquake number . bEar thquake dat e . cCat a lo g o ri gi n ti m e . dC a talog la titude . eC a talog long itude . fC a talog focal depth. gLo cal m ag nitude . hFr equenc y range used in the w a v ef or m in v er-sion. iM o ment m ag nitude . jC e ntr oid depth. kStrike ,dip ,and rake o f p ossible fault planes . lDouble co uple per cen tage . mV a rianc e reduc tion. nC o ndition number . oFo cal mechanism variabilit y index. pP o lar it y ag reement (polar ities w e ll fitt ed/unfitt e d p olar ities).
of the array, at a depth of 12.8 km. Clear P and S waves can be seen at almost all stations. Only station PW19, deployed on the Tagus-Sado basin, shows less evident arrivals, suggesting that a 3-D velocity model is needed in order to properly model wave propagation in the basin.
We used the nonlinear probabilistic formulation for earthquake location implemented in the NonLinLoc soft-ware to obtain a high-resolution earthquake catalog (Lomax et al., 2000). NonLinLoc allows the use of both one-dimensional (1-D) and three-dimensional (3-D) velocity models and yields an uncertainty estimation of the hypocentral parameters, expressed as a probability density function (PDF) on the model space. We adopted the Oct-Tree 3-D global search algorithm (Lomax & Curtis, 2001) in order to search for the opti-mal hypocentral parameters. Hypocenter locations reported in this article are the most likely value of the hypocenter, that is, the PDF maximum value.
We located earthquakes using two different velocity models: The IGN1D model (Custódio et al., 2015) and the 3-D Preliminary Reference Iberia Seismic Model (PRISM3D) (Arroucau et al., 2017). The IGN1D model is operationally used by Instituto Português do Mar e da Atmosfera (IPMA) to locate earthquakes in mainland Portugal (Custódio et al., 2015). The model assumes a layered VPstructure and a constant ratio between P wave
and S wave velocities (VP∕VS). The Wadati diagram based on the DOCTAR catalog indicates that VP∕VS= 1.69. Based on receiver function analysis, Dündar et al. (2016) found an average VP∕VSratio of 1.70 for stations in the WOMZ. The good agreement between the two results indicates a crust mainly composed of quartz-rich rocks (Lowry & Pérez-Gussinyé, 2011), in agreement with outcropping granitic rocks.
PRISM3D is a three-dimensional P and S wave model for Iberia and north Africa based on several previously published geophysical models (Arroucau et al., 2017). In particular, the lithospheric structure of western Iberia in PRISM3D is a weighted average of the tomographic models of Monna et al. (2013), Bezada et al. (2014), Chevrot, Villaseñor et al. (2014), Silveira et al. (2016), Palomeras et al. (2017), and Veludo et al. (2017). The Moho geometry is inferred from receiver functions (Chevrot, Sylvander et al., 2014; Chevrot, Villaseñor et al., 2014; Dündar et al., 2016; Mancilla & Diaz, 2015; Salah et al., 2011) and seismic active source studies (Afilhado et al., 2008; Díaz & Gallart, 2009; Martínez-Loriente et al., 2014; Sallarès et al., 2013). Both the 1-D and 3-D velocity models are shown in Figure S1.
We located all earthquakes for which we had both a P and an S wave arrival time at a minimum of three stations. Figure S2a, available as supporting information, compares the epicentral locations obtained with the two velocity models. As expected, the epicenters of earthquakes inside the network do not depend strongly on velocity model. The epicenters of earthquakes on the edges of the network show differences of up to ∼10 km, with the PRISM3D model pulling the epicenters toward the center of the network. Within the ASZ, a region that is very well covered by the DOCTAR array, the distance between the two solutions is minimum. We follow the approach of Husen and Smith (2004) to assess the quality of the hypocenters and conclude that those obtained with the 3-D velocity model are more robust. Therefore, we adopt them as our final earthquake locations. Finally, we classified the hypocenter locations obtained with PRISM3D in three quality classes (from A = excellent to C = poor) (details on the procedure can be found on Text S2).
Several mines and quarries operate in our study region, generating seismic signals that can easily be mistaken for earthquakes. We investigated the locations of shallow events (<1 km) using satellite imagery and discarded events within ∼500 m of evident quarries. A persistent cluster of shallow earthquakes near Vendas Novas may be associated to human activity (Figure 3a). However, time-of-day analysis and visual inspection of waveforms did not allow a clear conclusion concerning the origin of these events. Thus, we did not remove them from the catalog. Our final catalog comprises a total of 531 earthquakes.
Focal depth distribution is an important indicator of lithospheric strength (Albaric et al., 2009; Maggi et al., 2000; Watts & Burov, 2003). Nevertheless, earthquake depth is the most difficult hypocentral parameter to constrain (e.g., Bormann et al., 2013; Gomberg et al., 1990). Precise focal depths can be determined when phases with a large takeoff angle, that is, phases recorded at small epicentral distances are used. Most earth-quakes within the ASZ were recorded by at least one nearby station, thus providing an unprecedented control on focal depths in this region.
Figure 3a shows our final earthquake locations, with quality A and B events color coded according to focal depth. The densest concentration of earthquakes is observed in the ASZ, directly south of Aldeia da Serra. Most earthquakes in this area occur at midcrustal depths, around 12 km. The deepest earthquakes, between 15 and 20 km, are located to the east of Arraiolos and illuminate two active patches. Earthquake locations in the NW
section of the ASZ are not as clearly clustered; however, they might follow the Divor river tributary streams. Earthquakes in the ESZ occur at a wide range of depths and their epicenters do not cluster tightly. The ESZ seems to be delimited by major fault systems, including the Messejana fault, Torrão fault, and the Santa Susana shear zone. These locations confirm the spatial overlap between earthquake epicenters in the WOMZ and the Évora massif (Figure 1c). In spite of the excellent network coverage during the DOCTAR experiment, almost no earthquakes were detected north of the ASZ. This confirms that the ASZ is a sharp boundary between a seismically active region to its south and a seismically silent region to its north, a feature that seems to persist also in the historical period (Figure 1a).
The b value of the Gutenberg-Richter law assesses the proportion of low-magnitude to high-magnitude earth-quakes. Regions where earthquakes result from tectonic stresses typically display b ≈ 1 values (El-Isa & Eaton, 2014; Kagan, 1999; Okal & Sweet, 2007). High b values typically result from faulting associated with pore pres-sure changes (e.g., Bachmann et al., 2012) and tend to occur near active magma chambers (Wiemer & McNutt, 1997), subduction zones (Wiemer & Benoit, 1996), and induced seismicity sites (Bachmann et al., 2012). We estimated the b value for the WOMZ using the b value stability method, as implemented in the SEDA toolbox (Lombardi, 2017; Woessner & Wiemer, 2005). We found a value close to 1.0, suggesting a tectonic origin for earthquakes in the region (see Text S3).
3.3. Focal Mechanisms
We computed focal mechanisms for earthquakes in the WOMZ by full waveform moment tensor inversion, taking advantage of the high-quality local seismic data. We selected for inversion all earthquakes with ML> 1.5
and a few other lower-magnitude events advantageously located in the center of the network. We modeled waveforms between frequencies of at least 1 Hz and at most 2.6 Hz. Although moment tensor inversions can be successfully constrained by data recorded at a single three-component station, when the velocity model is accurate enough (Dreger & Helmberger, 1993; Fan & Wallace, 1991; Zahradník & Custódio, 2012), we used a minimum of two stations with azimuths differing by at least 90∘.
We used the ISOLA software to compute moment tensor inversion (Sokos & Zahradnik, 2008). ISOLA calcu-lates the moment tensor by minimizing the differences between observed and synthetic waveforms in a least squares sense, while centroid depth and origin time are grid searched. Green’s functions were calculated with the discrete wave number method of Bouchon (1981), using as input the IGN1D velocity model (Figure S1a, available as supporting information). Centroid depth was first grid searched in steps of 1 km in a range of 5 km around the hypocenter depth and then refined in an interval of 4 km around the previously inferred depth in steps of 0.2 km.
Figure 3b shows the waveform fit of a Mw1.9 earthquake in Aldeia da Serra (2 September 2011). The S wave pulse is the most prominent signal in the modeled 1–2 Hz frequency range. The use of near-source data may easily bias the inversion if the initial catalog location is not accurate enough or if waveforms contain instru-mental artifacts, such as electronic noise or long-period disturbances (Zahradník & Plešinger, 2010). Therefore, we carefully checked all waveforms and removed those displaying such effects. In particular, in this example, the EW component of station L005 was discarded due to a long-period instrumental disturbance. In general, we observed clear and simple waveforms at frequencies up to ∼2.5 Hz at stations located at<30 km from the epicenter.
Figure 3a and Table 1 summarize the results obtained for the nine earthquakes successfully modeled. Most are located within the DOCTAR network. They have moment magnitudes Mwbetween 1.3 and 2.4 and centroid
depths between 10.9 km and 26 km. In order to investigate the robustness of the solutions, we assessed the double-couple percentage (%DC), condition number (CN), variance reduction (VR) normalized by the number of used stations, and focal mechanism variability (FMVar) (Sokos & Zahradník, 2013). Details on the assess-ment of focal mechanisms quality are provided in Text S4. We further verified the polarity agreeassess-ment (PA), that is, the agreement between observed P wave polarities and the focal mechanism inferred from moment tensor inversion. P wave polarities were observed at 5–15 stations, and the vast majority matched the focal mechanisms inferred from moment tensor inversion, confirming their robustness.
Our results show that small-scale brittle failure in the ASZ occurs generally by strike-slip faulting, with the two possible fault planes oriented WNW-ESE and SSW-NNE, in agreement with focal mechanisms previously reported for M≥ 3.5 earthquakes in the region (Custódio et al., 2016, and references therein) (Figure 3).
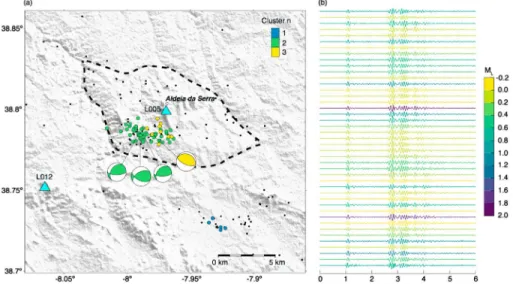
Figure 4. (a) Clustered earthquakes in the Aldeia da Serra area of the Arraiolos seismic zone. Families of earthquakes
and associated focal mechanisms are color coded according to the families they belong to. Nonclustered earthquakes are shown as black circles. The nearest stations are plotted as blue triangles. (b) Vertical waveforms of events in cluster 2 recorded at station L005. The waveforms are displayed chronologically, with the most recent events at the bottom. Seismic waveforms are normalized, band-passed in the frequency range 5–20 Hz and aligned as to maximize the cross correlation. The color scale represents the local magnitude (ML). The dashed black line delimits a rhomboidal geomorphological feature.
However, the present inversion of low-magnitude earthquakes additionally shows localized reverse faulting near Aldeia da Serra, a village located on a prominent topography high.
3.4. Earthquake Clustering
We now analyze the similarity of waveforms recorded at the DOCTAR array. Similar waveforms are gen-erated by earthquakes nucleated in close-by or overlapping hypocenters, with identical focal mecha-nisms and whose waves travel through an invariant medium (Poupinet et al., 1984). Earthquakes in these conditions—sometimes called repeaters—have been interpreted as resulting from the cyclic loading and rupturing of persistent asperities (Geller & Mueller, 1980). Waveform similarity is also useful to characterize families of earthquakes with identical faulting mechanisms and, in some cases, can facilitate the association of earthquake clusters to mapped fault segments (e.g., Maurer & Deichmann, 1995; Wetzler et al., 2014). In order to evaluate waveform similarity, we computed the cross correlations of P and S waveforms. We used events in our DOCTAR catalog with location qualities A and B, and filtered waveforms in the passband 5–20 Hz. The similarity of P waveforms was evaluated using vertical velocity records and that of S waveforms using the two horizontal velocity records. We computed the cross-correlation coefficient (CCc) between waveforms in
windows starting 0.5 s before, and ending 1 s after, the onset of P and S waves.
In order to find clusters of identical earthquakes, we used an agglomerative hierarchical clustering algorithm (e.g., Cormack, 1971). We defined clusters of earthquakes as satisfying the following conditions: Two events are similar if their CCcis greater than a given threshold at least at two stations. This condition must be verified by at least one pair of P and S waves. A cluster must comprise at least three similar earthquakes.
Because our data set displays little or no site effects, we used a fixed CCcthreshold for all stations. We adopted
thresholds of CCc> 0.85 and 0.77 for P and S waveforms, respectively. Details on the definition of the
thresh-olds are provided in Text S5. We identified 66 similar earthquakes divided into three clusters (Figure 4a). The three clusters are located in the ASZ, where network coverage is densest. Earthquakes in cluster 1 (blue) have a median depth of 15.7 km. The low magnitude of earthquakes in this cluster (median ML = 0.3) did not
allow the computation of focal mechanisms. Clusters 2 and 3 have a median focal depth of 12.0 km. Cluster 2 (green) is the most populated and comprises events with −0.2 < ML< 2.0. In spite of the 2 orders of
mag-nitude range, waveform similarity is mostly preserved throughout the entire waveform (Figure 4b). Focal mechanisms available for this cluster show an identical reverse faulting style (Figure 4), with possible fault planes oriented SW-NE and E-W. The tight linear clustering of these events in the south flank of a rhomboidal
Figure 5. (a) Seismic swarms in the Aldeia da Serra area of the Arraiolos seismic zone (ASZ). Panel (b) shows the
evolution in time of the seismicity in the Aldeia da Serra area, which is delimited by the shaded yellow rectangle in (a). Earthquakes (circles) are color coded by event origin time. Identified swarms are labeled as S1 and S2 and are shown with the same color code in (a): S1 = green and S2 = rose.
geomorphological feature (dashed black line in Figure 4a) suggests the existence of a thrust fault associated to a fault bend. The only focal mechanism available for cluster 3 (yellow) also indicates reverse motion, but now with possible fault planes striking NW-SE.
We investigated the spatiotemporal clustering of earthquakes in WOMZ using both the Portuguese instru-mental catalog and the DOCTAR catalog. We selected the last 16 years of earthquakes—the period in which the catalog is more complete. We identified two seismic sequences with no clear mainshock. These sequences follow the empirical criteria proposed by Mogi (1963) to define a seismic swarm: (i) they comprise more than 10 events, and (ii) the maximum daily number of events in the sequence is greater than twice the square root of the swarm duration in days. Figure 5 shows the spatiotemporal distribution of events during this period. The ASZ produced two seismic swarms in the Aldeia da Serra area (Figure 5). These swarms consist of 14 to 44 events, with magnitudes between 0.6 and 2.0 (Mc= 1.3), located at depths between 0 and 11 km.
Seismic swarms have been attributed to the following: (i) Heterogeneities in the source volume and conse-quently in the stress distribution (Mogi, 1963; Morales et al., 2015), (ii) decrease in fault strength due to fluid flow and pore pressure fluctuations (Kato et al., 2010; Špiˇcák & Horálek, 2001; Wicks et al., 2006), (iii) aseismic slip that generates microseismicity through the loading of neighboring areas of a fault zone (Lohman & McGuire, 2007; Peng & Gomberg, 2010; Takada & Furuya, 2010), and (iv) a combination of the last two (Vidale & Shearer, 2006).
The role of fluids in earthquake swarm generation has been investigated through monitoring of piezometric levels in aquifers (e.g., Esposito et al., 2001) and modeling of pore fluid pressure changes at depth in response to precipitation (e.g., Hainzl et al., 2006) and circulation of magmatic-derived fluids (e.g., Parotidis et al., 2003). Most of the earthquakes in these swarms occur at crustal depths of 10–25 km. Therefore, we rule out the hypothesis of triggering by extreme hydrological events. Heat flow measurements in the WOMZ are scarce (Fernàndez et al., 1998). The few available data points have values smaller than 0.064 W m−2, within the
aver-age global heat flow measurements for continental crust (e.g., Pollack et al., 1993), excluding a possible control by fluids from a magmatic source. There are also no hot springs in the area, nor springs rich in CO2(Lourenço,
1998), as observed in other intraplate regions with high swarm activity (e.g., the western Bohemian Massif, Geissler et al., 2005; Špiˇcák & Horálek, 2001). Thus, fluids do not seem to be a likely control of swarm activity in the WOMZ.
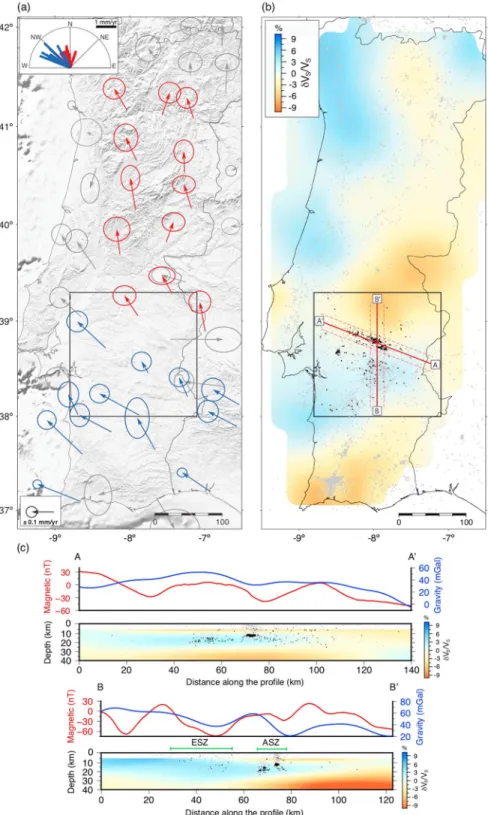
Figure 6. Global Navigation Satellite System velocities (Palano et al., 2015) andSwave velocity perturbations (Silveira et al., 2016). (a) Global Navigation Satellite System velocities are divided into three groups: north of the Arraiolos seismic zone (ASZ) (red), south of the ASZ (blue), and others (gray). The top inset shows blue and red velocity vectors, evidencing the difference in direction and amplitude between ground velocities north and south of the ASZ. (b)Swave velocity at a depth of 25 km inferred from ambient noise tomography. TheSwave velocity perturbation is shown in percentage relative to the average velocity of 3.91 km/s at 25 km. Red thick lines mark the verticalSwave profiles presented in (c); dashed lines delimit the areas containing the earthquakes shown in (c). Gray dots are the epicenters of earthquakes recorded in the period 1969–2016 and black dots are those from the Deep Ocean Test Array catalog. (c) Magnetic (Miranda et al., 1989) and gravity (Sandwell et al., 2014) anomalies along the selected cross sections are shown in red and blue, respectively.
Aseismic slip has been observed on large-scale mature faults, such as megathrust faults in subduction zones (Heki et al., 1997; Perfettini et al., 2010) and continental transform faults (Ozener et al., 2013; Rosen et al., 1998). Aseismic slip in slowly deforming regions is not documented. This lack of observations does not necessarily imply that aseismic slip does not occur in slowly deforming regions. Likely, the current observational capacity is not able to image such events.
Numerous studies have shown that earthquakes tend to cluster around step overs and other fault irreg-ularities (e.g., Morales et al., 2015; Segall & Pollard, 1980; van Eck & Hofstetter, 1990). Duan and Oglesby (2006) simulated the dynamics of segmented strike-slip fault systems over several earthquake cycles. They demonstrated that heterogeneous stress distributions develop around the step over, a result that persists at different scales.
A heterogeneous stress distribution produced by slip on a main fault system with a step over or the loading of neighboring areas of a fault zone due the aseismic slip in a main fault system are possible explanations for the Aldeia da Serra swarms compatible with current observations.
3.5. Complementary Geophysical Observations
Figure 6a shows surface velocities in a fixed Eurasian reference frame inferred from Global Navigation Satellite System (GNSS) (Palano et al., 2015). We divided the observations to the north of the ASZ (red) from those to its south (blue). Gray arrows show surface velocities in the Lusitanian basin and those sites with motion markedly different from nearby stations. Figure 6a shows that north of the ASZ surface velocity is mostly directed north-ward and has a lower amplitude. In comparison, south of the ASZ, velocities have higher amplitudes and are directed NW. Neres et al. (2016) recently analyzed an extended GNSS data set for Iberia, which shows that strain in the ASZ is dominated by right-lateral shear oriented approximately EW and marking a transition from local extension to its north to local compression to its south. These data are in good agreement with most focal mechanisms in the WOMZ, indicating a dominantly strike-slip regime, in which right-lateral motion occurs on fault planes oriented WNW-ESE. This orientation coincides with the direction of the ASZ belt.
Ambient noise tomography (Silveira et al., 2016) and the relocated DOCTAR catalog show that the ASZ has a slow uppermost crust (5–10 km) with very few earthquakes (Figure 6c). Most earthquakes occur at middle to lower crust depths (10–25 km), within a high-velocity anomaly. At a depth of 25 km, the ASZ marks a sharp transition between this high-velocity body and a slower region to its NE (Figure 6b). The separation of the OMZ into two domains, with a sharp seismic velocity contrast at depth along the ASZ, agrees with earlier active seismic source observations (Matias, 1996). In addition to being marked by seismicity, this limit is also marked by gentle negative gravity and magnetic anomalies (Figure 6c). The ESZ is also characterized by high seismic velocities, now extending from the upper crust down to a depth of 35 km. The fast velocity material again coincides with negative magnetic and gravity anomalies, likely associated with the Évora massif (Figure 1c).
4. Discussion and Conclusions
Palano et al. (2015) suggested that Iberia is undergoing rigid-body clockwise rotation. Destructive historical earthquakes and clustering of instrumental earthquakes suggest that this rotation is accompanied by internal deformation of Iberia, accommodated along discrete shear zones. Future analysis of GNSS data in intraplate Iberia should aim at clarifying the relative contributions of rigid-body rotation and internal deformation. In this article we characterized the seismic activity of the WOMZ, one of the regions in intraplate Iberia where defor-mation localizes. Next, we discuss the characteristics of active defordefor-mation in the WOMZ and implications for seismic hazard assessment.
4.1. Active Deformation in the WOMZ
Both historical and high-quality instrumental seismic data show a boundary in earthquake activity within the WOMZ, which separates a region of higher earthquake rate to its south from a region of lower earthquake rate to its north. The boundary is sharply marked by the ASZ, a narrow seismic belt oriented WNW-ESE. In the ESZ, located south of the ASZ, earthquakes are distributed across a broader region and do not cluster as tightly as in the ASZ. The DOCTAR high-resolution catalog shows that earthquakes in these active regions occur mostly at depths of 12–20 km. The observed b value of 1.0 suggests a tectonic control for these earthquakes, rather than a fluid-related control. Focal mechanisms indicate a general strike-slip regime in the region, with possible fault planes oriented WNW-ESE and SSW-NNE, where the former coincides with the direction of the ASZ lineation. GNSS shear strain rates indicate a localized dextral strike-slip regime along the ASZ,
Figure 7. Possible kinematics of a right-lateral strike-slip shear zone in the Arraiolos seismic zone (ASZ), encompassing
three segments (green dashed lines), between which a restraining bend exists (see purple-shaded area). Maximum horizontal compressive stress (Shmax) from the World Stress Map 2016 (Heidbach et al., 2016).
in agreement with focal mechanisms. Localized reverse faulting is observed in the tight earthquake clusters near Aldeia da Serra, suggesting local compression, in agreement with the observed topographic high. Swarm activity in Aldeia da Serra, together with compressive faulting in a generally strike-slip environment, suggests a local step over that causes stress heterogeneity.
In light of these results, we propose that the ASZ and ESZ are regions of slow but active deformation, with the following characteristics and controls:
1. Kinematics of the ASZ. The ASZ marks a right-lateral strike-slip shear zone, with a small compressive left step over in Aldeia da Serra, which causes the local high density of earthquakes. This hypothesis is supported by strike-slip focal mechanisms along the ASZ, similarity between orientation of the epicenters lineation and one of the nodal planes of the focal mechanisms (WNW-ESE), and geodetic surface velocities. A possible geometry for the ASZ, encompassing three segments, is shown in Figure 7. Segment 1 is marked by low-to moderate-magnitude seismic activity, particularly intense at upper- low-to middle-crustal depths (0–15 km). Segment 2 would be the right-hand continuation of the compressive step over. It shows little seismicity, which could mean that this segment is inactive, currently locked, or not yet fully developed. Segment 3 pro-duces abundant lower crustal earthquakes (>15 km). All three segments have similar azimuths of ∼N65∘W, favorably oriented with respect to the regional maximum horizontal compressive stress SHmax ∼ N30∘W (Heidbach et al., 2016). Alternatively, the ASZ can be composed of a set of WNW-ESE to W-E en ech-elon smaller faults. Detailed geomorphological studies of the region should contribute to clarify the surface deformation.
2. The ASZ marks the separation between two crustal blocks in the WOMZ. The ASZ seems to mark a boundary between two crustal blocks within the OMZ. This hypothesis is supported by active seismic source experi-ments, which suggest the existence of two distinct zones within the Ossa Morena Zone (Matias, 1996) and by the sharp transition between negative and positive tomographic anomalies at depths of 5 to 25 km (Silveira et al., 2016). These observations suggest that the fast southernmost block is composed of strong material, with a brittle behavior down to larger depths. Molnar and Dayem (2010) suggested that large intraconti-nental strike-slip faults tend to form adjacent to sharp discontinuities in lithospheric strength, which could be an interesting hypothesis to test at the scale of smaller crustal blocks.
3. Lithological control of seismic activity in the ESZ. Earthquakes in the ESZ have a good spatial correlation with the Évora massif (Figure 1c), suggesting that the massif is currently localizing deformation. Earthquakes occur preferentially along negative magnetic and gravity anomalies (Figures 1d and 1e), likely associated to plutons of granitoids. Contrasts in the elastic properties between different lithologies will favor the accu-mulation of stress in the borders between blocks, localizing tectonic stresses where favorably oriented preexisting structures exist. Stevenson et al. (2006) investigated the concentration of stress around plutons in South Carolina. Using a numerical approach, they imposed ambient tectonic stresses on granitic plu-tons embedded in a more rigid and dense gneissic rock and observed that the pluplu-tons tended to develop high shear stress in their periphery, where earthquakes tended to occur. The Évora massif is characterized
by several contact faults, mostly oriented WNW-ENE, which mark the limits between plutons and host rock and between different rocks resulting from magma differentiation inside plutons. The small-magnitude earthquakes of the ESZ may occur along these contacts. Whether the ESZ is capable of producing haz-ardous earthquakes remains an open question. It is intriguing to note that several geologically mapped faults surround the Évora massif, which may indicate that the massif is a strong block that acts as a barrier to fault propagation.
4. A possible mantle control? The striking difference in the rate of seismic activity north and south of the ASZ could have a rheological origin. The region south of the ASZ is faster, suggesting more competent mate-rial, eventually with higher ability to store elastic energy and release it through fracture in earthquakes. Alternatively, the existence of this boundary may be related to mantle processes, rather than crustal. Man-tle anisotropy in Iberia reveals a slightly different manMan-tle flow direction beneath the WOMZ, which may be associated with vertical mantle flow due to small-scale convection cells (Díaz et al., 2015). Vertical mantle flow could be responsible for thermal weakening of the lower crust and consequently with the concentra-tion of stress at middle to upper crustal depths (Liu & Zoback, 1997). Current heat flow measurements in the WOMZ are on the high end of the average global heat flow measurements for continental crust. Dedicated heat flow measurements should contribute to elucidate the thermal structure beneath the WOMZ. 4.2. Implications for Seismic Hazard Assessment
Calais et al. (2016) argued that the stable continental crust is in a pervasive state of near-critical stress and that in these conditions earthquakes may be better explained by transient perturbations to the local stress or fault strength rather than by near-steady state stress buildup. In this framework, earthquakes may occur in regions where no surface deformation is observed and where no seismicity has previously been observed. Thus, classical earthquake hazard assessment strategies may be inadequate for SDRs (Calais et al., 2016; Craig et al., 2016; Liu & Stein, 2016; Schweig et al., 2003; Stein & Liu, 2009; Stein & Mazzotti, 2007; Stein et al., 2017). It remains unclear how earthquake processes should be monitored and how seismic hazard should be assessed in these regions.
Previous studies of W Iberia—a region where intraplate deformation occurs at rates<1 mm/yr (Fernandes et al., 2007; Palano et al., 2015)—had shown that approximately half of all earthquakes localize along clusters and lineaments, as imaged by the high-quality recent instrumental record (1996–present) (Custódio et al., 2015). In this work, we carried out a detailed analysis of historical seismic data, local instrumental seismic data, and geodetic data, which indicate the existence of an active shear zone along the ASZ. These results suggest that, even though earthquake cycle and recurrence concepts may not be adequate to address seismic hazard in SDRs, high-quality monitoring may be useful to identify blocks with different rheological behaviors and regions of stress localization.
The accurate characterization of seismogenic source zones and the estimation of the potential magnitudes of forthcoming large earthquakes are key questions in seismic hazard assessment. Studies like the present one may be useful in the following ways:
1. Characterization of seismic source zones. Seismogenic source zones (SSZ) are used in probabilistic seismic hazard assessment to account for the hazard posed by earthquakes not associated with known tectonic fea-tures. Inside a given SSZ, the maximum moment magnitude, seismogenic depth, style of faulting, rupture orientation, and seismic rate are considered uniform. The design of SSZ relies on the similarity of patterns within a region, considering earthquake catalogs, geological, and geophysical data (Reiter, 1991; Vilanova et al., 2014). In this context, high-resolution geophysical techniques may be used to map lateral variations in seismogenic behavior and in rheological properties, such as the two blocks identified within the OMZ. In favorable cases, detailed microseismic studies may also allow the mapping of active shear zones.
2. Seismogenic depth. The thickness of the seismogenic zone is commonly used as a proxy for the width of fault rupture (e.g., Sibson, 1982). High-quality seismic catalogs allow the mapping of the spatial vari-ations of seismogenic depth. In addition, seismogenic depth is a key parameter when linking crustal to mantle processes.
3. Mapping fault networks. The ever increasing density of seismic instrumentation will likely reveal regions where small-magnitude earthquakes cluster. Detailed studies of these clusters will clarify whether they mark hidden active faults, blocks of weaker material, or geometrical heterogeneities in fault systems.
SDRs are regions where deformation is accommodated along complex fault networks. Microseismicity may help quantify characteristics of the fault network, including preferential orientation of fault planes, seismogenic depth, segment length, and density of the network.
References
Afilhado, A., Matias, L., Shiobara, H., Hirn, A., Mendes-Victor, L., & Shimamura, H. (2008). From unthinned continent to ocean: The deep structure of the West Iberia passive continental margin at 38∘N. Tectonophysics, 458(1), 9–50.
Ahorner, L. (1975). Present-day stress field and seismotectonic block movements along major fault zones in Central Europe. Tectonophysics,
29(1–4), 233–249. https://doi.org/10.1016/0040-1951(75)90148-1
Albaric, J., Déverchère, J., Petit, C., Perrot, J., & Le Gall, B. (2009). Crustal rheology and depth distribution of earthquakes: Insights from the central and southern East African Rift System. Tectonophysics, 468(1), 28–41. https://doi.org/10.1016/j.tecto.2008.05.021
Araújo, A., Matos, J., & Martins, A. (2010). The Aldeia da Serra hill (Arraiolos): An active “Push up” associated with the Ciborro fault and the S. Gregório, lineament? e-Terra, 11(10), 1–4.
Arroucau, P., Custódio, S., Civiero, C., Dias, N. A., & Silveira, G. (2017). PRISM3D: A preliminary 3D reference seismic model of the crust and upper mantle beneath Iberia. In 19th EGU General Assembly, EGU2017, proceedings from the conference held 23-28 April, 2017 in Vienna,
Austria (p. 16801).
Arrowsmith, J. R., & Zielke, O. (2009). Tectonic geomorphology of the San Andreas Fault zone from high resolution topography: An example from the Cholame segment. Geomorphology, 113(1), 70–81. https://doi.org/10.1016/j.geomorph.2009.01.002
Bachmann, C. E., Wiemer, S., Goertz-Allmann, B., & Woessner, J. (2012). Influence of pore-pressure on the event-size distribution of induced earthquakes. Geophysical Research Letters, 39, L09302. https://doi.org/10.1029/2012GL051480
Basili, R., Kastelic, V., Demircioglu, M., Garcia Moreno, D., Nemser, E., Petricca, P., et al. (2013). The European Database of Seismogenic Faults (EDSF) compiled in the framework of the project SHARE. https://doi.org/10.6092/INGV.IT-SHARE-EDSF
Batlló, J., Carrilho, F., Alves, P., Cruz, J., & Locati, M. (2012). A new online intensity data point database for Portugal. In Proceedings of the XV
world conference on earthquake engineering (pp. 24–28). Lisbon, Portugal.
Beyreuther, M., Barsch, R., Krischer, L., Megies, T., Behr, Y., & Wassermann, J. (2010). ObsPy: A Python toolbox for seismology. Seismological
Research Letters, 81(3), 530–533. https://doi.org/10.1785/gssrl.81.3.530
Bezada, M., Humphreys, E., Davila, J., Carbonell, R., Harnafi, M., Palomeras, I., & Levander, A. (2014). Piecewise delamination of Moroccan lithosphere from beneath the Atlas Mountains. Geochemistry, Geophysics, Geosystems, 15, 975–985. https://doi.org/10.1002/ 2013GC005059
Borges, J. F., Fitas, A. J., Bezzeghoud, M., & Teves-Costa, P. (2001). Seismotectonics of Portugal and its adjacent Atlantic area. Tectonophysics,
331(4), 373–387. https://doi.org/10.1016/S0040-1951(00)00291-2
Bormann, P., Wendt, S., & Klinge, K. (2013). Data analysis and seismogram interpretation. In P. Bormann (Ed.), New Manual of Seismological
Observatory Practice (NMSOP-2) (Chap. 11, pp. 1–259). Potsdam: Deutsches GeoForschungsZentrum GFZ. https://doi.org/10.2312/
GFZ.NMSOP-2_ch11
Bouchon, M. (1981). A simple method to calculate Green’s functions for elastic layered media. Bulletin of the Seismological Society of America,
71(4), 959–971.
Bowman, J., Gibson, G., & Jones, T. (1990). Aftershocks of the 1988 January 22 Tennant Creek, Australia intraplate earthquakes: Evidence for a complex thrust-fault geometry. Geophysical Journal International, 100(1), 87–97. https://doi.org/10.1111/j.1365-246X.1990.tb04570.x Brocher, T. M., Wells, R. E., Lamb, A. P., & Weaver, C. S. (2017). Evidence for distributed clockwise rotation of the crust in the northwestern
United States from fault geometries and focal mechanisms. Tectonics, 36, 787–818. https://doi.org/10.1002/2016TC004223 Brown, D., Zhang, X., Palomeras, I., Simancas, F., Carbonell, R., Juhlin, C., & Salisbury, M. (2012). Petrophysical analysis of a mid-crustal
reflector in the IBERSEIS profile, SW Spain. Tectonophysics, 550, 35–46. https://doi.org/10.1016/j.tecto.2012.05.004
Buforn, E., De Galdeano, C. S., & Udías, A. (1995). Seismotectonics of the Ibero-Maghrebian region. Tectonophysics, 248(3–4), 247–261. https://doi.org/10.1016/0040-1951(94)00276-F
Burg, J., Iglesias, M., Laurent, P., Matte, P., & Ribeiro, A. (1981). Variscan intracontinental deformation: The Coimbra–Cordoba shear zone (SW Iberian Peninsula). Tectonophysics, 78(1–4), 161–177. https://doi.org/10.1016/0040-1951(81)90012-3
Cabral, J. (1995). Neotectónica em Portugal Continental, Instituto Geológico e Mineiro. Lisboa. (Memória nº 31).
Cabral, J. (2012). Neotectonics of mainland Portugal: State of the art and future perspectives. Journal of Iberian Geology, 38(1), 71–84. https://doi.org/10.5209/rev_JIGE.2012.v38.n1.39206
Calais, E., Mazabraud, Y., Mercier de Lépinay, B., Mann, P., Mattioli, G., & Jansma, P. (2002). Strain partitioning and fault slip rates in the northeastern Caribbean from GPS measurements. Geophysical Research Letters, 29(18), 1856. https://doi.org/10.1029/2002GL015397 Calais, E., Camelbeeck, T., Stein, S., Liu, M., & Craig, T. (2016). A new paradigm for large earthquakes in stable continental plate interiors.
Geophysical Research Letters, 43, 10,621–10,637. https://doi.org/10.1002/2016GL070815
Camelbeeck, T., & Meghraoui, M. (1998). Geological and geophysical evidence for large palaeo-earthquakes with surface faulting in the Roer Graben (northwest Europe). Geophysical Journal International, 132(2), 347–362. https://doi.org/10.1046/j.1365-246X.1998.00428.x Camelbeeck, T., Vanneste, K., Alexandre, P., Verbeeck, K., Petermans, T., Rosset, P., et al. (2007). Relevance of active faulting and seismicity
studies to assessments of long-term earthquake activity and maximum magnitude in intraplate northwest Europe, between the Lower Rhine Embayment and the North Sea. Geological Society of America Special Papers, 425, 193–224.
Canora, C., Vilanova, S. P., Besana-Ostman, G. M., Carvalho, J., Heleno, S., & Fonseca, J. (2015). The Eastern Lower Tagus Valley Fault Zone in central Portugal: Active faulting in a low-deformation region within a major river environment. Tectonophysics, 660, 117–131. https://doi.org/10.1016/j.tecto.2015.08.026
Carbonell, R., Simancas, F., Juhlin, C., Pous, J., Pérez-Estaún, A., González-Lodeiro, F., et al. (2004). Geophysical evidence of a mantle derived intrusion in SW Iberia. Geophysical Research Letters, 31, L11601. https://doi.org/10.1029/2004GL019684
Carrilho, F., Pena, A., Nunes, J., & Senos, M. L. (2004). Catálogo sísmico instrumental 1970–2000 (Tech. Rep.). Instituto de Meteorologia. Depósito legal No: 221 955/05.
Carvalhosa, A. (1999). Carta Geológica de Portugal na escala 1/50 000, Folha 36-C (Arraiolos) e respectiva notícia explicativa, Lisboa: Instituto Geológico e Mineiro.
Chevalier, M.-L., Leloup, P. H., Replumaz, A., Pan, J., Liu, D., Li, H., et al. (2016). Tectonic-geomorphology of the Litang fault system, SE Tibetan Plateau, and implication for regional seismic hazard. Tectonophysics, 682, 278–292. https://doi.org/10.1016/j.tecto.2016.05.039
Acknowledgments
We acknowledge all institutions providing seismic data used in this research: Deep Ocean Test Array (DOCTAR) project (Hannemann et al., 2013, 2016, 2017), FCT project WILAS-West Iberia Lithosphere and Asthenosphere Structure (doi:10.14470/3n7565750319), Instituto Português do Mar e da Atmosfera (IPMA) Seismic Network, University of Lisbon Seismic Network and Western Mediterranean Seismic Network (doi:10.14470/JZ581150). DOCTAR and WILAS waveform data were accessed through the ORFEUS data center. DOCTAR instruments were provided by the Geophysical
Instrument Pool Potsdam (GIPP). The macroseismic intensity database of Portugal is available upon request to IPMA. We would like to acknowledge the comments and suggestions of the two anonymous reviewers and of the Associate Editor Yehuda Ben-Zion that significantly improved the manuscript. We also acknowledge the fruitful discussions with Luís Matias. This publication is supported by the FCT project SPIDER-Seismogenic processes in slowly deforming regions (PTDC/GEO-FIQ/2590/2014). This work is a contribution to FCT
UID/GEO/50019/2013-Instituto Dom Luiz. C. Matos was supported by the FCT research grant
PD/BD/106019/2014. P. Arroucau acknowledges support from Science Foundation Ireland
(grant 13/CDA/2192) and from the Geological Survey of Ireland (grant 2016-PD-06). We used ObsPy (Beyreuther et al., 2010) for seismic analysis. Most figures were plotted using the GMT - Generic Mapping Tools software (Wessel & Smith, 1998).