*For correspondence. (e-mail: [email protected])
†Deceased 12 May 2016
Ranking Mediterranean-type shrubs and trees
by their allelopathic activity is not independent
of how extract concentration is expressed
I. P. Pereira
1,2,†, L. S. Dias
2,* and A. S. Dias
21Instituto de Ciências Agrárias e Ambientais Mediterrânicas, Universidade de Évora, Évora, Portugal 2Departamento de Biologia, Universidade de Évora, Évora, Portugal
Water extracts from 19 Mediterranean-type shrubs and trees were screened for phytoactivity on germina-tion of lettuce. The existing model for the effects of pH and osmotic pressure on germination requires refit-ting. Extract concentrations were expressed as plant fresh weight, plant dry weight and extract dry weight, and final ranking of the six phytoactive species was found to strongly depend on the way the concentra-tions are expressed. This methodological issue re-quires consideration when designing allelopathic bioassays. Extract dry weight is conceptually the most adequate way to express concentration and should be used, despite the increase in time and labour it requires.
Keywords: Allelopathy, extract concentration,
germi-nation, osmotic pressure.
ALLELOPATHY refers to all types of effect in one plant produced by chemical compounds synthesized by another or the same plant, the term having been coined in the late 1930s (ref. 1). Research on allelopathy relies heavily on bioassays in which effects of extracts of plant parts on germination or growth are investigated. A number of methodological requirements of bioassays have been examined, including the dependency of functional availa-bility of phytochemicals on seed density2,3, the relevance
of seed morphology4, selection of target species or
culti-vars5, types of solvent used for phytochemicals
extrac-tion6, and combined effects of pH and osmotic pressure
of solutions7.
However, except when compounds are tested individu-ally, single dose or dose–response designs have to deal with the concentration of tested extracts. This also applies to the study and modelling of the putative hormetic, dual actions (stimulation and inhibition) of mixtures of allelochemicals8 or the study of density-dependent
phyto-toxicity2,9.
Therefore questions inevitably arise on how to express concentration, i.e. in relation to the fresh weight of plant
parts extracted, to their dry weight or to the dry weight of the compounds extracted. To answer these questions we set out to investigate the effects, corrected for pH and osmotic pressure, of a series of concentrations of water extracts of intact above-ground vegetative parts of Medi-terranean-type shrubs or trees. Since the range of pH and osmotic pressure of extracts lay outside the range to which the equations were fitted7, the original model was
extended and a new equation had to be fitted.
Materials and methods
Plant materials and extraction
Nineteen Mediterranean-type species, mostly non-cultivated aromatic shrubs, from ten different families (Supplementary Table 1), were harvested in mid-winter before flowering, near Valverde, Évora, southern Portu-gal. Seeds of lettuce (Lactuca sativa L. cv. ‘Rainha de Maio’; Asteraceae) were used in the bioassays.
Vegetative shoots were collected and transported in re-frigerated plastic bags to the laboratory, where 30 g of in-tact leaves (because of the spiny nature of leaves or their replacement by spines complete shoot tops were used in
Calicotome villosa and Ulex parviflorus) weighed to the
nearest milligram were soaked in distilled water and ex-tracted for 40 h at 30C and constant darkness. For
Euca-lyptus globulus, because of its marked leaf heteroblasty
young and mature leaves were separately extracted.
Extracts were filtered through Whatman No. 1 filter paper and adjusted to the concentration of 100 mg ml–1 (plant fresh weight volume–1, PFW), which was used as stock solution for the preparation of 50 and 25 mg ml–1 PFW solutions. When not in use, stock solutions were kept at –20C. After extraction, leaves (or shoot tops) were dried at 60C in an aerated oven and weighed to the nearest milligram, thus allowing concentrations to be expressed as plant dry weight volume–1 (PDW) after add-ing the dry weight of extracted material. Finally, for each donor species, four 2 ml aliquots of the highest PFW were dried at 60C in an aerated oven and the dry resi-dues weighed to the nearest 0.1 mg, thus allowing
concentrations to be expressed as extract dry weight volume–1 (EDW).
The pH and osmotic pressure () of the three concen-trations of all extracts were determined with a pH-meter Metrohm E-520 (Metrohm AGH, Switzerland) and a semi-micro freezing-point osmometer Knauer type M (Knauer, Wissenschaftliche Geräte GmbH, Germany) respectively.
Effects of pH and osmotic pressure
The experiment followed a dose–response design and a rationale similar to that described elsewhere for a 3 4 arrangement of pH (intended at 3.0, 4.5 and 6.0) and (intended at 0, 25, 50 and 100 mOsmol kg–1)7, except that
a 4 2 arrangement of pH (intended at 4.0, 5.0, 6.0 and 8.5) and (intended at 0 and 25 mOsmol kg–1) was used. Solutions were prepared with 0.1 M HCl or NaOH and polyethylene glycol PEG-400 (Carbowax, Fisher Chemical, USA average molecular weight 380–420). pH and values were ascertained with a pH-meter and a
semi-micro freezing-point osmometer as described above. Four replicated 10 cm glass petri dishes were fitted with Whatman No. 1 filter paper, sown with 25 lettuce seeds, and wetted with 5 ml of the appropriate pH and solu-tion. Seeds were incubated under 20C and 8 h photoper-iod provided by seven fluorescent tubes (Philips TLD 18W/84), considered germinated if the radicle was at least as long as the greater dimension of the seed10, and
regularly counted and discarded during seven days.
Extract phytoactivity
Two replicated 10 cm glass petri dishes per donor species and concentration were fitted with Whatman No. 1 filter paper, sown with 50 lettuce seeds and wetted with 5 ml of the appropriate extract. Controls were prepared similarly with distilled water adjusted with 0.2 M HCl to pH 5.3. Seeds were incubated and considered germinated as described above. Germinated seeds were regularly count-ed and discardcount-ed during 14 days or less.
Statistical analyses
Linear regression analyses, Pearson’s correlation coeffi-cient analyses and ANOVA were done with Statgraphics 4.2 (STSC, Inc., Rockville, MD, USA), all other statistics with Excel®2010 (Microsoft Corporation, USA). Coeffi-cients of determination (R2) of regressions with
replica-tion are presented as the proporreplica-tion of maximum R2 value
possible11 and data as mean SE.
The equation fitted previously7 to the relationship
be-tween pH and and germination was used to generate expected values of germination using pH and values
of this experiment. Assessment of the adequacy of
equa-tion was done using two-tailed Student’s t test for paired comparisons12.
Given the result of the test we decided to fit a new equation pooling together data for which the equation had been originally fitted with data from this experiment, datasets A and B respectively (Supplementary Figure 1). As done before7, the relationship between jackknifed
values13 of germination, and pH and was investigated
by stepwise least squares regression with replication and an experiment-wise error rate for coefficients of 0.01 calculated by Dunn-Šidák method14. Polynomials were
used, and candidate models included up to the third power of pH or and all interactions between them. Adequacy of the new equation was assessed as described above.
In germination bioassays, observed data (Yobs) were
transformed to observed effects (YOE) as
YOE (YobsYC) /YC, (1)
where Y is the observed mean of control. Thus, the C
control was normed so that the mean of its effects was zero. Positive values of YOE corresponded to values of
observed germination higher than the control (stimula-tion), negative values to observed values lower than the control (inhibition). Values of germination to be expected from the combined effects of pH and alone, regardless of the chemical composition of extracts, were calculated from eq. (2) below.
Expected values were transformed to expected effects (YEE) using eq. (1). Finally, effects corrected (YCE) for pH
and were determined by subtracting expected effects from observed effects (YCE = YOE – YEE). Corrected effects
of all treatments were compared with those of control by two-tailed Student’s t test for unpaired comparisons after checking for homoscedasticity using the two-tailed F dis-tribution, always using a significance level of P = 0.05. Species for which statistically significant corrected ef-fects of extracts were found were further analysed and the relationship between corrected effects and concentrations (PFW, PDW or EDW normed so that the highest concen-tration is unity) was studied by stepwise least squares re-gression with replication and an experiment-wise error rate for coefficients of 0.05 calculated by Dunn-Šidák method14. Polynomials were used as candidate models,
including up to the third power of normed concentrations and were forced through the origin because corrected effects for controls (PFW = PDW = EDW = 0 mg ml–1) are necessarily zero.
Results
Effects of pH and osmotic pressure
In some cases the intended values of pH or in dataset B were not exactly matched (Supplementary Table 2).
Nevertheless, because the overall design of the experi-ment is dose–response, the small differences observed do not prevent their use.
Significant differences were found between observed and predicted values of germination for all data (t31 =
3.416, P = 0.002) when the equation previously fitted to dataset A7 was used on dataset B. Differences were
essentially due to new combinations of pH and values outside dataset A (t15 = 2.992, P = 0.009) while for
com-binations common to datasets A and B, no significant dif-ferences were found (t15 = 1.824, P = 0.088). Ordering
observed germination data of dataset B by the magnitude
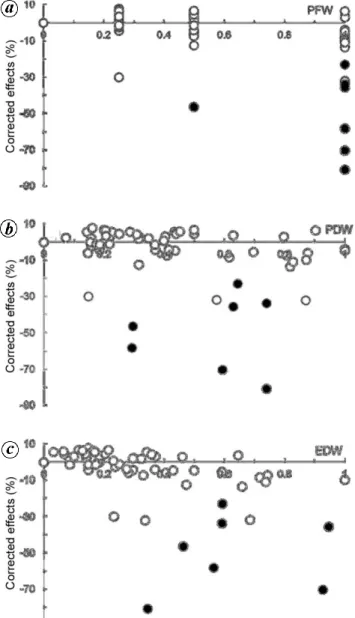
Figure 1. Relationship between effects of extracts corrected for pH
and osmotic pressure on germination of Lactuca sativa cv. ‘Rainha de Maio’. Extract concentrations are expressed as (a) plant fresh weight volume–1 (PFW), (b) plant dry weight volume–1 (PDW), and (c) extract dry weight volume–1 (EDW). All concentrations were normed so that the highest value was unity. Open symbols indicate no significant dif-ferences in relation to control and filled symbols show that effects are significantly different from control at P = 0.05.
of errors (observed minus predicted, regardless of sign) and sequentially removing errors starting with the largest, germination under pH 8.5 and 25 mOsmol kg–1 was clearly the main cause of extrapolation failure (t12 =
1.678, P = 0.121 when the four larger errors, all from that combination, were removed).
Therefore we set out to fit a new equation pooling together data of datasets A and B. The equation fitted for the expected values of germination (Gexp) of lettuce was
significant for all coefficients (P < 0.0002), lack of fit was significant (F11,49 = 5.076, P = 3.051 10–5) and R2 = 0.654.
The new equation is
Gexp = 95.52307 – 5.62467 10–43 + 1.60676
10–4 pH 3 – 1.86981 10–6 pH33. (2)
The term in alone accounts for 49.3% of the variation of germination explained by the equation, the two terms in pH and for 50.7%. No significant differences were found between observed and expected values for pooled data of datasets A and B (t63 0, P 1), neither for
da-taset A alone (t31 = 1.692, P = 0.101) nor for dataset B
alone (t31 = 1.568, P = 0.127).
Extract concentration
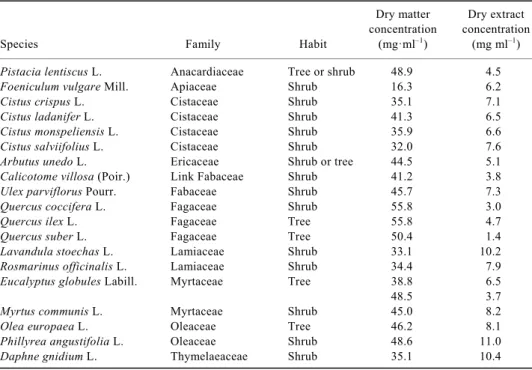
Concentrations of undiluted stock solutions (100.0 mg ml–1, PFW) expressed as plant dry weight volume–1 (PDW) had a coefficient of variation (CV) of 22.5% ranging from 16.3 mg ml–1 in Foeniculum vulgare, indicating that more than 80% of its fresh weight was water, to 55.8 mg ml–1 in Quercus coccifera and Quercus ilex, both Fagaceae, indicating that less than half of their fresh weight was water (Supplementary Table 1). Extract concentration ex-pressed as EDW had a larger coefficient of variation (CV = 39.0%) ranging from 1.4 mg ml–1 in Quercus
su-ber, indicating that less than 3% of biomass of intact
leaves could be extracted by water, to 11 mg ml–1 in
Phyllirea angustifolia (Supplementary Table 1). How-ever, in a number of species the fraction of biomass of intact leaves (or shoot tops) that could be extracted by water was greater than that in P. angustifolia, the maxi-mum being attained in F. vulgare in which almost 40% of biomass was extracted by water.
There was a clear trend of an inverse relationship be-tween PDW and EDW, both expressed as percentage of PFW (Supplementary Figure 2a), but Pearson’s correla-tion coefficient between them was not significant (r18 =
–0.405, P = 0.077). However, when the data were reana-lysed without F. vulgare, a significant negative correla-tion coefficient emerged (r17 = –0.546, P = 0.016). Using
the ratio EDW/PDW instead of EDW/PFW ( Supplemen-tary Figure 2b), a highly significant negative correlation was observed even with F. vulgare present (r18 = –0.845,
P < 10–4 compared with r17 = –0.773, P = 10–4 without
F. vulgare).
Extract phytoactivity
Germination ranged between 17.6% 2.0% (C. villosa, higher concentration) and 98.0% 0% (Cistus
mon-speliensis, lower concentration). Germination of control
was 91.0% 3.0%. Effects ranged between –80.6% 2.2% and 7.7% 0%. Positive effects were found in 47% of bioassays, including all concentrations of Arbutus
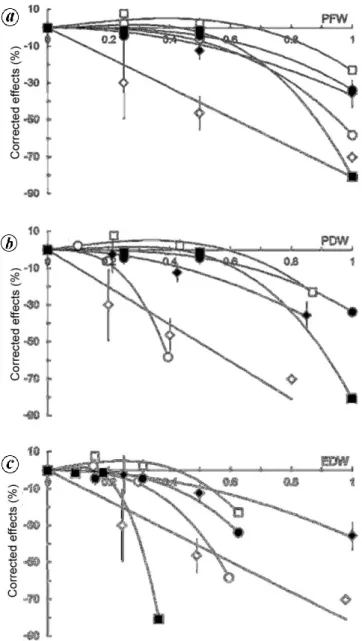
Figure 2. Expected and observed effects of extracts corrected for pH
and osmotic pressure on germination of L. sativa cv. ‘Rainha de Maio’ (means SE). Extract concentrations are expressed as (a) PFW, (b) PDW and (c) EDW. Concentrations were normed so that the highest value was unity. Open circles, Foeniculum vulgare; filled circles,
Cistus ladanifer; open squares, Cistus monspeliensis; filled squares, Calicotome villosa; open diamonds, Lavandula stoechas and filled
dia-monds, Daphne gnidium.
unedo and Q. suber, while negative effects were found in
53% of bioassays, including all concentrations of Cistus
ladanifer, C. villosa, Lavandula stoechas, P. angustifolia
and Daphne gnidium.
After being corrected, pH and effects ranged bet-ween −80.7% 2.2% (C. villosa, higher concentration) and 7.7% 0% (C. monspeliensis, lower concentration). Positive corrected effects were found in 44% of bio-assays, including all concentrations of A. unedo, Q. suber and Cistus crispus, while negative corrected effects were found in 56% of bioassays, including all concentrations of the five species found in uncorrected effects.
Significant differences between corrected effects of extracts and control were found in the intermediate con-centration of L. stoechas (t2 = 4.856, P = 0.040) and in
the higher concentrations of F. vulgare (t2 = 15.435,
P = 0.004), C. ladanifer (t2 = 9.236, P = 0.012), C.
mon-speliensis (t2 = 6.915, P = 0.020), C. villosa (t2 = 20.502,
P = 0.002), L. stoechas (t2 = 12.315, P = 0.007), and D.
gnidium (t2 = 4.432, P = 0.047).
When corrected effects were plotted against PFW (Fig-ure 1a), there was a clear increase in the variability of
re-sponses with concentration, with almost all significant differences at the higher end of the range of concentra-tions. Conversely, when corrected effects were plotted against PDW (Figure 1b), the larger variability of
responses and significant differences were located mostly in the middle of the range of concentrations, with the lower and higher ends showing less variability and no significant differences. Finally, when corrected effects were plotted against EDW (Figure 1c), the larger
varia-bility of responses and significant differences were located mostly in the upper half of the range of concen-trations.
Regression equations could always be fitted to the rela-tionship between corrected effects on germination of let-tuce and concentration of extracts of the six species found to significantly affect germination, with coefficients of determination always greater than 0.966 (Supplementary Table 3). Relationships were always curvilinear, except in L. stoechas for which a straight line was found (Figure 2).
Discussion
Effects of pH and osmotic pressure
The possible contribution of pH and to the effects of allelochemicals on germination has long been recognized but only rarely accounted for15,16, being assumed without
evidences that pH and act independently on seed ger-mination.
The equation that was previously fitted to predict the response of germination of lettuce cv. ‘Rainha de Maio’7
partly coincided with the values measured in this study. That equation clearly had good interpolation properties but failed when used for extrapolation, especially for the combination of pH 8.5 and 25 mOsmol kg–1. Therefore, its use outside the range for which it was ori-ginally fitted should be avoided. Conversely eq. (2) is clearly an adequate predictor of the combined effects of pH and measured in extracts bioassayed in this exper-iment.
Extract concentration
Given the experimental design adopted, the concentration of all stock solutions expressed as PFW was necessarily the same. Naturally a completely different picture emerg-es when extracts concentration are expremerg-essed as PDW or EDW, with the variation in concentration extending by almost one order of magnitude in the latter.
Also, there is a clear inverse trend between PDW and EDW, stronger when the ratio EDW/PDW is used instead of EDW/PFW. This implies that as the amount of water in leaves (or shoot tops) decreases and consequently as PDW increases, there is a decrease in the amount of leaf or shoot top materials extractable by water in a gradient of diminishing water extractability from F. vulgare to the highly sclerophyllous Quercus.
Extract phytoactivity
Most parts of the extracts tested were ineffective, with less than one-third of species able to reduce germination of lettuce, a species known to be highly sensitive to exogenous phytochemicals5. This prevalence of
ineffec-tiveness is somehow surprising because phytoactivity was reported in some of those species, namely Rosmarinus
officinalis17 and E. globulus18, while the known
phyto-chemical composition of others would make them strong candidates to affect germination, namely Cistus
salviifo-lius19, A. unedo20 or Myrtus communis21.
Chaparral shrubs and trees as those tested here produce high amounts of terpenoids22 known to possess a large
spectrum of biological activities, notably phytoactivity and allelopathy23, their production increasing strongly, at
least in isoprene and monoterpenes, as temperature rises24. Therefore, explanation for the small number of
phytoactive species found might be that the collection of materials for extraction was done in mid-winter, the rainy and colder season, while in the above-mentioned studies collection of plant materials was done in dry, hotter periods, when higher amounts of allelochemicals were probably present.
Conversely, to our knowledge there are no previous reports of allelochemicals phytoactivity for three of the six species effective on germination of lettuce, namely
C. monspeliensis, C. villosa and D. gnidium.
When effective, significant inhibition of germination of lettuce after correction for pH and osmotic pressure extended from moderate to very intense, ranging from −23% to –81%.
Ranking species by corrected effects, the least effective was C. monspeliensis and the most effective was
L. stoechas followed by C. villosa and F. vulgare when
extract concentration was expressed as PFW.
Ranking by PDW, the least effective was either
D. gnidium or C. monspeliensis and the most effective
was clearly F. vulgare because even if corrected effects were slightly less intense than those by L. stoechas and
C. villosa, they resulted from a much lesser concentration
in terms of plant dry weight.
Finally, ranking by EDW the least effective was again
D. gnidium and the most effective was C. villosa, because
not only its corrected effects were the largest but also because they were obtained from a much smaller amount of extracted allelochemicals.
Therefore, the way concentration of extracts is expressed has important consequences in ranking species by their effectiveness. Considering only the most effec-tive species, expressing concentration by the usual plant fresh weight or plant dry weight, L. stoechas or F.
vul-gare respectively, two species known for their
phytoac-tivity, top the list. Conversely, expressing concentration in terms of extract dry weight, the pioneer, spiny but digestible legume C. villosa25,26, known to produce a
number of alkaloids, flavones, isoflavones, and pheno-lics27–29 is undoubtedly the most effective species. This is
noticeable because shoot tops instead of leaves had to be extracted, while a similar thorny legume, U. parviflorus, in which shoot tops had also to be extracted, had appro-ximately the same dry/fresh weight ratio and twice the amount of extract dry weight, but was clearly ineffective. Determining the weight of extracts is time-consuming and labour-intensive in relation to just weighing fresh plant parts or dry plant parts. However, it is clearly the most appropriate way to express extract concentration because it is the extracted materials alone and, not the extracted and non-extracted materials (as in PDW), or the latter and water (as in PFW) that are actually being assayed. Given the differences associated with the way concentration is expressed, determining extract weight is worth the additional effort, especially when implicit or explicit comparisons between sources of allelochemicals are intended.
1. Molisch, H., Der Einfluß Einer Pflanze auf die Andere.
Allelopa-thie, Gustav Fischer, Jena, 1937.
2. Weidenhamer, J. D., Morton, T. C. and Romeo. J. T., Solution volume and seed number: often overlooked factors in allelopathic bioassays. J. Chem. Ecol., 1987, 13, 1481–1491.
3. Sinkkonen, A., Modelling the effect of autotoxicity on density-dependent phytotoxicity. J. Theor. Biol., 2007, 244, 218–227. 4. Pellisier, F., Improved germination bioassays for allelopathy
5. Macías, F. A., Castellano, D. and Molinillo, J. M. G., Search for a standard phytotoxic bioassay for allelochemicals. Selection of standard target species. J. Agric. Food Chem., 2000, 48, 2512– 2521.
6. Aslani, F. et al., Variation in the phytotoxic activity of Tinospora
tuberculata extracts as influenced by solvent type and chemical
profile. Curr. Sci., 2016, 110, 228–234.
7. Dias, A. S., Pereira, I. P. and Dias, L. S., Investigating and model-ing the combined effects of pH and osmotic pressure on seed ger-mination for use in phytoactivity and allelopathic research. Plant
Biosyst., 2016, 151, 657–664.
8. An, M., Johnson, I. R. and Lovett, J. V., Mathematical modeling of allelopathy: biological response to allelochemicals and its interpretation. J. Chem. Ecol., 1993, 10, 2379–2388.
9. Weidenhamer, J. D., Hartnett, D. C. and Romeo, J. T., Density-dependent phytotoxicity: distinguishing resource competition and allelopathic interference in plants. J. Appl. Ecol., 1989, 26, 613– 624.
10. Rietveld, W. J., Phytotoxic grass residues reduce germination and initial root growth of ponderosa pine. USDA Forestry Service Research Paper, RM-153. Fort Collins, 1975.
11. Draper, N. R. and Smith, H., Applied Regression Analysis, 3rd edn, Wiley, New York, USA, 1998.
12. Robinson, A. P. and Froese, R. E., Model validation using equiva-lence tests. Ecol. Model., 2004, 176, 349–358.
13. Efron, B., The Jackknife, the Bootstrap and other Resampling
Plans, Society for Industrial and Applied Mathematics,
Philadel-phia, USA, 1982.
14. Ury, H. K., A comparison of four procedures for multiple compar-isons among means (pairwise contrasts) for arbitrary sample sizes.
Technometrics, 1976, 18, 89–97.
15. Evenari, M., Germination inhibitors. Bot. Rev., 1949, 15, 153– 194.
16. Chou, C. H. and Young, C. C., Effects of osmotic concentration and pH on plant growth. Taiwania, 1974, 19, 157–165.
17. Angelini, L. G., Carpanese, G., Cioni, P. L., Morelli, I. Macchia, M. and Flamini, G., Essential oils from Mediterranean Lamiaceae as weed germination inhibitors. J. Agric. Food Chem., 2003, 51, 6158–6164.
18. Bagavathy, S. and Xavier, G. S. A., Effects of aqueous extract of
Eucalyptus globulus on germination and seedling growth of
sor-ghum. Allelopath. J., 2007, 20, 395–401.
19. Demetzos, C., Angelopoulou, D. and Perdetzoglou, D., A compar-ative study of the essential oils of Cistus salviifolius in several populations of Crete (Greece). Biochem. Syst. Ecol., 2002, 30, 651–665.
20. Andrade, D., Gil, C., Breitenfeld, L., Domingues, F. and Duarte, A. P., Bioactive extracts from Cistus ladanifer and Arbutus unedo.
Ind. Crop Prod., 2009, 30, 165–167.
21. Asllani, U., Chemical composition of Albanian myrtle oil (Myrtus
communis L.). J. Essent. Oil Res., 2000, 12, 140–142.
22. Lebreton, P. and Gallet, C., Les communautés végétales sont bio-chimiquement organisées. Acta Bot. Gallica, 2007, 154, 573–595. 23. Iason, G. R. et al., Plant secondary metabolite polymorphisms and
the extended chemical phenotype. In The Ecology of Plant
Sec-ondary Metabolites. From Genes to Global Processes (eds Iason,
G. R., Dicke, M. and Hartley, S. E.), Cambridge University Press, Cambridge, UK, 2012, pp. 247–268.
24. Bagnoli, F., Fineschi, S. and Loreto, F., Volatile isoprenoids and abiotic stress. In The Ecology of Plant Secondary Metabolites.
From Genes to Global Processes (eds. Iason, G. R., Dicke, M. and
Hartley, S. E.), Cambridge University Press, Cambridge, UK, 2012, pp. 101–119.
25. Ammar, H., López, S. and González, J. S., Assessment of the digestibility of some Mediterranean shrubs by in vitro techniques.
Anim. Feed Sci. Technol., 2005, 119, 323–331.
26. Arroyo, J., Aparicio, A., Albaladejo, R. G., Muñoz, J. and Braza, R., Genetic structure and population differentiation of the Medi-terranean pioneer spiny broom Calicotome villosa across the Strait of Gibraltar. Biol. J. Linn. Soc., 2008, 93, 39–51.
27. Harborne, J. B., Chemosystematics of the Leguminosae. Flavonoid and isoflavonoid patterns in the tribe Genisteae. Phytochemistry, 1969, 8, 1449–1456.
28. Dessí, M. A. et al., Antioxidant activity of extracts from plants growing in Sardinia. Phytother. Res., 2001, 15, 511–518. 29. Pistelli, L., Fiumi, C., Morelli, I. and Giachi, I., Flavonoids from
Calicotome villosa. Fitoterapia, 2003, 74, 417–419.
ACKNOWLEDGEMENT. We thank Maria Gertrudes Grenho for technical assistance.
Received 21 March 2017; revised accepted 24 May 2018 doi: 10.18520/cs/v115/i5/904-909
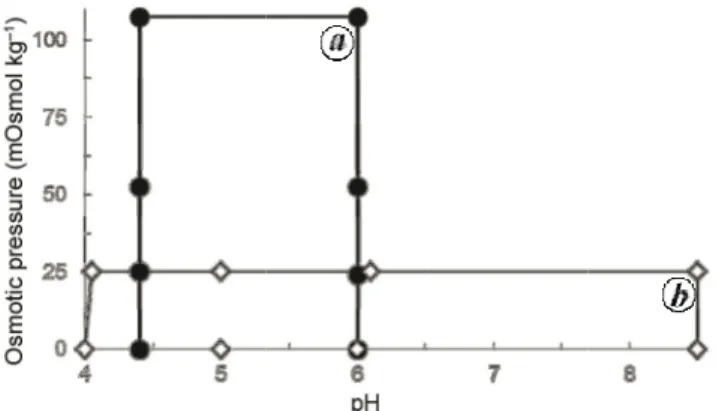
Figure bration closed c delimite assayed Figure 2 teen Me weight ( All ratio
S
1 Schematics o surfaces for La circles, used to fi ed by open diam in this work. 2. Plot of the r editerranean-type (open circles), a os expressed as pSuppleme
of range of pH a actuca sativa cv it calibration sur onds, the new corelationship betw e shrubs and tr and (b) the ratio percentages. Fv i
entary In
and osmotic pres v. ‘Rainha de M face in Dias et a ombinations of p
ween the ratio pla ees and (a) the dry weight of e indicates the loca
formation
ssure-values (ψπ Maio’ seed germ al., Plant Biosyst pH- and ψπ-valu
ant dry weight/pl e ratio dry weig extract/plant dry ation of Foenicu
n
π) investigated to mination. a, delim t., 2016, 151, 657 ues found in extrlant fresh weight ght of extract/pl y weight (closed ulum vulgare. o fit cali-mited by 7–664; b, racts bio-t of nine-ant fresh d circles).
shoot tops. Dry matter concentration and dry extract concentration correspond to the larger concentration of fresh material (100 mg ml–1)
Dry matter Dry extract
concentration concentration
Species Family Habit (mg·ml–1) (mg ml–1)
Pistacia lentiscus L. Anacardiaceae Tree or shrub 48.9 4.5
Foeniculum vulgare Mill. Apiaceae Shrub 16.3 6.2
Cistus crispus L. Cistaceae Shrub 35.1 7.1
Cistus ladanifer L. Cistaceae Shrub 41.3 6.5
Cistus monspeliensis L. Cistaceae Shrub 35.9 6.6
Cistus salviifolius L. Cistaceae Shrub 32.0 7.6
Arbutus unedo L. Ericaceae Shrub or tree 44.5 5.1
Calicotome villosa (Poir.) Link Fabaceae Shrub 41.2 3.8
Ulex parviflorus Pourr. Fabaceae Shrub 45.7 7.3
Quercus coccifera L. Fagaceae Shrub 55.8 3.0
Quercus ilex L. Fagaceae Tree 55.8 4.7
Quercus suber L. Fagaceae Tree 50.4 1.4
Lavandula stoechas L. Lamiaceae Shrub 33.1 10.2
Rosmarinus officinalis L. Lamiaceae Shrub 34.4 7.9
Eucalyptus globules Labill. Myrtaceae Tree 38.8 6.5
48.5 3.7
Myrtus communis L. Myrtaceae Shrub 45.0 8.2
Olea europaea L. Oleaceae Tree 46.2 8.1
Phillyrea angustifolia L. Oleaceae Shrub 48.6 11.0
Daphne gnidium L. Thymelaeaceae Shrub 35.1 10.4
Names and authorities according to The Plant List 2013, Version 1.1 released September 2013, http://www.theplantlist.org (accessed 4 May 2015). In Eucalyptus globulus the first line refers to young leaves, the second to mature leaves.
Table 2. pH and osmotic pressure (ψπ) of treatments, and values (means ± SE) of seed germination of Lactuca sativa cv. ‘Rainha de Maio’. All means with n = 4
pH ψπ (mOsmol kg–1) Germination (%) 4.0 0.0 96.0 ± 1.6 4.05 25.0 95.0 ± 1.9 5.0 0.0 90.0 ± 3.5 25.0 93.0 ± 1.0 6.0 0.0 98.0 ± 1.2 6.1 25.0 97.0 ± 1.0 8.5 0.0 94.0 ± 3.5 25.0 90.0 ± 1.2
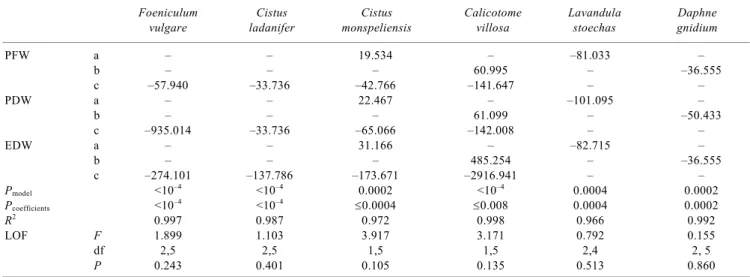
Table 3. Regression coefficients for equations fitted to the relationship between effects of extracts corrected for pH and osmotic pressure on per-centage of seed germination of Lactuca sativa cv. ‘Rainha de Maio’ and extracts concentration expressed as plant fresh weight·volume–1 (PFW), plant dry weight·volume–1 (PDW), and extract dry weight·volume–1 (EDW)
Foeniculum Cistus Cistus Calicotome Lavandula Daphne
vulgare ladanifer monspeliensis villosa stoechas gnidium
PFW a – – 19.534 – –81.033 – b – – – 60.995 – –36.555 c –57.940 –33.736 –42.766 –141.647 – – PDW a – – 22.467 – –101.095 – b – – – 61.099 – –50.433 c –935.014 –33.736 –65.066 –142.008 – – EDW a – – 31.166 – –82.715 – b – – – 485.254 – –36.555 c –274.101 –137.786 –173.671 –2916.941 – – Pmodel <10–4 <10–4 0.0002 <10–4 0.0004 0.0002 Pcoefficients <10–4 <10–4 ≤0.0004 ≤0.008 0.0004 0.0002 R2 0.997 0.987 0.972 0.998 0.966 0.992 LOF F 1.899 1.103 3.917 3.171 0.792 0.155 df 2,5 2,5 1,5 1,5 2,4 2, 5 P 0.243 0.401 0.105 0.135 0.513 0.860
All concentrations were normed so that the highest is unity. The general equation is Y = aX + bX2 + cX3, with Y being corrected effects, and X being normed concentrations. Also shown are significance levels of fitted models, the larger significance level of coefficients, coefficients of determina-tion (R2), and F-values, degrees of freedom (df) and significance levels of lack of fit tests (LOF).