IoT applied to environmental monitoring in
oysters’ farms
Vítor Viegas
2,6, J. M. Dias Pereira
1,6, Pedro Girão
4,6, Octavian Postolache
5,6, Ricardo Salgado
3,71ESTSetúbal/IPS, Instituto Politécnico de Setúbal, Setúbal, Portugal 2ESTSetúbal/IPS-CDP2T, Instituto Politécnico de Setúbal, Setúbal, Portugal 3ESTSetúbal/IPS-CINEA, Instituto Politécnico de Setúbal, Setúbal, Portugal
4Instituto Superior Técnico, Universidade de Lisboa, Lisboa, Portugal 5ISCTE-Instituto Universitário de Lisboa, Lisboa,
6Instituto de Telecomunicações, Lisboa, Portugal
7LAQV, REQUIMTE – Faculdade de Ciências e Tecnologia, Universidade NOVA de Lisboa, Caparica, Portugal
Email: vitor.viegas@estsetubal.ips.pt
Abstract – Nowadays, the aquaculture of oysters represents an important economical activity in coastal and estuarine areas. It is known that the growth rate of oysters is affected by several water parameters, including temperature, salinity, turbidity, pH and dissolved oxygen. In this paper, a cloud-based platform is proposed to acquire water parameters that affect oysters' growth. The paper includes the hardware and software description of the measurement system, details about the storage and processing of the acquired data, and some experimental results about the above-mentioned parameters.
Keywords – oyster aquaculture, environmental monitoring, IoT, cloud storage, telemetry.
I. INTRODUCTION
Several studies prove that the variation in water parameters, namely in terms of nutrients [1][2], temperature, salinity [3] and turbidity, among others, affect the growth rate of oysters, the reproductive oyster cycle, and the quality of the final product to be commercialized. The oyster production in tanks, under extensive production regimes, uses the renewal action of the tides to control the quality of the water. It is important to conduct online monitoring to manage the water inside the tanks to decide about the opening or closing of the water inlets in the tanks.
In seasonal variation studies, the temperatures and salinities in the tanks tend to increase during the warm months, and to decrease in the cold months, in part due to the raining [4]. The increase in temperature and salinity tends to generate more mortality of oysters, but, at the same, time it allows higher growth rates due to the high amount of food availability. In the cold months, growth rates are lower, but, in general, there is less mortality during this period. The high turbidity of the water can be responsible for the creation of a small sediment layer (e.g. fouling) in the oyster shell [5] and along the structures (e.g.
bags). With algae growth (e.g. biofouling) [6], the transference of dissolved oxygen and the amount of food from the water is reduced, thus affecting the oyster growth.
This paper presents a cloud-based platform to collect temperature, conductivity and turbidity from aquaculture systems. Regarding conductivity, it is important to normalize measurements to a reference temperature, usually equal to 25 ºC [7][8][9]. Otherwise, it wouldn’t be possible to distinguish measurement variations caused by conductivity from measurement variations caused by temperature. It is important to refer that water salinity contents related with the mass of dissolved salts in a given mass of the solution, that is usually expressed in parts per thousand (ppt), can also be obtained from the conductivity measurements [10].
Regarding turbidity, it is important to refer that oysters grow faster in areas where nutrients (nitrogen and phosphorus) are present, responsible for phytoplankton growth, and where suspended solids are in low concentrations. Thus, low turbidity water, with values typically bellow 8 NTU, are associated with potential oyster growing areas [11][12][13]. Furthermore, very high turbidity values can alter trophic interactions that can result in predation rate increase [14].
The third parameter that was considered as an influence parameter related with oysters' growth is water temperature. Several experimental results show that temperature is the most significant parameter that correlates with oyster growth [15]. Oysters' growth rate increases with temperature as long as its value does not affect negatively oxygen levels [16].
The proposed measurement system, besides the sensor and signal conditioning units, includes a data server hosted in the cloud that assures data storage and availability. Communications between the sensing units and the data server will be done through a public 4G wireless link. Remote clients will be able to connect to the data server to visualize data, configure warning and alarm messages, and program other types of event-handling procedures.
Finally, it should be underlined that the proposed system can be extended to perform measurements of other quantities, related with other types of aquaculture, distributed over tanks located anywhere in the world.
The paper is organized as follows: section II presents the architecture of the measurement system; section III discusses experimental results; and section IV extracts conclusions and suggests future work.
II. MEASUREMENT SYSTEM
This section presents the overall architecture of the measurement system, focusing on the requirements of the application rather than in specific implementation details.
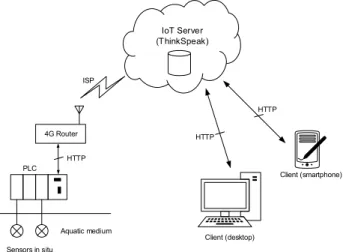
The architecture, shown in Fig. 1, includes five main components described as follows:
1. Sensors: Sensors are the primary element of measurement. The application requires a turbidity sensor (with a range from 0 to 400 NTU), a conductivity sensor (with a range from 0 to 60 mS/cm), and a temperature sensor (with a range from +5 to +40 C). All sensors shall have an accuracy better than 2% of the full scale (FS), and a 4-20 mA output signal that varies linearly as a function of the measurand.
2. Programmable logic controller (PLC): The PLC is responsible for acquiring the sensed variables and for transferring the data to the cloud. Given the slowness of the variables, the sampling rate can be adjusted from 1 sample every 15 seconds to 1 sample every hour, in steps of 15 seconds. Long sampling periods are advisable to reduce the power consumption and the amount of data uploaded to the cloud. The PLC can also run pre-processing routines, including the correction of measurements as a function of temperature, or the extraction of mathematical parameters related with the sensed data. The PLC shall have an Ethernet connection to upload data to the cloud (mandatory).
3. 4G router: The router provides internet connectivity over a 4G wireless link. The conversion between the two domains, wired and wireless, is transparent to the PLC as it only “sees” an ordinary TCP/IP connection. The 4G wireless link shall be provided by a commercial internet service provider (ISP) under the payment of a monthly fee. Data shall be transferred to the IoT server using the ThingSpeak application programming interface (API) supported over the HTTP protocol.
4. IoT server: The IoT server shall act as the repository of the uploaded data. The server shall be hosted in the ThingSpeak infrastructure [17], which was chosen by three main reasons: first, it is free as long as the number of messages is less 8333 per day (as it is expected); second, it is supported by a well-known, well-reputed company (Mathworks); and third, it supports Matlab analytics for future extensions. This approach
guarantees free data logging on a robust server, with fixed internet address and zero maintenance costs. 5. Remote clients: Remote clients connect to the IoT
server to visualize the stored data, configure notifications and program event handling routines. All accesses shall be done through the ThingSpeak API supported over the HTTP protocol. Security mechanisms shall be implemented to secure the access and transfer of the data.
A basic client shall allow the visualization of the last values of the variables up to seven days before the present date. Two types of visualization shall be provided, table and graph, with the possibility to export values to a tab-separated-value (TSV) file. Email notifications shall be fired to pre-defined recipients if one of the variables exceeds a given threshold during, at least, one hour.
The first three components (sensors, PLC and 4G router) are to be installed in situ, in the aquaculture facility located in the Sado river or the Mira river. The remaining components (IoT server and clients) may be anywhere in the world.
Fig. 1. Architecture of the measurement system.
III. EXPERIMENTAL RESULTS
This section presents a pilot system inspired in the architecture shown in Fig. 1, and describes the tests made to assess its behavior.
A. Pilot System
The pilot tries to fit the requirements of the measurement system using low-cost components:
Turbidity sensor: model SEN0189 from DFRobot [18] with an estimated cost of 10 USD. Other characteristics include: supply voltage = +5 VDC, supply current < 40 mA, response time < 500 ms, range between 0 and 3000 NTU, analog output between 0 and +4.5 V, relation between turbidity in NTU (TU) and the output voltage in volt (U) given by the following equation:
4G Router PLC HTTP IoT Server (ThinkSpeak) ISP Sensors in situ Aquatic medium Client (desktop) Client (smartphone) HTTP HTTP
𝑇𝑈 = −1120.4𝑈 + 5742.3𝑈 − 4352.9 (1) Conductivity sensor: model DFR0300 from DFRobot
[19] with an estimated cost of 100 USD. Other characteristics include: supply voltage = +5 VDC, range between 1 mS/cm and 20 mS/cm, operating temperature between +5 C and +40 C, analog output between +0.15 V and +3.3V, relation between the conductivity in S/cm (σ) and the output voltage in millivolt (U) given by the following equations: 𝑈 =
. ( ) (2)
𝜎 = −0.0005𝑈 + 7.665𝑈 − 222.08 (3) where equation (2) is needed to normalize measurements to a reference temperature (T) equal to 25 ºC.
Temperature sensor: model DS18B20 from Maxim [20] with no added cost since it is included in the conductivity kit. Other characteristics include: supply voltage = +5 VDC, range between -10 C and +85 C, accuracy = 0.5 C, digital 1-Wire interface.
PLC: model M-DUINO-19R from Industrial Shields [21] with an estimated cost of 300 USD. Other characteristics include: supply voltage = +24 VDC, 4 analog 10-bit inputs, 3 analog 10-bit outputs, 2 digital inputs, 8 relay outputs, 8 kb program capacity (SRAM), based on the ATmega2560 microcontroller, Ethernet connectivity, compatible with the Arduino integrated development environment (IDE).
4G router: model B310 from Huawei [22] with an estimated cost of 40 USD.
The turbidity and conductivity sensors are low-cost equipment used for demonstration purposes only. According to sensors’ documentation, an accuracy no better than 5 %FS should be expected. The Arduino-based PLC is interesting because it is open source, both in terms of hardware and software.
The total cost of the pilot system, considering the listed items plus power supplies, wiring and assembling, will be around 500 USD. The PLC is the most expensive item because it has a robust casing, suitable for the final application.
A free data channel, named OSTRAQUAL, was created in the IoT server. The channel has three fields, one for each sensed variable, and is associated to the oyster farm located in latitude = +38.563281 and longitude = -8.748727. The channel can be accessed using the following primitives from the REST API:
To update a field of the channel:
https://api.thingspeak.com/update.json?api_ key=<write_api_key>&field<n>=<data>
where <write_api_key> is a private key that identifies the OSTRAQUAL channel, <n> identifies the field (1, 2 or 3 referring to turbidity, conductivity or temperature, respectively), and <data> is the content to be written. To read values from a field of the channel:
https://api.thingspeak.com/channels/504698/ fields/<n>.json?api_key=P6D5PRY9DDZE0K8D&re sults=<m>
where 504698 identifies the OSTRAQUAL channel, <n> identifies the field (from 1 to 3), P6D5PRY9DDZE0K8D is a public reading key, and <m> is the number of the last records to be read.
The REST API is quite rich and allows many other ways to upload and download data to and from the OSTRAQUAL channel. More information about the REST API can be found in [23].
A. Experimental Results
The pilot system was mounted with the turbidity sensor connected to analog input 0 (A0), the conductivity sensor connected to analog input 1 (A1) and the temperature sensor connected to digital pin 2. Turbidity and conductivity sensors are accessed very easily by calling the
analogRead() function, while the temperate sensor is accessed using the 1-Wire library for Arduino.
The PLC was programmed to acquire one sample per second for each variable. On every minute, the collected samples are averaged (60 samples per variable), equations (1-3) are computed, and the resulting values of turbidity (TU), conductivity (σ) and temperature (T) are uploaded to the IoT server. Communications with the 4G router are supported by the Ethernet library for Arduino.
Fig. 2 shows the turbidity, conductivity and temperature measured by the pilot system when inserting the turbidity probe into a standard solution with 1000 NTU, and the conductivity probe into a standard solution with 12.88 mS/cm. The plots have 60 values, one per minute, covering one hour.
The turbidity measurements have a mean value equal to 968 NTU with a standard deviation equal to 20 NTU, leading to an uncertainty equal to 72 NTU 2.4 %FS. The conductivity values, in turn, have a mean value equal to 12726 S/cm and a standard deviation equal to 7 S/cm, leading to an uncertainty equal to 168 S/cm 0.84 %FS. These values are exceptionally good taking into account the modest specifications of the sensors. During the tests, the IoT server worked as expected with no service failures.
(a)
(b)
(c)
Fig. 2. Plots of the sensed variables: a) turbidity; b) conductivity; and c) temperature.
IV. CONCLUSIONS
The paper presented a cloud-based measurement system intended to monitor several water parameters that affect the growth of oysters, namely turbidity, conductivity and temperature. The system acquires samples at a periodic rate and uploads the data to a IoT server hosted in the ThingSpeak infrastructure. This approach provides free data storage on a robust server, with fixed internet address and zero maintenance costs.
A pilot system was built as a proof of concept. The pilot was successful in acquiring data from the sensors and in uploading it to the IoT server. The pilot doesn’t meet all the requirements of the final application, but it was useful to see how the proposed architecture behaves.
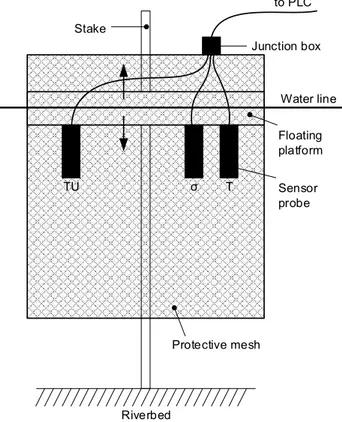
As future work, we intend to use industry-grade sensors with better specifications and rugged cases. The new sensors shall be mounted on a floating platform that will move vertically, along a stake fixed on the riverbed, following the tides, as shown in Fig. 3. The new sensors shall have 4-20 mA interfaces to carry power and data at high distances (tens or hundreds of meters). The PLC shall be placed onshore, together with the 4G router, all powered by a solar energy system equipped with backup batteries.
Fig. 3. Installation of the sensors in the aquatic environment.
V. ACKNOWLEDGMENT
The authors acknowledge to the project “OSTRAQUAL – Enhancing and promoting the oyster aquaculture quality in Sado and Mira region”, ref. 023838/SAICT/02/2016, for the financial support given by POR Lisboa, POR Alentejo 2020 and POR CRESC Algarve 2020 under FEDER, and by Fundação para a Ciência e Tecnologia.
REFERENCES
[1] Arnaud Muller-Feuga, “The role of microalgae in aquaculture: situation and trends”, Journal of Applied Phycology, Volume 12, Issue 3–5, pp 527–534, October 2000.
[2] J.R. Benemann, “Microalgae aquaculture feeds”, J. appl. Phycol. 4: 233-245, 1992.
[3] Nicholas E. Raya, Ji Lia, Patrick C. Kangas, Daniel E. Terlizzi, “Water quality upstream and downstream of a commercial oyster aquaculture facility in Chesapeake Bay”, Aquacultural Engineering 68, 35–42, USA 2015.
Riverbed Stake Water line Floating platform TU σ T Protective mesh to PLC Junction box Sensor probe
[4] Sandra Casas, William Walton, Glen Chaplin, Scott Rikard, John Supan, Jerome La Peyre1, “Performance of oysters selected for dermo resistance compared to wild oysters in northern Gulf of Mexico estuaries”, Aquacult Environ Interact 9: 169–180, 2017.
[5] Barrie M. Forrest, Nigel B. Keeley, Grant A. Hopkins, Stephen C. Webb, Deanna M. Clement, “Bivalve aquaculture in estuaries: Review and synthesis of oyster cultivation effects”, Aquaculture 298 (2009) 1–15. [6] Elise Lacoste, Gilles Le Moullac b, Peva Levy b, Yannick
Gueguen b, Nabila Gaertner-Mazouni, “Biofouling development and its effect on growth and reproduction of the farmed pearl oyster Pinctada margaritífera”, Aquaculture 434 (2014) 18–26.
[7] T. S. Light, “Temperature Dependance and Measurement of Resistivity of Pure Water”, Analytical Chemistry, 56, 1138, 1984.
[8] “Standard Test Methods for Electrical Conductivity and Resistivity of Water”, American Society for Testing and Materials, D1125-95.
[9] Pedro M. Ramos, M. Dias Pereira, H. Geirinhas Ramos, A. Lopes Ribeiro, “A Four Terminal Water Quality Monitoring Conductivity Sensor”, IEEE Transactions on Instrumentation and Measurement. Vol.57, No.3, pp. 577-583, May 2008.
[10] A. S. Bennett, “Conversion of in situ measurements of conductivity to salinity”, Elsevier, Deep Sea Research and Oceanographic Abstracts, Volume 23, Issue 2, pp. 157-165, February 1976.
[11] Jordan Snyder, Emmanuel Boss1, Ryan Weatherbee, Andrew C. Thomas, Damian Brady and Carter Newell, “Oyster Aquaculture Site Selection Using Landsat 8-Derived Sea Surface Temperature, Turbidity, and Chlorophyll A”, Science and Applications of Coastal Remote Sensing, Volume 4, pp. 1-11, June 2017.
[12] T. K. Barnes, A. K. Volety, K. Chartier, F. J. Mazzotti and L. Pearlstine, “A habitat suitability index model for the eastern oyster (Crassostrea virginica), a tool for restoration of the Caloosahatchee Estuary”, Florida. J. Shellfish Res. 26, pp. 949–959, 2007.
[13] E. E. Hofmann, E. N. Powell, J. M. Klinck and E.A. Wilson, “Modeling Oyster Population III. Critical Feeding Periods, Growth and Reproduction”, Journal of Shellfish research, Vol. 11, No. 2, pp. 399-416, 1992.
[14] Jessica Lunt and Delbert L. Smee, “Turbidity influences trophic interactions in estuaries”, Limnol. Oceanogr., 59(6), pp. 2002-2012, 2014.
[15] G. Sarinsky, M. A. Carroll, E. Nduka, E. J. Catapane, “Growth and Survival of the American Oyster Crassostrea virginica in Jamaica Bay, New York”, 27(1), pp. 15-26, In Vivo (Brooklin), 2005.
[16] M. L. De Casabianca T. Laugier and E. Marinho-Soriano, “Seasonal changes of nutrients in water and sediment in a Mediterranean lagoon with shellfish farming activity (Thau Lagoon, France)”, ICES Journal of Marine Science, Volume 54, Issue 5, 1, pp. 905-916, October 1997.
[17] “ThingSpeak”, https://www.mathworks.com/help/ thingspeak/index.html (accessed on May 27, 2018). [18] “Turbidity sensor SKU: SEN0189”,
https://www.dfrobot.com/wiki/index.php/Turbidity_sensor _SKU:_SEN0189 (accessed on May 27, 2018).
[19] “Analog EC Meter SKU:DFR0300”, https://www.dfrobot.com/wiki/index.php/Analog_EC_Met er_SKU:DFR0300 (accessed on May 27, 2018).
[20] “DS18B20 – Programmable Resolution 1-Wire Digital Thermometer”, https://www.maximintegrated.com/en/ products/sensors/DS18B20.html (accessed on May 27, 2018).
[21] “Ethernet PLC – M-DUINO PLC Arduino Ethernet 19R I/Os Relay / Analog / Digital PLUS”, https://www.industrialshields.com/product/m-duino-plc-arduino-19r-ios-relay-analog-digital-plus/ (accessed on May 27, 2018).
[22] “HUAWEI LTE CPE B310”, https://consumer. huawei.com/en/smart-home/b310/ (accessed on May 27, 2018).
[23] “REST API”, https://www.mathworks.com/help/ thingspeak/rest-api.html (accessed on May 27, 2018).