M
ASTER IN
F
INANCE
M
ASTER
’
S
F
INAL
W
ORK
D
ISSERTATION
TESTING THE RANDOM WALK HYPOTHESIS IN THE
P
ORTUGUESE STOCK MARKET
G
ONÇALO
F
ILIPE
R
ODRIGUES
A
LVES
ii
M
ASTER IN
F
INANCE
M
ASTER
’
S
F
INAL WORK
D
ISSERTATION
TESTING THE RANDOM WALK HYPOTHESIS IN THE
P
ORTUGUESE STOCK MARKET
G
ONÇALO
F
ILIPE
R
ODRIGUES
A
LVES
S
UPERVISOR:
P
ROFESSORJ
OÃOB
ASTOSiii
TESTING THE RANDOM WALK HYPOTHESIS IN THE
P
ORTUGUESE STOCK MARKET
By Gonçalo Alves
Abstract
This paper investigates the efficiency of the eighteen stocks that constitute the main
Portuguese stock index, the PSI-20 of the Lisbon Stock Exchange. Tools used for the
investigation were daily and monthly data from January 1999 to May of 2015, using the
Augmented Dickey-Fuller (ADF) test, the automatic variance ratio by Choi and the
individual and multiple variance ratios, by Lo and Mackinlay and Chow-Denning,
which test the efficiency of the eighteen stocks and PSI-20 index. The Augmented
Dickey-Fuller (ADF) tests the null hypothesis that the series has a unit root, while the
variance ratio tests the random walk hypothesis. Based on these tests, the results provide
mixed evidence against the random walk hypothesis. The results for the unit root tests
do not reject the efficient market hypothesis for the entire sample, while the results from
the variance ratio tests do, but tend to decrease in monthly data.
Keywords: Random walk hypothesis; Stock market efficiency; Variance ratio tests; Unit root test; Euronext Lisbon.
iv
Contents
1. Introduction ... 1 2. Literature review ... 3 3. Theoretical framework ... 6 4. Methodology ... 74.1 Choice of the subject ... 7
4.2 Unit root test ... 7
4.3 Individual Variance Ratio Test by Lo and Mackinlay (1988) ... 8
4.4 Multiple variance ratio test by Chow and Denning (1993) ... 11
4.5 Automatic VR by Choi (1999) ... 12
5. Empirical analysis and Results ... 14
5.1 Data ... 14
5.2 Results ... 17
5.2.1 Unit Root tests ... 17
5.2.2 Individual Variance Ratio tests by Lo and Mackinlay (1988) ... 18
5.2.3 Multiple variance ratio tests by Chow and Denning (1993) ... 21
5.2.4 Automatic Variance Ratio tests by Choi (1999) ... 22
6. Conclusions ... 24
v
List of Tables
Table I- Descriptive statistic for the eighteen Portuguese stocks and also for PSI-20
index. ... 16
Table II- ADF test for the eighteen Portuguese stocks and also for PSI-20 index for
daily prices. ... 18
Table III- Individual Variance Ratio tests by Lo and Mackinlay for the eighteen
Portuguese stocks and also for PSI-20 index. ... 20
Table IV - Multiple variance ratio tests by Chow and Denning for the eighteen
Portuguese stocks and also for PSI-20 index. ... 21
Table V - Automatic Variance Ratio tests for the eighteen Portuguese stocks and also
for PSI-20 index, for daily and monthly prices. ... 23
Table VI- Summary of test results for the random walk hypothesis. Daily and monthly
1
1. Introduction
The theory of efficiency markets is extremely important in finance since the hypothesis
of securities markets represent the origin of most of the research that is made in this
field.
The efficient market hypothesis (EMH) in its weak form, (Fama, 1970) is a market in
which the price of any financial asset fully reflects all the available information.
If a market is efficient, asset prices exhibit unpredictable movements. In such a market,
the use of all the available information does not allow any investor to consistently
obtain an unusual return. However, if a market is not efficient, asset prices indicate to
have long memory, therefore those prices are not completely random. In this type of
market the technical analysis has shown that it is possible to predict and identify trends
to achieve abnormal returns.
The random walk hypothesis has strong implications in financial theories and
investment strategies. For example, the trading strategies will be different when returns
are characterized by random walks or by positive autocorrelations (or persistence) over
short horizons and negative autocorrelations (or mean reversion) over long horizons.
In this work, we analyze the efficiency of the Portuguese market, by performing tests of
the random walk hypothesis (RWH), including the Augmented Dickey-Fuller (ADF),
the automatic variance ratio, the individual variance ratio test by Lo and Mackinlay and
the multiple variance ratio tests by Chow and Denning. The use of variance ratios (VR),
tests can be very important in order to test the alternative hypothesis of random walk
2
Unlike earlier works concerning Portuguese markets, this study is about the eighteen
stocks that make up the PSI-20 index, which differ from others studies about the
Portuguese Index. One of the most complete works done in Portugal was performed by
Dias et al. (2002), with daily data of the PSI-20 index from January 1993 to September
2001. They find strong evidence in support of the random walk hypothesis given by an
Augmented Dickey-Fuller (ADF) test.
There is a publication that tests the random walk hypothesis (RWH) of the PSI-20's
stocks (Gonzaga and Sebastião, 2012). However, changes in this index have occurred
since then, such as the bankruptcy of Banco Espirito de Santo in 2014, and the fact that
other companies were delisted. In addition, some companies joined the index as a result
of privatizations that Portuguese government implemented (CTT or Banif, are an
example).
The remainder of this work is organized as follows: Section 2 reviews the literature of
market efficiency; Section 3 describes the theoretical framework; Section 4 explains the
methodology; Section 5 describes the data and reports the empirical results; Section 6
3
2. Literature review
The notion of efficient market hypothesis (EMH) was developed by Paul A. Samuelson
(1965) and Eugene Fama (1965). Both authors argue that in a completely informational
efficient market, the prices should be unpredictable, since this market incorporates all
available information and expectations of all market participants. Fama (1970) wrote a
paper that focuses on three forms of EMH, the weak, semi-strong and strong forms of
efficiency. Each one, in different ways, test the predictability of security returns on the
basis of past price changes.
The interest on EMH still continues nowadays by academics, searching for a better
understanding of the price generation processes, and investors seeking investments that
yield higher returns. In the last decade, some authors have argued that the EMH clearly
no longer enjoy the level of strong support that was received during the golden era of
1970s. Nascimento (2007) says that until the end of 1970, most of the empirical results
were consistent with EMH. In contrast, in the decade of the 80s there were many
studies about the rejection of the random walk hypothesis (RWH).
Lo and Mackinlay (1988) developed the variance test and conclude that, despite
individual stocks appearing to follow a random walk, the RWH is rejected by weekly
data of US indices from 1962 to 1985. Particularly, Lo and Mackinlay (1988) find that
variances grow faster than linearly as the holding period increases, implying positive
serial correlations in weekly returns.
Chow and Denning (1993) proposed a multiple test alternatively to variance ratio (VR)
4
customary to calculate the VR test for various time periods and simply reject the
hypothesis for a single period to reject the RWH.
Since the seminal work of Lo and Mackinlay (1988) the variance ratio test has emerged
as the primary tool for testing whether stock return series are serially uncorrelated. The
variance ratio test is based on the statistical property that if the stock price follows a
random walk, then the variance of the k-period return is equal to k times the variance of
the one-period return. The variance ratio should be equal to one for any k-period, under
the null hypothesis of serially uncorrelated stock returns.
This literature has continued to grow over the last years albeit at a slower pace, with
greater emphasis on emerging stock markets. A few examples of those studies are made
by Squally (2006) and Moustafa (2004) for the United Arab Emirates stock market.
Other studies were performed in South America (Charles and Darné, 2009) in Europe
(Smith, 2003; M. Borges, 2010) and in Africa (Al-Khazali et al. 2007). The results from
VR tests consistently show that most of the emerging markets are inefficient on the
weak-form.
Some studies about the random walk hypothesis in the Portuguese stock market were
made, possibly when it was very "immature". Gama (1998) and Smith and Ryoo (2003)
used VR test to conclude that the Portuguese stock market was inefficient on the weak
form until 1998. Borges (2010) used daily, weekly and monthly data of the PSI-20
index, for the period from January 1 of 1993 to 31 of December of 2006, to find strong
correlation on the daily returns. This correlation might decrease on the weekly and
monthly data. Dias et al. (2002) arrived at the same conclusion for the period between
January 1993 and September 2001 using serial correlation tests and VR tests. Although
Dickey-5
Fuller (ADF) test. Another work that involved the PSI20 index and the twenty stocks,
that at the time incorporated this index, was made by Gonzaga and Sebastião (2012).
They used daily and weekly data, from 1987 to June of 2010 that was analyzed with
serial correlations tests, variance ratio tests and also run tests. The main conclusion was
that only during the last three years of their observation (2008-2010) the tests regarding
the random walk does not reject the hypothesis of efficiency for the majority of the
6
3. Theoretical framework
The market efficiency has been under debate for a long time. The main reason of EMH
focus on the market capacity to reflect all available information and how that
information is replicated in stocks prices. Under the EMH, the information is equal to
all the participants, indicating that we cannot use historical prices to estimate future
returns. Therefore, investors cannot achieve abnormal returns by buying undervalued
stocks or selling inflated stocks.
Fama (1970) classify three forms of efficiency: weak-form, semi-strong and
strong-form. He formulates three conditions for market efficiency when the current price of a
security reflects all available information:
- There are no transactions cost - All available information is costless
- All agree on the implications of current information for the current price and the distributions of future prices of each security
The weak-form of efficiency states that stock prices already reflect all available
information contained in the historical prices. The semi-strong form states that the stock
prices already reflect all publicly available information. The strong-form states that
7
4. Methodology
In this section we describe the approach to be followed along with the tests to be used in
our study.
4.1 Choice of the subject
The Portuguese stock market has a large volatility to all the Euro zone news; for
example, the latest news regarding Greek economical issues, penalize more strongly the
Portuguese stock market than other European stock market. With higher volatility in the
markets, traders can earn higher profits from their portfolios. Therefore we will not only
to test the market efficiency for PSI-20 index, but also for the main stocks that make the
Portuguese index.
4.2 Unit root test
The Augmented Dickey-Fuller (ADF) test is used to measure the existence of a unit root
in a time series sample. It is an augmented version of the Dickey-Fuller test for a larger
and more complicated set of time series models. The augmented Dickey–Fuller (ADF)
statistic, used in the test, is a negative number. The more negative it is, the stronger is
the rejection of the hypothesis of having a unit root at some level of confidence.
The ADF test estimates the following equation through Ordinary Least Squares
regression (OLS):
8
Where Pt is the price at time t and , pi are coefficients to be estimated, q
is the lag order of the autoregressive process, t is the trend term, i is the estimated
coefficient for the trend, 0 is the constant and is the white noise.
The null hypothesis on test is the existence of a unit root, meaning that the time series is
not stationary. The alternative hypothesis is that the time series does not have a unit
root, and consequently is stationary. If we do not reject the null hypothesis, we also do
not reject that the time series has random walk properties.
H0: p0 = 0 (nonstationary time series)
H1: p0 < 0 (stationary time series)
To see if the time series are non stationary, we have estimated the correlation coefficient
to check if p0 = 0, based on τ (tau) statistic and in critical values estimated by
Dickey-Fuller. If the absolute value of τ is higher than the critical values, it means that the null
hypothesis is rejected.
4.3 Individual Variance Ratio Test by Lo and Mackinlay (1988)
Variance ratio tests have been widely used and are particularly useful for examining the
behavior of asset prices. These tests are based on the variance of returns and have good
size and power properties against interesting alternative hypotheses and, in this respect,
are superior to many other tests (Campbell et at., 1997).
The variance of the k-th difference scaled by k to the variance of first difference tends to
equal one, that is, the variance of the k-difference increases linearly in the observation
9
VR(k) = (2)
where σ2 (k) is 1/k the variance of the k-differencesand σ2 (1) is the variance of the first
differences that can be defined,
2
(1) = (n-1)-1 2 = (n-1)-1 )2 (3)
Lo and MacKinlay (1988), proposed for a sample size of observations :
2
(k) = m-1 2 (4)
with ). Thus, the value of m is chosen such that σ2
(k) to
be a unbiased estimator of the variance of the return of k-th period and that σ2t is
constant over the time
Lo and MacKinlay (1988) derive the asymptotic distribution of the estimated variance
ratios and suggest two test statistics, M1(k) and M2(k), under the null hypothesis of
homoskedastic increments random walk and heteroskedastic increments random walk,
respectively. If the null hypothesis is true, the associated test statistic has an asymptotic
standard normal distribution. Assuming homoskedastic increments, we have
M1(k)=
10
Where . Besides the M1(k) they also proposed a test assuming
heteroskedastic increments, the test statistic is:
M2(k) =
, N(0,1) (6)
Where under the null hypothesis, V(k)=1,
2 (7) and (j) = (8)
The procedure proposed by Lo and MacKinlay (1988) was developed to test individual
variance ratio tests for a specific k-difference, but under the random walk hypothesis,
we must have VR(k)=1 for all k.
If the returns are positively (negatively) autocorrelated, VR(k) must be higher ( lower)
by one. The series has mean reversion (level) if VR(k) is significantly less than one and
aversion to the average if VR(k) is significantly greater than one. The RWH returns
must be tested for various time intervals (lags), for k periods, as rejection for a given
11
4.4 Multiple variance ratio test by Chow and Denning (1993)
Chow and Denning (1993) had proposed a multiple variance ratio test to control the test
size. They extended Lo and Mackinlay (1988) conventional variance ratio test
methodology and form a simple multiple variance ratio test, which uses Lo and
Mackinlay test statistic.
Considering a set of variance ratio estimates, , where m corresponds to a set of pre-defined number of lag and M1(ki) and M2(ki) the statistical
tests Lo and Mackinlay (1988). Under the random walk hypothesis, we test a set of
sub-hypotheses:
H0i : for
H1i: for
Since any rejection of H0i will directly reject the RWH, it allows the maximum absolute
value of the test statistic be
12
where M1(ki) and M2(ki) are defined in equations (5) and (6), respectively.
The rejection of the null hypothesis can be based on the maximum absolute value of
individual variance ratio test statistic. The test follows a Sudentized Maximum Modulos
distribution with M and T (the sample size) degrees of freedom. When T is large, the
null hypothesis is rejected at level of significance if MV1 [or MV2] is greater than the
where .
Chow and Denning (1993) manage the size of the multiple variance ratio test by
comparing the calculated values of the standardized test statistics, also M1(ki) or M2(ki)
with the SMM critical values. Every time that the maximum absolute value of M1(ki) or
M2(ki) are greater than the critical value at a predetermined significance level, the RWH
is rejected.
4.5 Automatic VR by Choi (1999)
When implementing the VR tests, we need to choose what our holding period
(k) is. To overcome this issue, Choi (1999) proposed a data-dependent procedure to
determinate the optimal value of k automatically using an optimal data dependent
method. Choi (1999) suggested a VR based in frequencies. The VR estimator is defined
as
VR(k) = 1+2 , (9)
Where is the autocorrelation function, and h(x) is the Quadratic Spectral (QS) window defined as
13 h(x) =
(10)
The standardized statistic is
VRf =
(11)
The null hypothesis, of no serial correlation, of this test statistic follows the standard
14
5. Empirical analysis and Results
5.1 Data
Our data is daily adjusted closing prices of the eighteen Portuguese stocks that currently
form the PSI-20 index: Altri, BCP, BPI, CTT, EDP, EDP-Renewable, Galp, Impresa,
Jerónimo Martins, Mota-Engil, NOS, PT, Portucel, Ren, Semapa, Sonae and Teixeira
Duarte, and also of the PSI-20 index, which is the Portuguese benchmark index, that
reflect the evolution of the prices of the twenty largest and most liquid stocks selected
from the universe of companies listed on the Portuguese main market. The source of all
data is Datastream. The data includes different number of observations for each of the
stocks, because they initiate in different periods and finish on the 6th of May of 2015.
The oldest available date is for the PSI-20 index and reports to the 4th of January of
1999. Considering all together, it gives 16 years of data for some of the stocks.
We apply the tests to the daily closing prices and also for the monthly closing prices.
For the monthly price series, we use the observation of day 15 of each month. In case of
a missing observation on day 15, we use the day before (14), and if the day before is
also not available we use the next day (16).The returns are computed as the logarithmic
difference between two consecutive prices in a series.
Table I shows the descriptive statistic for the daily returns of the eighteen stocks and
also for the PSI-20 index. The mean return for the daily sample are between -0.49% for
the Banif and 0.54% for the Semapa. For the PSI-20 the mean return is -0.02%. The
mean standard deviation for the eighteen stocks is 0.0236 while for the PSI-20 index is
lower, with a value of 0.0119. The returns are in most stocks positive skewed, with
15
kurtosis level is highest in the whole sample indicating that the distribution of returns is
leptokurtic. The Jarque-Bera statistic rejects the hypothesis of a normal distribution for
16
Table I- Descriptive statistic for the eighteen Portuguese stocks and also for PSI-20 index.
Start End Observations Minimum Mean Maximum Std. Deviation
skewness kurtosis Jarque-bera Altri 01-03-2005 06-05-2015 2649 -0.1849 0.0013 0.7221 0.0271 7.2600 194.8210 408456** Banif 21-12-2012 06-05-2015 620 -1.2112 -0.0049 0.3118 0.0622 -11.5851 231.7230 136532** BCP 03-01-2000 06-05-2015 3996 -0.1709 -0.0007 0.2384 0.0241 0.2836 11.9767 13487.16** BPI 03-01-2000 06-05-2015 3996 -0.1398 -0.0002 0.2393 0.0218 0.8218 14.1839 21275.55** CTT 06-12-2013 06-05-2015 371 -0.0655 0.0017 0.0722 0.0176 -0.1673 5.2291 81.08** EDP 03-01-2000 06-05-2015 3996 -0.1649 0.0002 0.1315 0.0160 -0.0181 11.7802 12836.01** EDP-R 04-06-2008 06-05-2015 1768 -0.0121 0.0001 0.1358 0.0206 0.0620 7.0139 1210.21** Galp 24-10-2006 06-05-2015 2205 -0.1308 0.0006 0.2471 0.0224 0.5144 13.1829 9641.49** Impresa 06-06-2000 06-05-2015 3837 -0.1228 -0.0005 0.3244 0.0277 1.3918 15.3226 25515.07** Jeronimo Martins 03-01-2000 06-05-2015 3996 -0.1626 0.0005 0.1212 0.0207 -0.4599 10.8771 10472.12** Mota-Engil 25-01-2001 06-05-2015 3719 -0.1133 0.0003 0.1833 0.0208 0.5353 9.7640 7280.87** Nos 03-01-2000 06-05-2015 3828 -0.2269 -0.0003 0.1441 0.0217 0.0128 12.3043 14266.11** Portucel 03-01-2000 06-05-2015 3884 -0.0872 0.0005 0.1395 0.0157 0.2873 8.1871 4534.80** PT 03-01-2000 06-05-2015 3993 -0.2167 -0.0006 0.2147 0.0215 0.0475 13.6457 18894.58** Ren 10-07-2007 06-05-2015 2031 -0.1325 0.0001 0.1227 0.0140 0.0727 15.2025 12602.49** Semapa 03-01-2000 06-05-2015 3871 -0.1265 0.0054 0.1109 0.0165 0.2460 7.3518 3174.35** Sonae 03-01-2000 06-05-2015 3926 -0.2683 0.0001 0.2136 0.0219 -0.1788 13.7856 19050.46** Teixeira Duarte 16-08-2010 06-05-2015 1231 -0.1286 -0.0003 0.1823 0.0335 0.6696 6.4672 708.57** PSI-20 04-01-1999 06-05-2015 4151 -0.1038 -0.0002 0.1019 0.0119 -0.1821 9.0998 6456**
Notes: The Jarque-Bera is a normality test, which is asymptotically distributed as X2 (2), based on the sample kurtosis and skewness, under the null hypothesis of both the skewness and excess of kurtosis being zero. An ** indicates that null hypothesis rejection significance at 1% level.
17
5.2 Results
In this point, we are going to present the results for the four random walk tests utilized,
such as, unit root test, the individual variance ratio test by Lo and Mackinlay, the
multiple variance ratio test by Chow-Denning and also the automatic variance ratio
5.2.1 Unit Root tests
Table II reports the results of the ADF statistic to test the null hypothesis of a unit root
in the eighteen stocks and also for the PSI-20 index. It is important to say that we only
have done the ADF test for the daily series because in the monthly series we have, for
example, 18 observations for the CTT and with this number of observations the ADF
test has low power.
The optimal lag length for the test is chosen with Akaike info criteria, from a maximum
of 15 lags allowed, by the number of observations. The test is conducted under the
specification of an intercept and trend. In the eighteen stocks and also for the PSI-20
index, the test statistic of the ADF is less than the critical values at the 1%, 5%, and
10% significant levels.
The results support the random walk hypothesis, as the null hypothesis of the existence
of a unit-root is not rejected. These results are consistent with other studies, by Dias et
18
Table II- ADF test for the eighteen Portuguese stocks and also for PSI-20 index for daily prices.
Sample Daily prices
ADF test statistic Included observations Number of lags p-value Altri -13.434 2650 13 0.01 Banif -7.963 614 8 0.01 BCP -17.292 3995 15 0.01 BPI -14.940 3997 15 0.01 CTT -7.688 371 7 0.01 EDP -16.181 3882 15 0.01 EDP-R -12.319 1768 12 0.01 Galp -12.452 2205 13 0.01 Impresa -13.528 3838 15 0.01 Jeronimo Martins -15.422 3884 15 0.01 Mota-Engil -13.673 3720 15 0.01 Nos -13.821 3828 15 0.01 Portucel -14.242 3884 15 0.01 PT -15.832 3995 15 0.01 Ren -14.019 2032 12 0.01 Semapa -15.375 3871 15 0.01 Sonae -14.164 3927 15 0.01 Teixeira Duarte -10.901 1232 10 0.01 PSI-20 -14.145 4151 16 0.01
Notes: ADF statistic test the hypothesis, H0: unit root ; H1: there is no unit root (stationary). The model
includes constant and trend.
5.2.2 Individual Variance Ratio tests by Lo and Mackinlay (1988)
Table III reports the results of the individual variance ratios tests by Lo and Mackinlay
(1988) for the eighteen main Portuguese stocks and also for the PSI-20 stock index. In
order to make more easier the comparisons between other studies, we adopt the regular
procedure of selecting lags 2, 5, 10 and 30 for daily prices and the lags 2, 4, 8, 16 for
monthly prices. For each period we report the estimated variance ratio, VR (k), and also
the heteroscedasticity robust statistic, M2(k). Since this is an individual test if we reject
19
Considering the daily prices all the stocks with exception of BCP, CTT, EDP, REN,
Semapa and Teixeira Duarte, have at least one variance ratio larger than unity, which
indicates that the variances grow more than proportionally with time, existing thus a
positive autocorrelation of the data. On the other hand, the test statistic M2(k), reject the
RWH for ten of the eighteen stocks, namely for Altri, BCP, BPI, Impresa, Jerónimo
Martins, Mota-Engil, Nos, Pt, Ren and Teixeira Duarte, and also for the PSI-20 index.
Considering the monthly prices, the only variance ratio that is lower than the unity is for
Galp, which indicates that it is the only stock where the variance increases less than
proportionally with time, suggesting mean reversion for the monthly series. Analyzing
now the test statistic M2(k), from ten stocks that we have rejected the RWH for the daily
prices, now this number decreases for seven, namely for Altri, BCP, EDP, Impresa,
Mota-Engil, Semapa and Sonae, and also for the PSI-20 index.
As an overview, we can conclude that in the monthly data the number of stocks that
reject the RWH is fewer, suggesting that when we decrease the frequency of the
20
Table III- Individual Variance Ratio tests by Lo and Mackinlay for the eighteen Portuguese stocks and also for PSI-20 index.
Sample Daily prices Monthly prices
VR(2) M2(2) VR(5) M2(5) VR(10) M2(10) VR(30) M2(30) VR(2) M2(2) VR(4) M2(4) VR(8) M2(8) VR(16) M2(16) Altri 1.059 1.095 1.105 1.112 1.154 1.301 1.346 2.016* 1.161 1.510 1.395 2.153* 1.848 3.169** 2.368 3.366** Banif 1.020 0.444 1.128 1.235 1.155 1.025 1.459 1.161 1.137 1.680 1.246 1.892 0.863 -0.566 0.293 -1.903 BCP 0.826 -4.600** 0.637 -4.409** 0.565 -3.513** 0.538 -2.311* 1.209 2.325* 1.395 2.494* 1.729 2.944** 1.949 2.624** BPI 1.041 1.580 1.091 1.687 1.163 2.057* 1.323 2.401* 1.141 1.663 1.181 1.023 1.443 1.630 1.502 1.312 CTT 0.918 -1.354 0.806 -1.544 0.726 -1.508 0.538 -1.456 1.054 0.389 0.756 -0.877 0.322 -1.399 0.059 -1.276 EDP 0.984 -0.597 0.957 -0.782 0.885 -1.332 0.724 -1.771 0.983 -0.230 1.052 0.394 1.365 1.693 1.653 2.054* EDP-R 1.054 1.288 1.003 0.035 0.933 -0.514 0.917 -0.365 1.086 0.500 1.219 0.751 0.989 -0.026 0.709 -0.537 Galp 1.056 1.270 1.017 0.194 1.013 0.112 0.986 -0.070 0.944 -0.382 0.906 -0.352 0.907 -0.240 0.541 -0.857 Impresa 1.021 0.818 1.044 0.840 1.103 1.318 1.270 2.028* 0.944 -0.382 1.220 1.390 1.585 2.377* 1.585 1.638 Jerónimo Martins 1.067 2.535* 1.059 1.096 0.964 -0.448 0.928 -0.518 1.032 0.406 1.060 0.404 1.123 0.506 1.134 0.373 Mota-Engil 1.056 2.031* 1.096 1.712 1.142 1.740 1.330 2.421* 1.214 2.921** 1.308 2.149* 1.656 2.807** 1.809 2.316* Nos 1.097 3.585** 1.156 2.495* 1.282 2.939** 1.455 2.760** 0.881 -0.943 1.077 0.355 1.422 1.359 1.724 1.773 Portucel 0.974 -1.155 0.909 -1.825 0.912 -1.206 1.000 -0.001 1.068 0.938 1.146 1.105 1.118 0.547 0.917 -0.255 PT 1.066 2.168* 1.045 0.726 1.064 0.716 1.044 0.286 0.881 -0.985 0.974 -0.120 1.158 0.492 1.084 0.193 Ren 0.985 -0.320 0.838 -1.677 0.716 -2.040* 0.651 -1.597 1.040 0.356 0.894 -0.533 0.811 -0.601 0.731 -0.579 Semapa 0.985 -0.655 0.934 -1.346 0.902 -1.380 0.908 -0.789 1.050 0.694 1.291 2.169* 1.483 2.306* 1.496 1.615 Sonae 0.981 -0.792 0.964 -0.743 0.966 -0.465 1.125 1.021 1.178 2.435* 1.388 2.831** 1.846 3.808** 1.971 2.893** Teixeira Duarte 0.880 -3.190** 0.844 -2.022* 0.872 -1.114 0.934 -0.326 1.135 0.998 1.247 1.021 1.728 1.960 1.907 1.644 PSI-20 1.084 3.430** 1.127 2.384* 1.127 1.535 1.265 1.815 1.207 2.693** 1.354 2.565* 1.605 2.718** 1.530 1.622
Notes: VR(k)- variance ratio estimate, M2(2)- test statistic for null hypothesis of heteroskedastic increments random walk; * null hypothesis rejection significant at the 5%
21
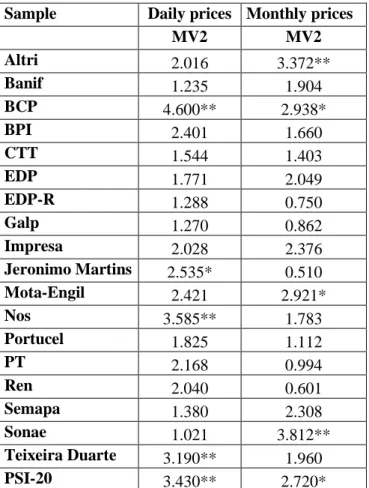
5.2.3 Multiple variance ratio tests by Chow and Denning (1993)
Table IV reports the results of the multiple VR tests by Chow-Denning. This test is
robust to the presence of heteroscedasticity. Considering the daily series at the 5% level,
we only reject the hypothesis of random walk for Jerónimo Martins. At the 1% level, we
reject for BCP, Nos, Teixeira Duarte and also for the PSI-20 index. Furthermore for the
monthly series we reject the hypothesis of random walk, at 5% significant level for
BCP, Mota-Engil and also for the PSI-20 index. At the 1% level, we only reject for Altri
and Sonae.
Table IV - Multiple variance ratio tests by Chow and Denning for the eighteen Portuguese stocks and also for PSI-20 index.
Sample Daily prices Monthly prices
MV2 MV2 Altri 2.016 3.372** Banif 1.235 1.904 BCP 4.600** 2.938* BPI 2.401 1.660 CTT 1.544 1.403 EDP 1.771 2.049 EDP-R 1.288 0.750 Galp 1.270 0.862 Impresa 2.028 2.376 Jeronimo Martins 2.535* 0.510 Mota-Engil 2.421 2.921* Nos 3.585** 1.783 Portucel 1.825 1.112 PT 2.168 0.994 Ren 2.040 0.601 Semapa 1.380 2.308 Sonae 1.021 3.812** Teixeira Duarte 3.190** 1.960 PSI-20 3.430** 2.720*
Note: M2(k)- test statistic for null hypothesis of heteroskedastic increments random walk; * null
22
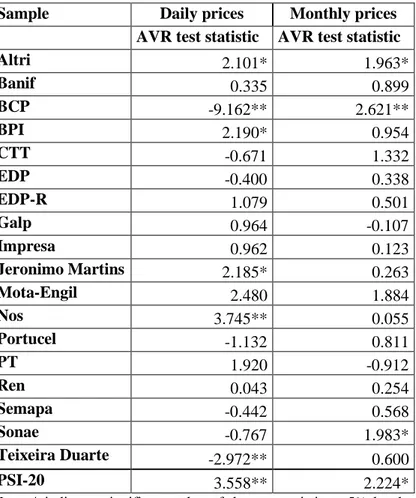
5.2.4 Automatic Variance Ratio tests by Choi (1999)
The results of the automatic variance ratio test (AVR) by Choi are reported in Table V
for the daily and monthly data. Observing the values by daily data for the stocks: Altri,
BCP, BPI, Jerónimo Martins, Mota-Engil, Nos, Teixeira Duarte and also for the PSI-20
index, with the critical values (two-sided) of normal distribution we find that the null
hypothesis of no serial correlation is rejected for seven of the eighteen stocks and also
for the PSI-20 index. This suggests that all the seven stocks and also the PSI-20 index
are inefficient with daily data.
Applying the same process, but now with the monthly data, we can compare the values
of the AVR test with the critical values (two-sided) of normal distribution and we find
that for the stocks of, Altri, BCP, Sonae and also for the PSI-20 index the null
hypothesis is rejected, suggesting that this three stocks and also the index are inefficient
23
Table V - Automatic Variance Ratio tests for the eighteen Portuguese stocks and also for PSI-20 index, for daily and monthly prices.
Sample Daily prices Monthly prices
AVR test statistic AVR test statistic
Altri 2.101* 1.963* Banif 0.335 0.899 BCP -9.162** 2.621** BPI 2.190* 0.954 CTT -0.671 1.332 EDP -0.400 0.338 EDP-R 1.079 0.501 Galp 0.964 -0.107 Impresa 0.962 0.123 Jeronimo Martins 2.185* 0.263 Mota-Engil 2.480 1.884 Nos 3.745** 0.055 Portucel -1.132 0.811 PT 1.920 -0.912 Ren 0.043 0.254 Semapa -0.442 0.568 Sonae -0.767 1.983* Teixeira Duarte -2.972** 0.600 PSI-20 3.558** 2.224*
Note: * indicates significant value of the test statistic at 5% level of significance and ** indicates the same at 1% level of significance.
24
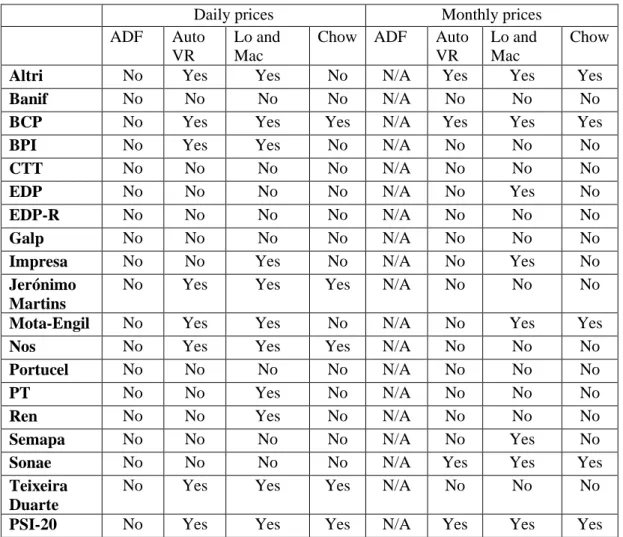
6. Conclusions
Table 6 summarizes the results of all the tests performed in this study. The empirical
evidence from the unit root tests does not allow the rejection of the RWH for the
eighteen shares and also for the PSI-20 index, while the other tests provide mixed
conclusions. The automatic variance ratio test of Choi in daily data rejected the RWH
for eight of the eighteen stocks including the PSI-20 index, but when we consider
monthly data the numbers of stocks that reject this hypothesis decreased to four,
including the PSI-20 index. When we use the individual and multiple variance ratios
tests, the number of stocks that does not following a random walk decreases as well
when we use monthly data. On the other hand, all tests with the exception of the ADF
reject the RWH for the PSI-20 index in both, daily and monthly data.
The findings that we achieve with this study confirm with previous results on the
Portuguese stock market, such as those made by Dias et al. (2002) and Borges (2007),
who provide evidence in favor of the RWH when ADF tests are used. On the other
hand, they find evidence against the RWH with variance ratio tests and correlation tests.
Therefore, even though there has been a crisis in Europe, it seems that the Portuguese
stock market has become more efficient. Nevertheless, for some stocks there is still
some space, for transaction strategies based on technical analysis that may increase
25
Table VI- Summary of test results for the random walk hypothesis. Daily and monthly data are presented.
Daily prices Monthly prices
ADF Auto VR
Lo and Mac
Chow ADF Auto VR
Lo and Mac
Chow
Altri No Yes Yes No N/A Yes Yes Yes
Banif No No No No N/A No No No
BCP No Yes Yes Yes N/A Yes Yes Yes
BPI No Yes Yes No N/A No No No
CTT No No No No N/A No No No
EDP No No No No N/A No Yes No
EDP-R No No No No N/A No No No
Galp No No No No N/A No No No
Impresa No No Yes No N/A No Yes No
Jerónimo Martins
No Yes Yes Yes N/A No No No
Mota-Engil No Yes Yes No N/A No Yes Yes
Nos No Yes Yes Yes N/A No No No
Portucel No No No No N/A No No No
PT No No Yes No N/A No No No
Ren No No Yes No N/A No No No
Semapa No No No No N/A No Yes No
Sonae No No No No N/A Yes Yes Yes
Teixeira Duarte
No Yes Yes Yes N/A No No No
PSI-20 No Yes Yes Yes N/A Yes Yes Yes
Notes: This table is a summary of the RWH tests. The columns “ADF”, “AVR”, “Lo and Mac” and “Chow” , represents the results for the Augmented Dickey-Fuller test, Automatic Variance Ratio test, the multiple and also the individual variance ratio tests, respectively. “N/A” means that the results are not available for this sample. “Yes” and “No” means that we reject or not reject the RWH with 5% of significance level.
26
7. References
Alexander, S.S. (1961) Price Movements in Speculative Markets: Trends or
Random Walks. Industrial Management Review 2, 7326.
Areal, N. M. e Armada, M. (2002) The Long-Horizon Returns Behaviour of the
Portuguese Stock Market, The European Journal of Finance, 8(1), 93-122.
Balachandher, L.; Ming, L. e Nor, F. (2007) An Examination of the Random
Walk Model and Technical Trading Rules in the Malaysian Stock Market, Malaysian
Accounting Review, 6 (2), 99-121.
Borges, M. R. (2007), Random Walk Tests for the Lisbon Stock Market. Working Papers, Department of Economics, Technical University of Lisbon,14.
Borges, M. R. (2010) Efficient market hypothesis in European Stock Markets, The European Journal of Finance, 16(7), 711 – 726.
Campbell, J. Y.; Lo, A. W. e MacKinlay, A. C. (1997) The Econometrics of
Financial Markets, Princeton University Press, Princeton.
Charles, A. e Darné, O. (2009) Variance-Ratio Tests of Random Walk: An
Overview, Journal of Economic Surveys, 23 (3), 503-527.
Choi I. (1999), Testing the random walk hypothesis for real exchange rates, Journal of Applied Econometrics, 14, 293-308.
Chow, K.V. and Denning, K.C. (1993). A Simple Multiple Variance Ratio Test. Journal of Econometrics 58, 385-401.
Dias, J., Lopes, L., Martins, V. e Benzinho, J. (2002) Efficiency Tests in the
Iberian Stock Markets, Disponível em SSRN: http://ssrn.com/abstract=599926
Fama, E. (1965) Random Walks in Stock Market Prices, Financial Analysts Journal, 21, 55–9.
Fama, E. (1970) Efficient Capital Markets: a Review of Theory and Empirical
work, Journal of Finance, 25, 83-417.
Gama, P. (1998) A Eficiência Fraca do Mercado de Ações Português: Evidência
do Teste aos Rácio de Variância, da Investigação de Regularidades de Calendário e da Simulação de Regras de Transação Mecânicas, Revista de Mercados e Ativos
Financeiros, 1(1), 5-28.
Gonzaga & Sebastião (2012), As Ações Portuguesas Seguem um Random Walk?
Implicações para a Eficiência de Mercado e para a Definição de Estratégias de Negociação, estudos G.E.M.F.
27
Jensen, M. e Benington, G. (1970), Random Walks and Technical Theories.
Some Additional Evidence, Journal of Finance, 25(2), 469-482.
Lo, A. W. (1991) Long-term Memory in Stock Market Prices, Econometrics
Lo, A. W. (2007) Efficient Markets Hypothesis, The New Palgrave: A Dictionary of Economics, 2nd Edition, Palgrave Macmillan Ltd, Disponível em http://web.mit.edu/alo/www/Papers/EMH_Final.pdf.
Lo, A. W. e MacKinlay, A. C. (1988) Stock Prices Do Not Follow Random
Walk: Evidence from a Simple Specification Test, Review of Financial Studies, 1(1),
41-66.
Nascimento, V. (2007) Eficiência Informacional do Mercado de Acções: O Caso
Português, Tese de Mestrado, Faculdade de Economia da Universidade do Porto.
Smith, G. e Ryoo, H. (2003) Variance Ratio Tests of the Random Walk
Hypothesis for European Emerging Stock Markets, The European Journal of Finance,
9(3), 290-300.
Worthington, A. e Higgs, H. (2004) Random Walks and Market Efficiency in