ISSN:1991-8178
Australian Journal of Basic and Applied Sciences
Journal home page: www.ajbasweb.com
Corresponding Author: Duarte Xara-Brasil, Departamento de Marketing e Logistica ESCE-IPS, 2914-503 Setúbal Portugal
Tel: +351.265.709.300; E-mail: [email protected]
Do Private Labels Build Retailer Brand Equity? An Empirical Approach
1Duarte Xara-Brasil, 2Cristina Marreiros and 3Andreia Dionisio
1 Escola Superior de Ciências Empresariais, Marketing Department, Instituto Politécnico de Setúbal. 2914-503 Setúbal, Portugal 2 CEFAGE, Centre for Advanced Studies in Management and Economics, Universidade de Évora, 7000-809 Évora
3 CEFAGE, Centre for Advanced Studies in Management and Economics, Universidade de Évora, 7000-809 Évora
A R T I C L E I N F O A B S T R A C T
Article history:
Received 3 October 2015 Accepted 10 October 2015 Published Online 13 November 2015
Keywords:
Retail, Brand Equity, Branding, Private Label
This research is focused on retailer’s equity and brand equity, with an application to food retailer’s private labels. The study is supported on existing brand equity studies, namely Aaker, Keller, Yoo & Donthu and Pappu & Quester. The proposed conceptual model was tested through a survey to a sample of consumers, who do most of their food shopping in one of the two main Portuguese retailers. We obtained and validated a measurement and a structural model with appropriate model fit and factorial, convergent and discriminant validity.
© 2015 AENSI Publisher All rights reserved. To Cite This Article: Duarte Xara-Brasil, Cristina Marreiros and Andreia Dionisio., Do Private Labels Build Retailer Brand Equity? An Empirical Approach. Aust. J. Basic & Appl. Sci., 9(34): 42-48, 2015
INTRODUCTION
Private labels (PL), also known as store brands or retail brands, are owned by, and sold through, a specific chain of stores. These brands have critical importance in fast moving consumer goods (FMCG) markets, increasing competition among retailers and with national brands, in low quality generics, medium quality private labels, comparable quality products, and premium quality goods (Ailawadi & Keller, 2004). To many major retailers, their private label program is a central strategic issue, as a mean to deliver value and exclusivity to their clients and get higher profits and consumer loyalty (Semeijn, van Riel & Ambrosini, 2004; Baltas, 2003; Miller, 2006).
In the last two decades brand management and brand equity valuation became central issues in marketing research. Several academic studies, e.g. Aaker (1996), Keller (1993) and Yoo and Donthu (2001), analyzed those concepts and presented validated models to evaluate brand equity in different product and services categories. However, although retailer private brands have substantial economic relevance, studies on private label brand equity are scarce. The study reported in the present paper aims to understand the impact of private label on the brand equity of the retail insignia. In other words we will try to understand if private labels are an autonomous entity in terms of brand equity or if they are just one of the components of the retailer equity.
To achieve that goal we will first discuss the
literature on brand equity and PL after which we propose a conceptual model, and describe the methodology used to test and validate this model. The results of exploratory and confirmatory data analysis, as well as of the structural model will be described and discussed. We finish the paper presenting some implications and limitations of our study, as well as lines for future research.
Pl In Food Retail:
The food retail industry is extremely competitive. The industry includes many of the largest global and national companies - Forbes ranking of the 2000 largest companies in the world incudes 41 retailers (Forbes, 2014).
Retailers PL range consists of products developed and controlled by the retail organization that distributes and holds the brand, which may include the organization name in its identification (Sayman, Hoch & Raju, 2002; Sulzbach, 2005). PL are sold exclusively in retailers stores, which is responsible for a set of tasks that usually were a charge of producers, such as market research, product launching, storage and promotion (Hoch, 1996).
Private Labels play a very important role in the FMCG industry; in many European countries, they have a market share of around 40 % (Nielsen, 2011). PL are a central component of the retail value proposition and a physical evidence of the retail activity.
strategies, according to their performance, objectives and markets. There are different types of private labels, with different branding and pricing strategies. We will focus our research on standard PL, which use the retailer umbrella identity.
Major Portuguese retailers – Pingo Doce and Continente – have been improving their performance in the market. According to Nielsen (2013), in 2012, they had a 46% market share, competing with important international corporations, as Lidl, Aldi, Intermarché, Auchan, DIA. Private labels represent 36% of Portuguese food retailing industry.
Brand Equity: a) Concept:
There are different consumer based brand equity
definitions, namely Aaker (1991, 1996), Keller (1993) and Yoo, Donthu & Lee (2000). In summary, brand equity can be defined as a multidimensional concept that reflects the differential effect that knowledge and contact with a brand cause, over time, in consumers’ perceptions, behaviors and preferences, generating value to organizations and consumers.
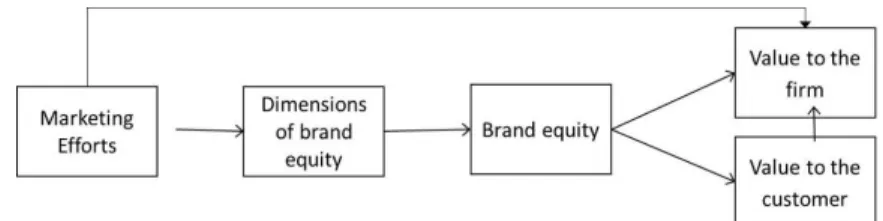
As illustrated in Figure 1, brand equity provides value to customers and organizations: perception of functional and emotional benefits to customers and an easier access to the market, synergies, lower risk and vulnerability to competitors, and higher profitability (Berry, 2000; Rao, Agarwal & Dahlhoff, 2004).
Fig. 1: Brand equity framework Source: Yoo, Donthu e Lee (2000).
b) Brand equity approaches to products and retailers:
The first brand equity models were developed by Aaker and Keller. Aaker unfolded his brand equity model in four dimensions, while Keller analyzed brand equity through the differential effects that knowledge by consumers could provide for the brand and the company. These models, although not validated by the authors or included the relations between the different dimensions, were the basis for many subsequent investigations.
Aaker (1991, 1996) conceptualized the first multidimensional model for measuring Brand Equity into four strategic dimensions: loyalty, perceived quality, associations and notoriety. Although it did not include its empirical validation, his work is a fundamental base for the development of scales and subsequent metrics for the study of brand equity.
Keller (1993) also argues for the importance of analyzing brand equity in a strategic perspective: marketing activities should improve brand awareness among consumers - with repercussions in sales, perceptions and preferences in the short term - but also affect the future memories and the long-term performance. To Keller, awareness and image generation is based on the consumers’ experiences with the brand in all touch points and on other secondary consumer’s associations.
The Yoo e Donthu (2000) model is the first multidimensional and validated model of consumer based brand equity (Buil, Chernatony & Martıinez, 2008). It includes cognitive and behavioral aspects in an original scale with four dimensions: loyalty, perceived quality, awareness and associations. This model was based on Aaker (1991) and Keller (1993)
and was subsequently used in several studies. According to Christodoulides & Chernatony (2010), Yoo & Donthu (2001) is the indirect approach to customer based brand equity with more strengths and fewer weaknesses.
Pappu & Quester (2006 e 2008) research aimed to deepen the concept of retailer brand equity. Their study was mainly based in past research from Arnett, Laverie & Meiers (2003), Yoo & Donthu (2001) and Aaker (1996). They validated a four dimensions scale: awareness, associations, perceived quality and loyalty.
A Framework For Private Label Brand Equity:
We could not find empirical studies measuring private label brand equity. So, to that purpose, items from scales validated to measure products and retailers brand equity will be used, namely, the Yoo & Donthu (2001) and the Pappu & Quester (2006) scales. We adapted those scales to the specificities of PL and the food retail industry, on the basis of an extensive literature review, and in-depth interviews with academics and retail professionals. As stated in Chen & Tseng (2010) and Christodoulides et al (2006), it is necessary to attend specific aspects of this retail format, such as consumers low buying involvement when choosing a super/ hypermarket chain (TNS, 2012).
The scales, with 44 items (using a 7 levels Likert scale) were operationalized through a survey, applied to customers of major retailers in Portugal, according to the regional proportion of age groups, gender and socioeconomic class. The survey took place in Lisbon area, in April 2012, and was implemented by a group of professional interviewers, at the
respondent residence (219 valid surveys). We previously developed a pretest, with a sample of 25 consumers, which allowed us to improve the layout and wording effectiveness of the questionnaire. a) Factor analysis
Data analysis was carried out through exploratory factor analysis (EFA) and subsequently with confirmatory factor analysis (CFA), verifying its adjustment indexes and its convergent and discriminant validity.
In EFA all data and variables are used without any theoretical and conceptual restrictions and we should not introduce prior hypotheses or assumptions about the expected behavior of data, so that “data can speak by itself” (Hair et al, 1998). Data were subjected to the KMO - Kayser Meyer Olkin test (0.93) and the Bartlett test of sphericity (p- value = 0.000), allowing us to conclude for the adequacy of the data for the analysis technique. Thus, items were grouped by the main components method, and interpreted using the Varimax rotation method and using the weight factor of the variables (Aaker, Kumar & Day, 1997).
After the first analysis some of the items have been deleted from the scales, since they showed very low factor weights, or had significant factor weights shared by more than one factor, or had a very low level of internal consistency, as measured by Cronbach's Alpha. With this process, we obtained a 24 items scale with three factors, each with a significant number of items (10, 9 and 5) and adequate internal consistency (Cronbach's Alpha between 0.878 and 0.928). This three factors model explains 62.5 % of the variance of the data. Two of
the model factors are related with the retailer and one with its private label.
Based on the model with 24 items (observed variables) and 3 factors (latent variables), we proceed to Confirmatory Factorial Analysis, testing for the model fit and validity.
Factorial validation occurs when each item has a standardized factor weight greater than 0.5; Convergent validation occurs when Average Extracted Variance (AVE) is higher than 0.5 (Hair et al, 1998) and discriminant validation occurs when AVE equals or exceeds the square of the correlation between factors (Fornell & Larcker, 1981). Model fit is analyzed trough the performance of different indicators, namely GFI 0.910 (good); one CFI 0,962 (very good); X2 / df = 1.697 (good) and a RMSEA = 0.057 (good).
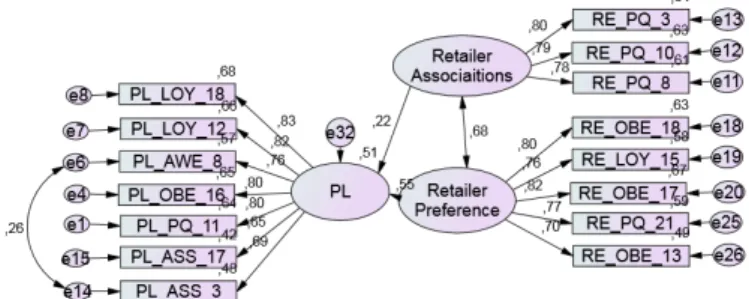
According to the analysis of the scores of the correlations matrix and on theoretical review about the concepts in analysis, we eliminated 7 items and made the option of maintain two other items low levels of correlation because it was considered that they had a significant importance for the study. Since, the survey questions were focused on the retailer where the respondent claimed spontaneously to make most of his or her shopping (top of mind awareness), it was decided to withdraw from the analysis the two items related to retailer awareness that would bring redundancy. The final result of these model adjustments was a three latent variables scale, which 7, 5 and 3 items. Two of the latent variables are related with the retailer and one with PL. As shown in Figure 2, it was decided to introduce a second-order factor, named "Retailer”, which join the two retailer related dimensions.
Fig 2: Confirmatory Factor Analysis.
As it is illustrated in Figure 2, the latent variable PL has seven items:
1. I am aware of PL XXX (MD AWE 8);
2. Some characteristics of PL XXX come to my mind quickly (MD ASS 3);
3. I buy products from PL XXX because they have
the lower prices (MD ASS 17);
4. The PL XXX products are of high quality (MD QP 11);
5. The likely quality of PL XXX is extremely high. (MD LOY 12);
my first choice (MD LOY 18);
7. PLXXX is the PL that I like the most (MD OBE 16).
This construct includes mainly items related to the knowledge about the PL (items 1 to 5), materialized in PL awareness and consumers’ perception of its quality and price. In the same dimension, we observe elements related to the preference for the retailer PL (items 6 and 7).
The first latent variable related with the retailer includes three items linked with consumers’ PL associations in terms of quality and confidence in the retailer assortment:
1. XYZ stores offer products of very good quality. (RE_PQ 3);
2. XYZ stores offer very reliable products. (RE_PQ 8);
3. XYZ stores offer products with excellent features. (RE_PQ 10).
The second latent variable is associated with preference for the retailer and includes the following items:
1. Globally, retailer XXX quality is higher than its competitors (RE_PQ 21);
2. I will not buy products from other retailers, if I can buy the same item at XXX stores. (RE_LOY 15); 3. Even if the level of prices is the same in other retailer, I prefer to buy at XXX (RE_OBE 17); 4. Even if other retailer is as good as XXX, I prefer to buy at XXX (RE_OBE 18);
5. Even if the competitors are similar to XXX, I prefer to shop on XXX stores (RE_OBE 13).
This scale obtained good model fit in the measures most commonly used in AFC applications (Marôco, 2010), specifically GFI=0,913 (good); CFI= 0.96 (very good); X2 / df = 1.87 (good) and RMSEA = 0.63 (good). The analysis of the factor weights, the AVE and the square of the correlation between factors led to the conclusion of its factorial, discriminant and convergent validity (AVE (retailer) = 0.858 and AVE (PL) = 0.751). Cronbach's alphas were also well above 0.6 (Malhotra, 2008)
confirming the internal consistency of the scales (0,903 (PL); 0,834 (Retailer Associations) and 0,878 (Retailer Preference)).
The model was subjected to a validation process with the use of an independent sample, with identical characteristics and survey methodology (field work). Suitable results were obtained: CFI = 0.948 (good); GFI = 0902 (good); TLI = 0.936 (good); PGFI = 0647 (good); PCFI = 0776 (good); RMSEA = 0.074 (good); X2 / df = 2.229 (acceptable). Convergent and discriminant validity were confirmed by the AVE (Retailer) = 0668 and the AVE (PL) = 0.585 and Cronbach alphas of 0,848 (PL), 0,709 (Retailer Associations) and 0,905 (Retailer Preference).
We may conclude that this validation process covered all the steps recommended for the validation of a theoretical model with confirmatory factor analysis, with good model fit and validity. Therefore it can be stated that the obtained measurement model is suitable for the analysis of the retail brand equity.
b) Structural model:
The general structural equation model includes the measurement model - which defines how the latent variables are operationalized, and the structural model that defines the causal relationships between the latent variables (Maroco, 2010). According to the model fit reference values (Maroco, 2010), we obtained a structural model with appropriate adjustment levels, with a rating of "Good" in all indicators analyzed: X2/gl=1.871; CFI=0.961, GFI=0.913, TLI=0.952, PGFI=0.787, PCFI=0.786, RMSEA=0.063, RMSI=0.98, RNFI=0.986.
The obtained structural model (Figure 3) explains 51 % of the variance of PL brand equity. The analysis of the trajectories between factors revealed that preference for the retailer is strongly correlated with retailers associations (0.68), and, for its part, preference for the retailer has an influence on PL higher than that of the retailers associations. That is, retailer preference is strongly correlated with the associations consumers develop relatively to the retailer. Although both these latent variables are antecedents of the value of the PL for consumers, the weight of preferences is the most relevant (0.55).
Fig. 3: PL brand equity structural model.
After the validation of the structural model, we tested the moderation effects of age, educational level and socioeconomic class on the latent variables related to retailer. No significant impacts were found.
However, it was possible to find statistically significant moderating effects of the retailer on two items of PL (PL_AWE_8 and PL_ASS3) that had higher factor weights in one retailer.
Conclusions:
This research aimed to understand the impact of private labels on the brand equity of the retail insignia (Retailer) and to verify if private labels are an autonomous entity in terms of brand equity or just one of the components of the retailer equity.
We first analyzed existing models of retailers and products brand equity. We started with Aaker’s and Keller’s models, which were the basis for other studies such as Yoo & Donthu (2001) and Pappu & Quester (2006).
The proposed conceptual model was tested with data collected through a survey to a sample of consumers, who do most of their food shopping in one of the two main Portuguese retailers. The data from the scales was analyzed through exploratory and confirmatory factor analysis. We obtained a measurement model and a structural model with appropriate model fit and factorial, convergent and discriminant validity. The model was validated, with good results, in a second sample using similar fieldwork and data analysis techniques.
Our study also confirmed the
multidimensionality of the brand equity construct. Our results are in line with Keller’s model, which conceptualized brand equity as the differential effect that knowledge and contact with the brand cause over time in consumers’ perceptions, behaviors and preferences, in the present case represented by the associations and preferences of consumers.
The retailer's brand equity model validated in this study has three dimensions: the associations with the retailer product range, preference for the retailer and private label. We observed a strong correlation between the consumers´ retailers associations and the preference given to the retailer. It can be said that the consolidation of consumers’ preference for the retailer allows for more favorable associations to the retailer, its range of products and the PL. PL can be said to be a retailer brand extension (umbrella brand). These results are aligned with Aaker (1991) conclusion, that the success of the extended brand also depends on how the awareness and associations to the superior level parent brand are transferred.
The structural model did not show PL perceptions as a formative element of the associations and preferences for the retailer. This conclusion is in line with the results of our exploratory research, which indicated that consumers do not strongly differentiate the PL value propositions of the different retailers they patronize. This fact might be related to the historical positioning of PL - umbrella branding literature review indicates that the positioning of the different products under the same brand should be very close, reinforcing the importance of consistency. However, in the case of PL, retailers have developed positioning close to the leading brands in each category. This practice has sacrificed a similar
cross-marketing approach, consistent with the retailer values, in different product categories.
The results of the present study allow us to give some insights into the marketing of food retailers:
• The development of a focused approach in retailer assortment (quality, reliability and preferred brands) is a decisive factor. There is a substantial correlation between the associations to the product range and consumer’s preference for the retailer.
• The preference for a retailer allows a more favorable perception of its product assortment and its private label. PL benefit from consumer’s preferences and associations with the retailer.
• The PL are represented in several product categories. Erdem and Chang (2012) verified the existence of substantial consumer learning effects across product categories;
• The PL contribution to retailer preference should be achieved with the development of a PL positioning in line with the positioning of the retailer and not against the leading brands in each category. This approach would also contribute to greater differentiation of the PL from other retail brands.
The implications of this study are also relevant for managers of umbrella brands, since the validated model represents the brand equity of an umbrella brand with its dimensions and relations. In this case, we demonstrate the impact of the umbrella brand equity on the different classes of products to which it is extended (in our case the PL).
Limitations And Future Studies:
There may be limitations to the generalization of the findings of this work, resulting from research design options, including the sample size, which may have limited the results and the fit model. The data was collected from consumer responses in relation to the retailer where they did most of their purchases. As such our model does not analyze differences in consumer perceptions regarding different retailers. The PL range may hinder the development of perceptions of consumers about the brand, i.e., it may be more difficult for respondents to develop clear perceptions about these brands.
From the results of this research, several lines for further research might be considered:
• International replication of the study would allow the validation of the model in markets with different levels of retail concentration, purchasing power indicators and relative importance of the PL. Additionally, it would be interesting to develop similar studies in other types of retailers such as specialized retailers in home appliances, clothing and sports;
• The development of studies focused on PL specific product categories. Buying behavior and perceptions regarding the PL might not be similar across all product categories, depending on different factors.
provide important insights for a more comprehensive approach to the brand equity construct.
REFERENCES
Aaker, D., 1991. Managing Brand Equity. Free Press
Aaker, D., 1996. Measuring brand equity across products and markets. California management review, 38 (3): 102-120.
Aaker, D., V. Kumar, G. Day, 1997. Marketing research, 6th Ed. John Wiley & Son, Inc.
Agarwal, M., V.R ao, 1996. An empirical comparison of consumer-based measures of brand. Marketing Letters, 7(3): 237-247.
Ailawadi, K., K. Keller, 2004. Understanding retail branding: conceptual insights and research priorities. Journal of Retailing, 80: 331–342.
Arnett, D., D. Laverie, A. Meiers, 2003. Developing parsimonious retailer equity indexes using partial least squares analysis: a method and applications. Journal of Retailing, 79: 161–170.
Baltas, G., 2003. A combined segmentation and demand model for store brands. European Journal of Marketing, 37(10): 499-513.
Berry, L., 2000. Cultivating service brand equity. Academy of Marketing Science Journal, 28(1): 128-137.
Buil, I., L. Chernatony, E. Martıinez, 2008. A cross-national validation of the consumer-based brand equity scale. Journal of Product & Brand Management, 17(6): 384–392.
Chen, C.F., W. Tseng, 2010. Exploring customer-based airline brand equity: evidence from Taiwan. Transportation Journal, 49(1): 24-34.
Christodoulides, G., L. Chernatony, 2010. Consumer-based brand equity conceptualization and measurement: A literature review. International Journal of Market Research, 52(1): 43-66.
Christodoulides, G., L. Chernatony, O. Furrerb, E. Shiua, T. Abimbolac, 2006. Conceptualising and measuring the equity of online brands. Journal of Marketing Management, 22: 799-825.
De Wulf, K., G. Odekerken-Schröder, F. Goedertier, V. Ossel, 2005. Consumer perceptions of store brands versus national brands. The Journal of Consumer Marketing, 22 (4/5): 223-232.
Forbes, 2014. The World's Biggest Companies. http://www.forbes.com/global2000/list/#page:1_sort: 0_direction:asc_search:_filter:All%20industries_filte r:All%20countries_filter:All%20states
Fornell, C. D. Larcker, 2007. Structural Equation Models With Unobservable Variables and Measurement Error: Algebra and Statistics. Journal of Marketing Research. 18 (3): 382-388.
Gill, M.S., J. Dawra, 2010. Evaluating Aaker’s sources of brand equity and the mediating role of brand image. Journal of Targeting, Measurement and Analysis for Marketing, 18(3/4): 189-198.
Hair, J., R. Anderson, R. Tatham, W. Black,
1998. Multivariate Data Ana1998lysis, 5th edition. Prentice-Hall.
Hoch, S., 1996. How should national brands think about private labels? Sloan Management Review, 37: 89–102.
Keller, K. L. (1993). Conceptualizing, measuring, managing customer-based brand equity. 1-22.
Keller, K.L., D.R. Lehmann, 2006. Brands and branding: research findings and future priorities. Marketing Science, 25(6): 740–759.
KPMG, 2000. Customer Loyalty & Pricing Label Products, KPMG, London.
Malhotra, N., 2006. Marketing Research: An Appied Orietation. Pearson - Prentice Hall.
Maroco, J., 2010. Análise de equações estruturais: fundamentos teóricos, software e aplicações. Pêro Pinheiro: Reportnumber.
Miller, F., 2006. What do brands mean? A series of three essays that explore the nature of meaning for well-known brands. University of Cincinnati. Phd Thesis.
Nielsen, 2011. The Rise of the Value-Conscious Shopper. A Nielsen Global Private Label Report. London: Nielsen.
Nielsen, 2013. Scantrends, janeiro de.
Pappu, R., P. Quester, 2006. A consumer-based method for retailer equity measurement: Results of an empirical study. Journal of Retailing and Consumer Services, 317–329.
Pappu, R., P. Quester, 2008. Does brand equity vary between department stores and clothing stores? Results of an empirical investigation. Journal of Product & Brand Management, 17(7): 425-435.
Pappu, R., P. Quester, R. Cooksey, 2005. Consumer-based brand equity: improving the measurement - empirical evidence. The Journal of Product and Brand Management, 14(2-3): 143-154.
Rajagopal, 2008. Measuring brand performance through metrics application. Measuring Business Excellence, 12(1): 29-38.
Rajh, E., 2002. Development of a scale for measuring customer brand equity. Ekonomski Pregled, 53(7-8): 770-780.
Rao, V., M. Agarwal, D. Dahlhoff, 2004. How is manifest branding strategy related to the intangible value of a corporation? Journal of Marketing, 68(4): 126 141.
Sayman, S., S. Hoch, J. Raju, 2002. Positioning of store brands. Marketing Science, 21(4): 378-397.
Semeijn, J., A. van Riel, A. Ambrosini, 2004. Consumer evaluations of store brands: effects of store image and product attributes. Journal of Retailing and Consumer Services, 11: 247-258.
Sulzbach, M., 2005. Marca Própria, Um capital de reputação para distribuidores varejistas de alimentos no Brasil. Tese de Doutoramento. Curitiba, Brasil: Universidade Federal do Paraná.
TNS, 2012. The Commitment Economy: You can’t always get what you want.
Washburn, J., R. Plank, 2002. Measuring brand equity: An evaluation of a consumer-based brand equity scale. Journal of Marketing Theory and Practice, 10(1): 46-61.
Wood, L., 2000. Brands and brand equity: definition and management. Management Decision, 38(9): 662-669.
Yoo, B., N. Donthu, 2001. Developing and validating a multidimensional consumer-based brand equity scale. Journal of Business Research, 52: 1-14.
Yoo, B., N. Donthu, S. Lee, 2000. An examination of selected marketing mix elements and brand equity. Journal of the Academy Marketing Science. 28(2): 195-211.