1
The impact of soccer
results on publicly traded
soccer clubs
Giulio Busalini
Dissertation written under the supervision of Geraldo Cerqueiro
Dissertation submitted in partial fulfilment of requirements for the MSc in
2
Title: The impact of soccer results on publicly traded soccer clubs Author: Giulio Busalini
Abstract: My dissertation aims to understand the relationship between soccer results and stock price performance for four publicly traded soccer teams selected according to the size of their market capitalization, namely, Manchester United, Juventus, Borussia Dortmund, and AS Roma. I collected data for different periods for each team depending on the date they were listed on the stock market, and I used betting odds to separate the expected from the unexpected component of results. The methodology I implemented consists of running several regression models for each team analyzed in order to determine the effect of match results on the stock returns, controlling for variables such as the market index, type of match (international or national), type of competition, and importance of the match. Results show a statistically significant impact of match results on the stock price performance of Juventus, Borussia Dortmund, and AS Roma, while match results do not affect significantly Manchester United’s stock price performance.
Resumo: Esta dissertação tem como objetivo compreender a relação entre os resultados dos jogos de futebol e a evolução do preço das ações de quatro equipas de futebol de capital aberto, selecionadas de acordo com o seu valor de mercado, nomeadamente, Manchester United, Juventus, Borussia Dortmund e AS Roma. Foram recolhidos dados de períodos diferentes para cada equipa, dependendo da data em que foram cotadas no mercado de ações, e usadas as probabilidades de apostas desportivas para isolar a componente esperada e a componente inesperada dos resultados dos jogos. A metodologia utilizada consiste em aplicar vários modelos de regressão para cada equipa analisada, a fim de determinar o efeito dos resultados dos jogos no retorno das ações, tendo em conta variáveis como o índice de mercado, o tipo de jogo (internacional ou nacional), o tipo de competição, e a importância do jogo. Os resultados mostram um impacto estatisticamente significativo dos resultados dos jogos no desempenho das ações da Juventus, Borussia Dortmund e AS Roma, enquanto que os resultados dos jogos do Manchester United não afetam significativamente o desempenho do preço das suas ações.
3
Index
1. Introduction ... 4
1.1 National and European league structure ... 5
1.2 Invest in soccer listed companies ... 8
1.3 Thesis overview ... 9
2. Literature review ... 10
3. Data and Variables ... 16
3.1 Stock prices and returns ... 16
3.2 Betting odds and match results ... 16
3.3 Other Variables ... 19
4. Empirical hypothesis and methodology ... 20
5. Analysis and Results ... 23
5.1 Borussia Dortmund ... 23
5.2 AS Roma ... 25
5.3 Manchester United ... 27
5.4 Juventus ... 29
5.5 Summary of results ... 31
6.Conclusions and limitations ... 33
References ... 35
4
1. Introduction
Nowadays soccer is becoming one of the most profitable industries with a significant economic impact on our society. Soccer clubs are still part of the cultural and sentimental heritage of cities and national teams, which continue to warm the hearts of the supporters linking communities, stirring emotions, and breaking down cultural barriers. They can be considered a national symbol. But, beyond this cultural dimension, recent decades have been dominated by the importance of the financial dimension of the sport. The soccer economy has also been affected by global economic conditions, that forced many clubs to sell different assets (such as players) and to make internal devaluations. We know that revenues for soccer teams do not rely only on transferring players, but they have several sources: ticket sales, sponsors, merchandising, and the distribution of television rights.
Despite that, soccer teams need to find sources to finance themselves. There are different sources of financing for the clubs: getting credit from banks or attracting investors in the stock market, either with bond issuing or capital increase. In recent years, some of the most important European clubs floated themselves on the stock market to raise capital. Examples can be found in the United Kingdom, Germany, France, Italy, The Netherlands, Portugal, and Turkey. It’s interesting to notice that investors are not just concerned about the financial performance, but also about the sporting performance of each club. Consequently, an irrational component seems to jeopardize the regular trend of the stock price, as investors are often driven by their passion for each club.
Furthermore, there is a strong connection between the progress in the national and international competition and the revenues generated by each team, indeed:
• If the club gains a good overall position in the national league, it has the chance to qualify for a European competition: UEFA Champions League or UEFA Europa League. The qualification at a European competition guarantees to each club an increase in revenues, from selling the broadcasting of television rights of this competition; • The more a team is successful in the competition, the higher is the gate attendance and
higher are the funds generated from the ticket and merchandise selling;
• Last, sponsors are attracted to successful teams, consequently, a successful team can generate larger advertising and sponsoring revenues, since many agreements are also
5
based on the team’s performance. Especially, participation in European competitions can lead to higher sponsoring revenues.
With concern of what is explained above, good sporting results should increase the revenues of each club and consequently the profitability, that should also bring to higher (expected) dividend payments. As finance theory states higher dividends conduct to an increase of the stock prices.
If al relations hold the result of a game should influence stock prices, with a stronger and deeper effect in European competition results.
1.1 National and European league structure
To develop my analysis, I choose four teams of three different countries across Europe: Manchester United from England, Juventus and AS Roma from Italy, Borussia Dortmund from Germany.
The English soccer system consists of four competitions: English Premier League, FA Cup, FA Community Shield, and English League Cup.
Premier League has a huge impact since it is the most-watched sports league in the world. It is contested by 20 clubs; each team plays 38 matches in a season running from August to May. It operates on a system of promotion and relegation with the English Soccer League. The top four teams in the Premier League qualify for the subsequent season of the UEFA Champions League group stage. The fifth-placed team qualifies for the subsequent season of UEFA Europa League, the sixth-placed team does the same, unless the winner of the FA Cup finished in the top five places in the Premier League or has won one of UEFA's major tournaments. The three lowest placed teams in the Premier League are relegated to the Championship, and the top two teams from the Championship promoted to the Premier League, with an additional team promoted after a series of play-offs involving the third, fourth, fifth and sixth-placed clubs.
Manchester United is the most successful team since the Premier League was founded (1992) with 13 titles. They won their last title at the end of the season 2012-13. The other 3 national tournaments assume less importance and less impact on investor’s mood than the Premier League and I didn’t consider them in my dissertation.
The Italian soccer system consists of three competitions: Serie A, Coppa Italia and Supercoppa Italiana. Serie A, nowadays, is also contested by 20 clubs, each team plays 38 matches in a
6
season running from August to May. The top four teams in the Serie A qualify straight to the UEFA Champions League (from the 2017–18 season). Teams finishing fifth and sixth qualify for the UEFA Europa League tournament. A third UEFA Europa League spot is reserved for the winner of the Coppa Italia. If the Coppa Italia champion already qualified for any of the two European competitions by finishing among the top six teams in Serie A, the seventh-ranked team in Serie A is awarded the UEFA Europa League spot. The three lowest-placed teams are relegated to Serie B and the top two teams from Serie B promoted to Serie A, with an additional team promoted after a series of play-offs involving the third, fourth, fifth, and sixth-placed clubs.
Juventus is the most successful team in Serie A with 35 titles, the last title dates back to the season 2018-19. It’s also important to remember that Juventus was relegated in Serie B during the season 2006-2007 due to the scandal of soccer match-fixing “Calciopoli” in which were
involved several teams from Serie A and to a lesser extent, Serie B. AS Roma has been way less successful than Juventus during his history. They have won Serie
A three times, the last title dates back to the season 2000-01. As it was for the English leagues, I didn’t consider the other two Italian tournaments since they assume less importance and less impact on investor’s mood than the Serie A.
The German soccer system consists of three competitions: Bundesliga, DFB-Pokal, and DFL-Supercup. Bundesliga is contested by 18 teams; each club plays every other club once at home and once away. The club with the most points at the end of the season becomes the German champion. Currently, the top four clubs in the table qualify automatically for the group phase of the UEFA Champions League. Fifth and sixth-placed teams qualify for the UEFA Europa League as well as the winner of DFB-Pokal. The two teams at the bottom of the table are relegated into the 2. Bundesliga, while the top two teams in the 2. Bundesliga are promoted. The sixteenth-placed team (third-last), and the third-placed team in the 2. Bundesliga play a two-leg play-off match. The winner of this match plays the next season in the Bundesliga, and the loser in the 2. Bundesliga.
Bundesliga has been dominated by Bayern Munich with 29 titles, the last in 2018-19. Borussia Dortmund is the third most successful team in Germany with 8 titles, the last one in 2011-12. The same assumption as before was made for DFB-Pokal and DFL-Supercup since I didn’t consider them in my dissertation.
7
All those teams also took part in European competitions (UEFA Champions League and UEFA Europa League) almost every season.
UEFA Champions League is one of the most prestigious tournaments in the world and the most prestigious club competition in European soccer, played by the national league champions (and, for some nations, one or more runners-up) of the UEFA national associations. Currently, the tournament starts in July with four rounds of eliminations. The tournament proper begins with a group stage of 32 teams, divided into eight groups of four. The first two of each group advances to the final knockout phase, which is disputed with home and away matches, two in each stage, with the away goals rule: if the aggregate score of the two games is tied, then the team who scored more goals at their opponent's stadium advances until the final which is held at a neutral stadium. This competition is not only crucial for the teams by its sporting dimension but also considering the significant financial prizes.
UEFA Europa League is the second-tier competition of European club soccer, ranking below the UEFA Champions League. The format consists of four rounds of qualifying starting from July culminating in a group phase. The group stage is composed of 12 groups with four teams each (in a double round-robin). The first two of each group together with eight third classified from the group phase of UEFA Champions League start the final stage system with four rounds of two-legged knockout rounds and a one-off final held at a neutral stadium.
Manchester United has won UEFA Champions League three times in its history, the last one in 2009, but considering the recent years and the period of my analysis, they didn’t perform well, reaching as greatest achievement the quarter-finals in 2013, 2014 and 2019. A better path was registered in UEFA Europa League, as Manchester United won the trophy in 2017 for the first time in his history in the final against Ajax.
Juventus, as well as Manchester United, is one of the most important and relevant team in Europe since they can count on two UEFA Champions League and three UEFA Europa League trophies.
Considering the recent years and the time under analysis, Juventus has reached three times the UEFA Champions League final, respectively in 2003, 2015, and 2017 without ever winning the title. For what concerns UEFA Europa League, the best result was registered in 2014 when Juventus reached the semi-final stage.
8
AS Roma and Borussia Dortmund are way less successful and strong than the previous two teams analyzed.
AS Roma never won any of the two international trophies, although they well performed in the Champions League in recent years, reaching as the highest target, the semi-finals in 2018. Nothing to report instead regarding the Europa League competition.
Borussia Dortmund has won one Champions League title in their history at the end of the season 1996-1997. In the period under analysis, the team also achieved good results, reaching and losing the final in 2013 against Bayern Munich. Borussia Dortmund also reached the final in Europa League in 2002 against Feyenoord being defeated as well.
1.2 Invest in soccer listed companies
The practice by soccer clubs to finance themselves on financial markets is certainly a very effective method to raise capital and eventually plan new investments but, it’s not always proved to be profitable for each investor who often invests his money for "sentimental" reasons but then stuck in loss-making positions.
Way back in 1983, Tottenham became the first soccer club considering a listing on the London Stock Exchange; in the following years, this became a trend across Europe reaching the peak of 36 teams listed in the various stock exchange markets in 2002. Since then, however, many listed clubs have had great difficulties losing much of their value and opting for delisting their shares. Nowadays there are only 24 European listed soccer clubs.
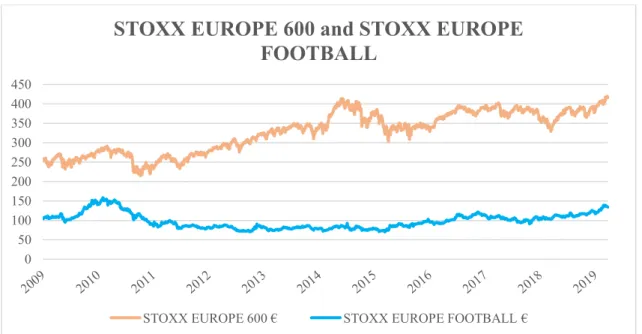
Although each case is different, it is indisputable that the Stoxx Europe Football Index, which includes 22 of the 24 listed teams, has performed particularly worse in the last 10 years than the European stock indices. The soccer index has gained less than 26% from December 2009 to December 2019; while the Stoxx Europe 600 index, which collects the most important listed companies in Europe, has gained roughly 50% looking at the same period.
This demonstrates that the investment in soccer shares has not followed the positive trend of the European indices, and the main reasons are the exponential increase in management costs (for example the salaries of the players) which has brought the clubs to be unattractive for profitability, and the strict connection with sporting results, which has removed professional investors, that are usually more concerned about financial forecasts than of games results.
9
The critical points related to soccer stock securities are related to the problems of high volatility, low capitalization, and especially the low trading volume due to the lack of investors’ confidence in this type of securities.
Nevertheless, some soccer companies have been able to exploit the benefits of listing on the stock exchange and, practicing efficient management strategies and shrewd marketing policies have achieved good stock market performances.
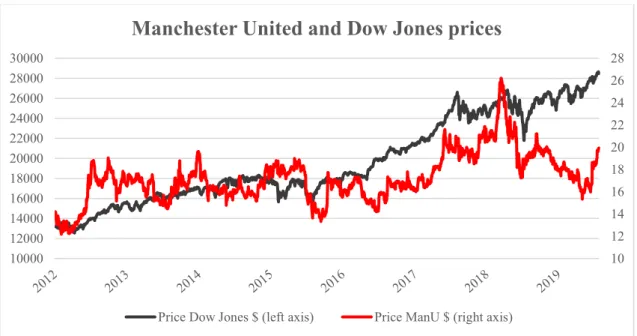
A proper example of a prosperous business model is represented by Manchester United. Manchester United is one of the most popular soccer teams in the world, its shares have been listed on Wall Street in 2012, after delisting from the London stock exchange in 2005 by the will of the new property guided by the American Malcolm Glazer. With a market capitalization of more than $ 3.3 billion (31/12/2019), Manchester United’s shares have gained nearly 30% in the past 7 years, a remarkable result considering that the last Premier League win dates back to 2013. In this case, a large part of the club's success is due to the management's great ability to exploit the popularity of Manchester United across the world. The team has different sources of great income every year: strong merchandising products sold all over the world, as well as the distribution of television rights and the sale of tickets for matches at Old Trafford stadium which has an average coverage of 99.2%.
1.3 Thesis overview
My dissertation will be divided into six chapters. In the first one, I did an introduction as I first explained the relationship existing among finance and soccer, then the structure of the competitions that I took in consideration to test if results have an impact for each team I choose, and finally the connection with its positive and negative side of soccer companies and the stock market.
The second chapter comprises a literature review of the most related papers and reports about sport and soccer, linked with the stock market.
The third chapter includes the collection of data and variables to carry on my analysis, the fourth chapter presents the empirical hypothesis and methodology used in this study, the fifth comprehends all the results achieved through the different models and, finally, in the sixth chapter, the main conclusions and limitations of this dissertation will be discussed.
10
2. Literature review
The past literature has considered the activity of the most important soccer clubs in Europe within the stock market. Many authors found out that it was possible to verify some abnormal returns regarding an activity that is becoming more financially oriented. Therefore, not only quantitative studies started to appear, but also other non-numerical variables began to be considered, which is becoming even more popular in the current days.
One of the first authors to investigate how share prices can be affected by soccer results were
Renneboog and Vanbrabant (2000). They considered English soccer clubs listed on the London
Stock Exchange (LSE) and Alternative Investment Market (AIM) revealing that positive abnormal returns of almost 1% were realized after a victory. In contrast, defeats or draws are penalized by negative abnormal returns of 1.4% and 0.6% respectively. They also find out that much larger abnormal returns are generated after promotion and relegation games.
Another research published by Brown and Hartzell (2001) captured the impact of Boston Celtic’ basketball games results on share returns, trading volume, and volatility. They observed that investors respond asymmetrically to wins and losses, meaning that losses affect significantly the stock price, while wins do not. They also noticed that playoff games have a larger impact on returns than regular-season games.
Later, Ashton, Gerrard, and Hudson (2003) reported a strong association between the performance of the national soccer team of England and the daily changes in the DOW JONES index, in which are included the 100 largest companies listed on the London Stock Exchange. As it is found in this paper good or bad performances of the national team correspond to good or bad performances of the index.
In 2006, Standtmann (2006) used stock market data for Borussia Dortmund to apply the news model. The case of a publicly-traded sports club is a very appropriate candidate for testing this model and he tried to analyze how information could influence Borussia’s stock price. Consequently, by applying another model: the reversed news model, they found out that sport as well as corporate governance-related variables are important drivers of the stock price. Always keeping with sporting performances and stock price Duque and Ferreira (2005) focused their attention on soccer shares quoted in Euronext Lisbon Stock Exchange finding a correlation between stock price returns and soccer results. They used the ARCH and GARCH methodology to find the immediate impact of victories, draws or defeats on price returns. They
11
also discovered that this kind of relations, as well as the trading volume around the stocks, are stronger with the approach of the end of the season.
Berument, Ceylan, and Gozpinar (2006) focused their attention on the Turkish league to assess
the effect of soccer success on stock market returns for the three major teams (Besiktas, Fenerbahçe and Galatasaray). They analyzed the impact of the emotions from a victory against rivals. They found out that Besiktas’s wins against rivals increase stock market returns. The same effect is not present for the other two big teams (Fenerbahçe and Galatasaray).
Considering the stock market reaction to sudden changes in investor mood Edmans, Garcia,
and Norli (2006) discovered a strong link between soccer outcomes and investor mood. They
found a significant market decline after national soccer losses in the World Cup. This loss effect is stronger in small stocks and more important games. They also extended their study to international cricket, rugby, and basketball games.
In 2008, Samagaio, Couto, and Caiado (2008) studied the connection between financial
performance, sporting performance, and stock market performance considering only English soccer clubs over the period from 1995 to 2007 and using the structural equation modeling. The main conclusions of the study indicate that the sports managers seek to achieve a minimum level of profit trying to maximize sporting performance and that financial and sporting factor scores are statistically correlated with stock returns, but not with risk.
In contrast with what Ashton et al. and Edmans et al. found, Klein, Zwergel, and Fock (2009) didn’t observe a correspondence between a specific national soccer team’s performance on the field and stock index prices. They first applied an event study approach, with a period between 1990 and 2006, to assess for a relation between soccer match results and the specific national stock index returns. Later, they also controlled for expectations about the most likely outcome of each game applying another variable, extrapolated from betting odds and integrated into a regression analysis. In both cases, the findings do not suggest a connection between a specific national soccer team’s win or loss and stock index prices. Therefore, those results seem to support market efficiency.
Palomino, Reneboog, and Zhang (2008) started from the assumption that soccer clubs listed on
the London Stock Exchange provide two pieces of information on a weekly basis: experts' expectations about game outcomes through the betting odds, and the game outcomes themselves. First, they found that the stock market reacts strongly to news about game outcomes, generating significant abnormal returns for winning teams that do not reflect rational
12
expectations, but they are induced by investor sentiment. This is not the case for losing teams. Second, there is no market reaction to the release of new betting information (odds) even though they are excellent predictors of the game outcomes. They concluded that investors ignore some public information such as betting odds, and betting information predicts a stock price overreaction to game results which is influenced by investors' mood and expectation (especially when the teams are strongly expected to win).
Baur and McKeating (2009) studied the performance of European soccer clubs that undergo an
initial public offering (IPO). Through an event study and using a unique time-series and cross-section dataset consisting of domestic and international performance data, they investigated the effects of a soccer club’s on-field performance before and after the IPO. The study started from the assumption that soccer clubs who access those markets should benefit as well. However, the conclusions of their study underlines as soccer clubs have a diminished domestic and international performance after the stock market listing.
Demir and Danis (2011) studied the relation between stock price reaction of Turkish listed
soccer clubs according to game results. They separated the matches according to the competition and the place where the match was played. Betting odds were used to control for the expectations before each game. Results confirmed an asymmetric stock market reaction to both wins and losses.
Bell, Brooks, Matthews, and Sutcliffe (2012) were the first to consider the importance of games
on the stock returns of English soccer clubs. The importance of the game was measured in two ways: first, they considered the extent to which the clubs are close rivals, second, they expected that each game becomes more important for those clubs likely to be promoted or relegated as the season comes to the end, giving more information about the final league position of the club. They concluded that stock prices are affected more by the results of important matches than matches of lesser importance. They finally observed that the difference between the number of points made by the club from a given match, and the number of expected points for that specific match affect its stock price, as well as the number of goals that the club under question scores in the match, relative to its competitor.
Jorgensen, Moritzen, and Stadtmann (2012) applied the news model, as it did Stadtmann in his
former researches, to Brøndby IF soccer club listed in Denmark. According to the news model of asset price determination, only the unexpected component of information should drive the stock price. They found that new information was the main driver of the Brondby’s stock price.
13 In 2012 Berument and Ctylan (2012) took data from Chile, Spain, Turkey, and the United
Kingdom to assesses the effects of domestic soccer teams’ performances against foreign rivals on stock market returns. They found that the results of soccer teams in international cups affect stock market returns and the risk-return relationship. More specifically in Spain and in the UK (countries where soccer success is higher) suggest that losses are associated with lower returns and higher risk aversion (agents become less risk-loving) while in Chile and Turkey (where soccer success is lower) reveals that wins are associated with higher returns and lower risk aversion (agents become more risk-loving).
Castellani, Pattitoni, Patuelli (2013) tested the link between soccer match results and stock
returns of 23 listed European soccer teams. They also took into account betting odds to differentiate between expected and unexpected wins and losses. They found that wins (ties and losses) are followed by positive (negative) abnormal returns. Additionally, abnormal returns following unexpected results are then found to be statistically significant and larger in the positive (negative) effects of wins (losses).
Saraç and Zeren (2013) focused their attention on the Turkish league. They based their analysis
on the data Beşiktaş, Galatasaray and Fenerbahçe, considered “the big three” in Turkey. They applied several regression models to investigate the effect of soccer performance on the clubs’ stock returns, by controlling for different variables such as the betting odds before the match and the type of the match (i.e., international or derby). They found that the soccer performance is significantly and positively related to the stock returns for all three clubs, especially for Beşiktaş compared to the other two.
In 2015 Sun and Wu (2015) took into consideration the stock prices of the Italian traded soccer
club Juventus. They also applied and tested the theory of the news model. The news model considers changes in stock prices the consequence of unexpected new public information. Applying this model, they found that unexpected match results of Juventus affect the stock price of the club. Also, following the reversed news model, they proved that corporate governance news can also have an important role in driving the stock prices.
Godinho and Cerqueira (2016) started from the assumption that only the unexpected part of a
game result should influence the stock prices. They did their investigation for 13 clubs of six different European countries. They aimed to analyze the relationship between the stock returns and sporting outcomes using betting odds to separate the unexpected component from the expected component of the results. They also consider a new measure to weight the various
14
matches for their importance. The results confirm a significant relationship between stock price and sporting performance for most of the teams analyzed.
As mentioned in previous literature, behavioral biases depending on investors mood may sometimes influence the market. As soccer results have been proved to affect investors’ mood,
Toraman, Seyhan, Buğan, and Kılıç (2016) investigated the effect of match results of national
soccer teams on stock markets. They included in the research national soccer teams of various countries where soccer is popular, namely: England, Italy, France, Spain, and Turkey. Through the event study methodology, they showed that different match results in different countries cause different reactions across the stock markets. Therefore, from those findings, no common results for all countries are achieved.
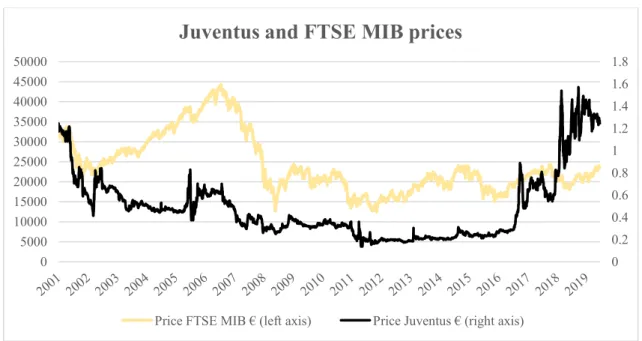
Vicentini and Graziano (2016) started from the point that recent studies specified the
importance of sporting mega-events (such as the Olympic Games or the FIFA World Cup) on the analysis of investor moods. Consequently, they analyzed how the Italian national soccer team results in the FIFA World Cup between 2002-2014 influenced the tendency of national stock FTSE MIB indexes. The results show how soccer results during the World Cup can have a strong impact on investor mood and therefore, how they influence stock market returns. Alternatively, Gimet and Montchaud (2016) wanted to investigate the main determinants of European soccer clubs’ stock returns and volatility. They collected data for 24 European Soccer clubs to test several quantities of different variables. They found out that clubs’ stock returns are influenced by a different set of internal variables (such as profit, capitalization), while the volatility of stock return depends just on less proportion on games results, but mostly on the overall instability on stock markets and clubs’ profit and net players’ transfers.
Dimic, Neudl, Orlov, and Äijö (2018) investigated the stock price reactions of traded soccer
clubs following league matches. They collected data on soccer games and betting odds to test investor reaction on positive or negative information. They discovered that stock price movement to positive information increases in surprise, while bad information connotes negative and ample reactions regardless of the surprise component. Finally, they state that negative news is more slowly absorbed by the stock market than positive news and that, investor reactions are larger following the games with a higher emotional component.
Also, in 2018, Alp, Kucukkocaoglu, and Sultanoglu (2018) started from the match-fixing scandal of Fenerbahçe that happened during the season 2010-2011 to test the impact of the news about this event on Fenerbahçe stock return volatility. They categorized all the announcements
15
into five different news types to better analyze the impact on the volatility of Fenerbahçe’s stock return by using the GARCH model. The findings suggest that any news related to the scandal event of match-fixing have a significant and positive effect on the Fenerbahçe’s stock return volatility.
Most recently, Boțoc, Mihancea, and Molcuț (2019) focused their attention on the Italian soccer league. They aimed to test the link between sport performance and correspondent stock price for the Italian listed soccer clubs (Juventus, Lazio, AS Roma). As most of the literature also confirms, their results imply that soccer wins are likely to have a positive impact on stock price and vice versa. This is more evident in local stocks as they are owned by local investors.
16
3. Data and variables
The length and the quantity of data collected differ for each of the fourth time I analyzed, since, Manchester United, Juventus, Borussia Dortmund, and AS Roma were listed in different periods.
AS Roma was the first team entering the stock market in May 2000, a few months later, in October 2000 was the time of Borussia Dortmund. Juventus made its IPO in December 2001, while finally, Manchester united shares have been listed on Wall Street in 2012, after delisting from the London stock exchange in 2005.
3.1 Stock prices and returns
Stock prices were compiled for each club, on a daily base from their IPO date until December 2019 from DataStream. Daily returns are computed as continuous compounding return using the following formula:
𝑅𝑡 = ln ( 𝑃𝑡
𝑃𝑡−1);
where 𝑅𝑡 represents the daily stock price return, 𝑃𝑡 the stock price at a specific day and 𝑃𝑡−1 the stock price the day before.
Stock market indexes were also collected from DataStream for each country considered as a benchmark to test the correlation of the overall stock market with each team share price. Daily stock market returns were computed in the same way as it was for soccer stock price returns. In particular, FTSE MIB was considered for the Italian stock exchange (Juventus and AS Roma), Dow Jones for the New York Stock Exchange (Manchester United), and DAX30 for the German stock exchange (Borussia Dortmund).
3.2 Betting odds and match results
Regarding match results and betting odds, different sources were used: for what concerns national league games (Premier League, Serie A, Bundesliga) data were collected from the website www.soccer-data.co.uk, while European game results (UEFA Champions League and UEFA Europa League) from the website worldfootball.net. All betting odds have been computed from the website betexplorer.com which compares the odds of many different betting operators. For my thesis purpose, I merely considered the odds for the home win, draw and away win of each match for each club I analyzed, taking an average of the odds given by each
17
betting operator available on the website. Nor any other type of bet has been considered, such as the number of goals scored, the first team to score a goal, the minute or period of the first goal, etc.
Once I collected all those data, the first step was to determine the most likely scenario (expected result) that can occur for each game of each team (home win, draw or away win). From betting odds, everyone can see the most likely outcome given by the bookmakers.
After I got all the expected results for each game, I compared them with the actual results on the field and consequently noticed if some unexpected points were deriving from the difference between the actual points gained by each team on the field and the expected points resulting by the odds forecast.
Betting odds, unexpected points (example for Borussia Dortmund)
This table refers to a game at the home stadium of Borussia Dortmund against 1. FSV Mainz 05 on the 13th of March 2016, the odds respectively for home win draw and away win were
1.35, 5.00, 8.50. As it results from the odds the most likely scenario (expected result) is a home win, so the expected results, in this case, is a win for Borussia Dortmund.
The actual score on the field was 2-0 for Borussia Dortmund, and since Borussia Dortmund was expected to win there are not unexpected points resulting in this specific game.
Betting odds, unexpected points (example for AS Roma)
This table refers to a home match of AS Roma against Atalanta on the 10th of November 2019,
the odds respectively for home win, draw, and away win were 2.20, 3.80, 3.00. As it results
Date Match Result Betting Odds
(1 X 2) Actual Points Most likely scenario Unexpected Points 13/06/2016 Borussia Dortmund vs Mainz 2-0 3.10 3.60 2.20 3 Home win 0
Date Match Result Betting Odds (1 X 2) Actual Points
Most likely scenario Unexpected Points 10/11/2019 AS Roma vs Atalanta 0-2 2.20 3.80 3.00 0 Home win -3
18
from the odds, even in this case, the most likely scenario (expected result) is the home win, so the expected results, in this case, is a win for AS Roma.
On the contrary, the actual result was a win for Atalanta. Hence, since AS Roma was expected to win, there are (-3) unexpected points resulting in this specific game.
Betting odds, unexpected points (example for Juventus)
This table refers to an away match of Juventus against Chelsea on the 19th of September 2012,
the odds respectively for home win, draw, and away win were 1.91, 3.40, 4.00. As it results from the odds, the most likely scenario (expected result) is a home win, so the expected results, in this case, is a loss for Juventus.
On the contrary, the actual result was a draw. Hence, since Juventus was expected to lose there is (1) unexpected point arising for this specific game.
Betting odds, unexpected points (example for Manchester United)
This table refers to an away match of Manchester United against Olympiakos on the 25th of
February 2014, the odds respectively for home win, draw, and away win were 3.20, 3.25, 2.25. As it results from the odds, the most likely scenario (expected result) is an away win, so the expected results, in this case, is a win for Manchester United.
On the contrary, the actual result was a win for Olympiakos. Hence, since Manchester United was expected to win there are (-3) unexpected points arising for this specific game.
Date Match Result Betting Odds (1 X 2) Actual Points
Most likely scenario Unexpected Points 19/09/2012 Chelsea vs Juventus 2-2 1.91 3.40 4.00 1 Home win 1
Date Match Result Betting Odds (1 X 2) Actual Points
Most likely scenario Unexpected Points 25/02/2014 Olympiakos vs Manchester United 2-0 3.20 3.25 2.25 0 Away win -3
19
3.3 Other Variables
I implemented a wide range of variables, to better test the impact of soccer results on stock price performances. All the variables I used to carry on my analysis are listed below:
• ∆Team is a variable that marks the percentage change in the stock prices of each club; • ∆StockMkt is a variable that indicates the percentage change in the corresponding stock
market index;
• League_Act is a variable that measures the number of points gained in games in the national competition;
• EU_Act is a variable that measures the number of points gained in European matches; • DummyLeague is a dummy variable that takes value 1 when there is a national game
(Premier League, Serie A, Bundesliga) and value 0 otherwise (Champions League, Europa League);
• League_UnExp is a variable that measures the unexpected points for each national league game, as it is given by the difference between the actual result on the field and the expected outcome anticipated by the odds;
• EU_UnExp is a variable that captures the difference between the actual result on the field and the expected outcome anticipated by the odds, but for European games; • CL_UnExp captures the unexpected points coming from Champions League matches; • EL_UnExp captures the same value, but for Europa League games;
• DummyCL is a dummy variable that takes value 1 when there is a Champions League game and 0 otherwise (National League or Europa League game);
• Rivals_UnExp is a variable that gives the unexpected points arising from matches against the main competitors or historical rivals in the national league. Rivals have been chosen based on two criteria:
1. Territorial proximity, hence, matches against soccer teams from the same region or city of the teams under analysis have been considered;
2. Games against clubs that, during the period studied, have competed for the national title or the same target of the teams treated;
• Crucial_UnExp is a variable that counts the unexpected points resulting from European matches played from quarter-finals on.
20
4. Empirical hypothesis and methodology
My dissertation aims to verify whether there is a relationship between the stock performance of each team on the market and the results on the field. To accomplish it, several regression models have been considered.
The first equation tries to capture the overall correlation between the stock market and stock price daily returns:
∆𝑇𝑒𝑎𝑚𝑡 = 𝛽0+ 𝛽1∆𝑆𝑡𝑜𝑐𝑘𝑀𝑘𝑡 + 𝜀𝑡; (1)
The first model serves as a control specification. Therefore, we can separate which part of the variance in the change in stock prices is explained by changes in overall market conditions and match outcome variables, respectively.
The second model tests the impact of a win, a draw or a loss in national or international game on stock price returns the day after a match:
∆𝑇𝑒𝑎𝑚𝑡+1 = 𝛽0+ 𝛽1∆𝑆𝑡𝑜𝑐𝑘𝑀𝑘𝑡𝑡+1+ 𝛽2𝐿𝑒𝑎𝑔𝑢𝑒_𝐴𝑐𝑡𝑡 + 𝛽3𝐸𝑈_𝐴𝑐𝑡𝑡
+ 𝛽4𝐷𝑢𝑚𝑚𝑦𝐿𝑒𝑎𝑔𝑢𝑒 + 𝜀𝑡
(2)
The third model focuses on the unexpected component coming from betting odds, to detect the stock price reaction after an unexpected result on the field. In this way it is possible to test if the unexpected information is significant:
∆𝑇𝑒𝑎𝑚𝑡+1= 𝛽0 + 𝛽1∆𝑆𝑡𝑜𝑐𝑘𝑀𝑘𝑡𝑡+1+ 𝛽5𝐿𝑒𝑎𝑔𝑢𝑒_𝑈𝑛𝐸𝑥𝑝𝑡 + 𝛽6𝐸𝑈_𝑈𝑛𝐸𝑥𝑝𝑡+ 𝛽4𝐷𝑢𝑚𝑚𝑦𝐿𝑒𝑎𝑔𝑢𝑒 + 𝜀𝑡
(3)
Someone may argue that the variable that measures the outcome of the European matches is a combination of games that are played in the Champions League and games that are played in
21
the Europa League competition. Hence, I set a new model (fourth model) that provide further insights separating the outcomes of the two competitions:
∆𝑇𝑒𝑎𝑚𝑡+1= 𝛽0+ 𝛽1∆𝑆𝑡𝑜𝑐𝑘𝑀𝑘𝑡𝑡+1+ 𝛽5𝐿𝑒𝑎𝑔𝑢𝑒_𝑈𝑛𝐸𝑥𝑝𝑡 + 𝛽6𝑎𝐶𝐿_𝑈𝑛𝐸𝑥𝑝𝑡+
𝛽6𝑏𝐸𝐿_𝑈𝑛𝐸𝑥𝑝𝑡+ 𝛽4𝐷𝑢𝑚𝑚𝑦𝐿𝑒𝑎𝑔𝑢𝑒 + 𝛽7𝐷𝑢𝑚𝑚𝑦𝐶𝐿 + 𝜀𝑡;
(4)
For the fifth model, the goal was to test if the unexpected outcomes against rivals and competitors in national leagues may affect more the stock price, as it is reasonable to assume that people and investors are more influenced by those type of matches:
∆𝑇𝑒𝑎𝑚𝑡+1= 𝛽0+ 𝛽1∆𝑆𝑡𝑜𝑐𝑘𝑀𝑘𝑡𝑡+1+ 𝛽5𝐿𝑒𝑎𝑔𝑢𝑒_𝑈𝑛𝐸𝑥𝑝𝑡 + 𝛽6𝑎𝐶𝐿_𝑈𝑛𝐸𝑥𝑝𝑡+ 𝛽6𝑏𝐸𝐿_𝑈𝑛𝐸𝑥𝑝𝑡+ 𝛽8𝑅𝑖𝑣𝑎𝑙𝑠_𝑈𝑛𝐸𝑥𝑝𝑡+ 𝛽4𝐷𝑢𝑚𝑚𝑦𝐿𝑒𝑎𝑔𝑢𝑒 + 𝛽7𝐷𝑢𝑚𝑚𝑦𝐶𝐿 + 𝜀𝑡;
(5)
Finally, the last model wants to test if crucial European matches (from quarter-finals on) may have a stronger impact on stock prices. This last model has been applied just for Juventus since it is the only team out of the others in my analysis, that had been a considerable and constant presence in those type of games. Over the last 20 years, Juventus took part in 29 “crucial” European Games. ∆𝑇𝑒𝑎𝑚𝑡+1= 𝛽0+ 𝛽1∆𝑆𝑡𝑜𝑐𝑘𝑀𝑘𝑡𝑡+1+ 𝛽5𝐿𝑒𝑎𝑔𝑢𝑒_𝑈𝑛𝐸𝑥𝑝𝑡 + 𝛽6𝑎𝐶𝐿_𝑈𝑛𝐸𝑥𝑝𝑡+ 𝛽6𝑏𝐸𝐿_𝑈𝑛𝐸𝑥𝑝𝑡+ 𝛽8𝑅𝑖𝑣𝑎𝑙𝑠_𝑈𝑛𝐸𝑥𝑝𝑡+ 𝛽9𝐶𝑟𝑢𝑐𝑖𝑎𝑙_𝑈𝑛𝐸𝑥𝑝𝑡+ 𝛽4𝐷𝑢𝑚𝑚𝑦𝐿𝑒𝑎𝑔𝑢𝑒 + 𝛽7𝐷𝑢𝑚𝑚𝑦𝐶𝐿 + 𝜀𝑡; (6)
Considering those regression models, several hypotheses are tested in this dissertation: • H1: A won match should influence stock returns positively;
• H2: A lost match should influence stock returns negatively;
• H3: A won/lost game in a European competition should influence stock returns to a larger extent than a win/defeat in the national competition;
22
• H5: The unexpected component of European game results should influence stock price returns to a larger extent than the unexpected component coming from national competition.
23
5. Analysis and Results
As I mentioned before I run five different regression models for each team, plus an extra one (model 6) just for Juventus. In this section, I will first analyze the outputs for each team separately, as the impact of soccer results on the stock price can differ depending on the club; and I will finally confront all club’s regression coefficients in a specific section.
5.1 Borussia Dortmund
In the following table are presented the coefficients and estimators for Borussia Dortmund measured for each model.
Model 1 Model 2 Model 3 Model 4 Model 5
𝛽0 Constant - -0.0302 -0.0073 -0.0119 -0.0119 𝛽1 ∆StockMkt 0.3116∗∗∗ (13.89) 0.2703∗∗∗ (3.95) 0.2788∗∗∗ (4.00) 0.2823∗∗∗ (4.04) 0.2827∗∗∗ (4.04) 𝛽2 League_Act - 0.0103∗∗∗ (11.03) - - - 𝛽3 EU_Act - 0.0116∗∗∗ (5.90) - - - 𝛽4 DummyLeague - 0.0097∗∗ (2.09) 0.0098∗∗∗ (3.14) 0.0145∗∗∗ (2.62) 0.0144∗∗∗ (2.60) 𝛽5 League_UnExp - - 0.008∗∗∗ (9.90) 0.008∗∗∗ (9.87) 0.0078∗∗∗ (8.96) 𝛽6 EU_UnExp - - 0.0087∗∗∗ (4.89) - - 𝛽6𝑎 CL_UnExp - - - 0.0133∗∗∗ (4.52) 0.0133∗∗∗ (4.52) 𝛽6𝑏 EL_UnExp - - - 0.0036 (1.07) 0.0036 (1.07) 𝛽7 DummyCL - - - 0.0038 (0.60) 0.0038 (0.60) 𝛽8 Rivals_UnExp - - - - 0.0009 (0.39) Observations 5001 785 785 785 785 R2 0.0372 0.1907 0.1597 0.158 0.1581 Adjusted R2 0.037 0.1866 0.1554 0.1515 0.1505
Note: ***significance at 1% level; **significance at 5% level; *significance at 10% level; t-values (in parentheses)
In the first model, the slope coefficient indicates a positive relationship between the change in Borussia Dortmund stock price and the DAX30 daily returns. The estimated slope coefficient takes the value of 𝛽1 = 0.3116, meaning that a 1% change of the DAX30 leads to a change in the stock price of 0.3116%. The coefficient is statistically significant at the 1% level.
24
Concerning the second regression model, the estimated coefficients for League_Act and EU_Act measure the effect of the number of points gained in a Bundesliga match and a European match, respectively. Coefficients are positive and significantly different from zero. Hence, these results can be a confirmation of Hypotheses H1 and H2 since wins lead to higher stock returns and losses to lower stock returns. Even though the coefficient for European actual points is slightly higher than the one for national league games, both are not significantly different from each other. Consequently, this finding doesn’t match Hypothesis H3.
DummyLeague takes value 1 if it is a national league game and zero otherwise, therefore, the
coefficient, being positive and statistically significant and different from zero, indicates a positive variation of the stock price in correspondence with Bundesliga games.
As it is given by the difference from the actual result on the field and the expected outcome anticipated by the odds, the model 3 was estimated. Hypothesis H4 is verified because both variables, League_UnExp and EU_UnExp have positive and statistically significant estimated coefficients. Despite the coefficient for the unexpected points coming from European games is slightly higher than the coefficient estimated for the Bundesliga unexpected points, Hypothesis H5 seems not to be verified, since the two coefficients are not statistically significant from each other.
The fourth model goes deeper into the analysis of the European matches, which is a combination of games played in the UEFA Champions League and games that are played in the UEFA Europa League. Hence, it may be helpful to separate the outcomes of the two competitions (𝛽6𝑎 and 𝛽6𝑏). The estimated coefficient for the UEFA Champions League variable is positive, statistically significant, and larger than the coefficient estimated for UEFA Europa League and Bundesliga matches. This finding supports the assumption that the UEFA Champions League is the most important competition for European soccer clubs. Another dummy variable,
DummyCL, has been introduced to separate between Champions League games and Europa
League games.
Finally, as unexpected points coming from games against historical competitors (Bayern Munich and Schalke 04) can have a larger impact on stock price returns, a Rival_UnExp variable was created. The coefficient estimated for this variable is positive, but not statistically different from zero.
25
5.2 AS Roma
In the following table are presented the coefficients and estimators for AS Roma measured for each model.
Model 1 Model 2 Model 3 Model 4 Model 5
𝛽0 Constant -0.0002 -0.024 -0.0073 -0.0069 -0.0069 𝛽1 ∆StockMkt 0.3278∗∗∗ (10.90) 0.3213∗∗∗ (3.96) 0.3165∗∗∗ (3.91) 0.3188∗∗∗ (3.97) 0.3239∗∗∗ (4.03) 𝛽2 League_Act - 0.0087∗∗∗ (7.93) - - - 𝛽3 EU_Act - 0.0085∗∗∗ (3.82) - - - 𝛽4 DummyLeague - 0.0034 (0.68) 0.0072∗∗ (2.12) 0.0068 (1.26) 0.0068 (1.19) 𝛽5 League_UnExp - - 0.0075∗∗∗ (7.90) 0.0075∗∗∗ (7.98) 0.0068∗∗∗ (5.91) 𝛽6 EU_UnExp - - 0.0084∗∗∗ (4.53) - - 𝛽6𝑎 CL_UnExp - - - 0.0146∗∗∗ (6.17) 0.0146∗∗∗ (6.17) 𝛽6𝑏 EL_UnExp - - - -0.0003 (-0.11) -0.0003 (-0.10) 𝛽7 DummyCL - - - -0.0022 (-0.34) -0.0022 (-0.34) 𝛽8 Rivals_UnExp - - - - 0.002 (1.00) Observations 5116 885 885 885 885 R2 0.0227 0.1028 0.1080 0.1268 0.1278 Adjusted R2 0.0225 0.0987 0.1040 0.1208 0.1208
Note: ***significance at 1% level; **significance at 5% level; *significance at 10% level; t-values (in parentheses)
In the first model, the slope coefficient indicates a positive relationship between the change in AS Roma stock price and the FTSEMIB daily returns. The estimated slope coefficient takes the value of 𝛽1 = 0.3278 meaning that a 1% change of the FTSEMIB leads to a change in the stock price of 0.3278%. The coefficient is statistically significant and different from zero.
Considering the second model, the estimation for the coefficients representing the actual points gained in Serie A (League_Act) and European games (EU_Act) are positive and significantly different from zero. Hence, even in this case, the results can be a confirmation of Hypotheses H1 and H2. Here the coefficient for European actual points is slightly lower than the one for Serie A games, and both coefficients are not significantly different from each other.
26
Consequently, this finding doesn’t match Hypothesis H3. The coefficient DummyLeague is positive, but not statistically different from zero.
The third model for AS Roma also confirms that Hypothesis H4 is verified because both the coefficients for the variables, League_UnExp and EU_UnExp are positive and statistically significant. Despite the coefficient for the unexpected points coming from European games is slightly higher than the coefficient estimated for the Bundesliga unexpected points, Hypothesis H5 seems not to be verified, since the two coefficients are not statistically significant from each other. Introducing in the model the unexpected component, the DummyLeague variable becomes statistically significant and remains positive.
In the fourth model the estimated coefficient for AS Roma, Champions League games, is positive, statistically significant, and larger than the coefficient estimated for UEFA Europa League (that is negative and not significant) and Serie A matches. This finding confirms that even for AS Roma, UEFA Champions League is the most important and relevant competition. Dummy variable, DummyCL, is negative but statistically significant and different from zero. Finally, about the fifth model, unexpected points arising from games against main competitors and historical rivals (Juventus, Inter, Milan, Napoli, Lazio) seem to be not relevant, since the coefficient estimated is not statistically significant and different from zero.
27
5.3 Manchester United
In the following table are presented the coefficients and estimators for Manchester United measured for each model.
Model 1 Model 2 Model 3 Model 4 Model 5
𝛽0 Constant - -0.0032 -0.0007 -0.0021 -0.0022 𝛽1 ∆StockMkt 0.5620∗∗∗ (11.91) 0.5976∗∗∗ (5.98) 0.6049∗∗∗ (6.04) 0.6029∗∗∗ (6.00) 0.6061∗∗∗ (6.03) 𝛽2 League_Act - 0.0006 (0.87) - - - 𝛽3 EU_Act - 0.0021 (1.50) - - - 𝛽4 DummyLeague - 0.0008 (0.28) -0.0002 (-0.10) 0.0013 (0.32) 0.0010 (0.3) 𝛽5 League_UnExp - - 0.0006 (0.92) 0.0006 (0.92) 0.0001 (0.12) 𝛽6 EU_UnExp - - 0.0006 (0.46) - - 𝛽6𝑎 CL_UnExp - - - -0.0001 (-0.06) -0.0001 (-0.06) 𝛽6𝑏 EL_UnExp - - - 0.0019 (0.73) 0.0019 (0.73) 𝛽7 DummyCL - - - 0.0027 (0.59) 0.0027 (0.59) 𝛽8 Rivals_UnExp - - - - 0.0012 (0.93) Observations 1927 355 355 355 355 R2 0.0686 0.1019 0.0969 0.1010 0.1033 Adjusted R2 0.0681 0.0917 0.0866 0.0855 0.0852
Note: ***significance at 1% level; **significance at 5% level; *significance at 10% level; t-values (in parentheses)
In the first model, the slope coefficient indicates a positive relationship between the change in Manchester United stock price and the Dow Jones daily returns. The estimated slope coefficient takes the value of 𝛽1= 0.5620 meaning that a 1% change of the Dow Jones leads to a change in the stock price of 0.5620%. The coefficient is statistically significant and different from zero. Considering the second model, the estimation for the coefficients representing the actual points gained in European games (EU_Act) and the actual points for Premier League games (League_Act) are positive but not statistically significant and different from zero. Hence, it is possible to affirm that, in this case, Hypotheses H1 and H2 are not verified. Nevertheless, these findings seem to support Hypothesis H3, being the coefficient for European games larger than
28
the Premier League one. The coefficient DummyLeague is positive, but not statistically different from zero.
The third model revealed that all the coefficients regarding the unexpected component (League_UnExp and EU_UnExp) are positive, but not statistically significant and different from zero. Therefore, it means that the unexpected information has not a large impact on stock price returns. Hence, both hypotheses concerning the unexpected part coming from results (Hypothesis H4 and Hypothesis H5) are not verified. The variable, DummyLeague, becomes negative, but it is still not significant and different from zero.
Even going deeper in European games, as it is for the fourth model, separating Champions league from Europa league games, there is no evidence that the unexpected information coming from the results impact Manchester United’s stock price returns, since both the coefficients are not statistically significant and different from zero. Dummy variable, DummyCL, is positive but not statistically significant and different from zero.
Finally, with regard to the fifth model, unexpected points arising from games against main competitors and historical rivals (Chelsea, Manchester City, Liverpool, Tottenham, Arsenal) seem to be not relevant as well, since the coefficient estimated is not statistically significant and different from zero.
29
5.4 Juventus
In the following table are presented the coefficients and estimators for Juventus measured for each model.
Note: ***significance at 1% level; **significance at 5% level; *significance at 10% level; t-values (in parentheses)
In the first model, the slope coefficient indicates a positive relationship between the change in Juventus stock price and the FTSEMIB daily returns. The estimated slope coefficient takes the value of 𝛽1 = 0.3625 meaning that a 1% change of the FTSEMIB leads to a change in the stock price of 0.3625%. The coefficient is statistically significant and different from zero.
Considering the second model, the estimation for the coefficients representing the actual points gained in Serie A (League_Act) and European games (EU_Act) are positive and significantly different from zero. Hence, even in this case, the results can be a confirmation of Hypotheses H1 and H2. Here the coefficient for European actual points is slightly higher than the one for Model 1 Model 2 Model 3 Model 4 Model 5 Model 6
𝛽0 Constant - -0.0283 -0.0118 -0.0009 -0.001 -0.0007 𝛽1 ∆StockMkt 0.3625∗∗∗ (15.06) 0.3775∗∗∗ (6.12) 0.3974∗∗∗ (6.46) 0.4038∗∗∗ (6.57) 0.4011∗∗∗ (6.53) 0.3981∗∗∗ (6.48) 𝛽2 League_Act - 0.005∗∗∗ (5.43) - - - - 𝛽3 EU_Act - 0.0079∗∗∗ (4.6) - - - - 𝛽4 DummyLeague - 0.017∗∗∗ (3.88) 0.014∗∗∗ (5.55) 0.0032 (0.48) 0.0034 (0.52) 0.0031 (0.48) 𝛽5 League_UnExp - - 0.0046∗∗∗ (5.42) 0.0046∗∗∗ (5.43) 0.0053∗∗∗ (5.03) 0.0053∗∗∗ (5.04) 𝛽6 EU_UnExp - - 0.0068∗∗∗ (4.86) - - - 𝛽6𝑎 CL_UnExp - - - 0.0074∗∗∗ (5.04) 0.0074∗∗∗ (5.04) 0.0059∗∗∗ (3.53) 𝛽6𝑏 EL_UnExp - - - 0.0027 (0.57) 0.0027 (0.57) 0.0021 (0.46) 𝛽7 DummyCL - - - −0.0126∗ (-1.84) −0.0126∗ (-1.83) −0.0132∗ (-1.92) 𝛽8 Rivals_UnExp - - - - -0.0019 (-1.1) -0.0019 (-1.11) 𝛽9 Crucial_UnExp - - - 0.0066∗∗ (1.97) Observations 4704 843 843 843 843 843 R2 0.046 0.1275 0.1298 0.1366 0.1379 0.1418 Adjusted R2 0.0458 0.1233 0.1257 0.1304 0.1306 0.1336
30
Serie A games, and this seems to confirm Hypothesis H3. The coefficient DummyLeague is also positive and statistically different from zero.
The third model also confirms that Hypothesis H4 is verified because both the coefficients for the variables, League_UnExp and EU_UnExp are positive and statistically significant. The coefficient for the unexpected points coming from European games is slightly higher than the coefficient estimated for the Serie A unexpected points, consequently, Hypothesis H5 seems to be verified. Introducing in the model the unexpected component, DummyLeague remains positive but it’s not statistically significant anymore.
In the fourth model, the estimated coefficient CL_UnExp is positive, statistically significant, and larger than the coefficient estimated for UEFA Europa League (that is not significant) and Serie A matches. This finding confirms that even for Juventus Champions League is the most important and relevant competition. Dummy variable, DummyCL, is negative and statistically significant and different from zero at 10% level of confidence, meaning that for every Champions League match there is, on average, a negative impact on Juventus’ stock price returns.
With concern to the fifth model, again unexpected points arising from games against main competitors and historical rivals (Roma, Inter, Milan, Napoli, Lazio, Torino) seem to be not relevant, since the coefficient estimated is negative and not statistically significant and different from zero.
Finally, as I mentioned before one more regression model was introduced just for Juventus, in order to study the impact of crucial European Games from quarter-finals on. The coefficient for the variable Crucial_UnExp is positive, statistically different from zero, and higher than the other coefficients associated with unexpected points. This supports the assumption that important games played in a decisive moment of the European soccer season have a stronger impact on investors and stock price returns.
31
5.5 Summary of results
Model 1. All club’s regression coefficients
Variables Borussia Dortmund AS Roma Manchester United Juventus
𝛽0 Constant - -0.0002 - - 𝛽1 ∆StockMkt 0.3116∗∗∗ (13.89) 0.3278∗∗∗ (10.90) 0.5620∗∗∗ (11.91) 0.3625∗∗∗ (15.06)
Note: ***significance at 1% level; **significance at 5% level; *significance at 10% level; t-values (in parentheses)
Model 2. All club’s regression coefficients
Variables Borussia Dortmund AS Roma Manchester United Juventus
𝛽0 Constant -0.0302 -0.024 -0.0032 -0.0283 𝛽1 ∆StockMkt 0.2703∗∗∗ (3.95) 0.3213∗∗∗ (3.96) 0.5976∗∗∗ (5.98) 0.3775∗∗∗ (6.12) 𝛽2 League_Act 0.0103∗∗∗ (11.03) 0.0087∗∗∗ (7.93) 0.0006 (0.87) 0.005∗∗∗ (5.43) 𝛽3 EU_Act 0.0116∗∗∗ (5.90) 0.0085∗∗∗ (3.82) 0.0021 (1.50) 0.0079∗∗∗ (4.6) 𝛽4 DummyLeague 0.0097∗∗ (2.09) 0.0034 (0.68) 0.0008 (0.28) 0.017∗∗∗ (3.88)
Note: ***significance at 1% level; **significance at 5% level; *significance at 10% level; t-values (in parentheses)
Model 3. All club’s regression coefficients
Variables Borussia Dortmund AS Roma Manchester United Juventus
𝛽0 Constant -0.0073 -0.0073 -0.0007 -0.0118 𝛽1 ∆StockMkt 0.2788∗∗∗ (4.00) 0.3165∗∗∗ (3.91) 0.6049∗∗∗ (6.04) 0.3974∗∗∗ (6.46) 𝛽5 League_UnExp 0.008∗∗∗ (9.90) 0.0075∗∗∗ (7.90) 0.0006 (0.92) 0.0046∗∗∗ (5.42) 𝛽6 EU_UnExp 0.0087∗∗∗ (4.89) 0.0084∗∗∗ (4.53) 0.0006 (0.46) 0.0068∗∗∗ (4.86) 𝛽4 DummyLeague 0.0098∗∗∗ (3.14) 0.0072∗∗ (2.12) -0.0002 (-0.10) 0.014∗∗∗ (5.55)
32
Model 4. All club’s regression coefficients
Variables Borussia Dortmund AS Roma Manchester United Juventus
𝛽0 Constant -0.0119 -0.0069 -0.0021 -0.0009 𝛽1 ∆StockMkt 0.2823∗∗∗ (4.04) 0.3188∗∗∗ (3.97) 0.6029∗∗∗ (6.00) 0.4038∗∗∗ (6.57) 𝛽5 League_UnExp 0.008∗∗∗ (9.87) 0.0075∗∗∗ (7.98) 0.0006 (0.92) 0.0046∗∗∗ (5.43) 𝛽6𝑎 CL_UnExp 0.0133∗∗∗ (4.52) 0.0146∗∗∗ (6.17) -0.0001 (-0.06) 0.0074∗∗∗ (5.04) 𝛽6𝑏 EL_UnExp 0.0036 (1.07) -0.0003 (-0.11) 0.0019 (0.73) 0.0027 (0.57) 𝛽4 DummyLeague 0.0145∗∗∗ (2.62) 0.0068 (1.26) 0.0013 (0.32) 0.0032 (0.48) 𝛽7 DummyCL 0.0038 (0.60) -0.0022 (-0.34) 0.0027 (0.59) −0.0126∗ (-1.84)
Note: ***significance at 1% level; **significance at 5% level; *significance at 10% level; t-values (in parentheses)
Model 5. All club’s regression coefficients
Variables Borussia Dortmund AS Roma Manchester United Juventus
𝛽0 Constant -0.0119 -0.0069 -0.0022 -0.001 𝛽1 ∆StockMkt 0.2827∗∗∗ (4.04) 0.3239∗∗∗ (4.03) 0.6061∗∗∗ (6.03) 0.4011∗∗∗ (6.53) 𝛽5 League_UnExp 0.0078∗∗∗ (8.96) 0.0068∗∗∗ (5.91) 0.0001 (0.12) 0.0053∗∗∗ (5.03) 𝛽6𝑎 CL_UnExp 0.0133∗∗∗ (4.52) 0.0146∗∗∗ (6.17) -0.0001 (-0.06) 0.0074∗∗∗ (5.04) 𝛽6𝑏 EL_UnExp 0.0036 (1.07) -0.0003 (-0.10) 0.0019 (0.73) 0.0027 (0.57) 𝛽8 Rivals_UnExp 0.0009 (0.39) 0.002 (1.00) 0.0012 (0.93) -0.0019 (-1.1) 𝛽4 DummyLeague 0.0144∗∗∗ (2.60) 0.0068 (1.19) 0.0010 (0.3) 0.0034 (0.52) 𝛽7 DummyCL 0.0038 (0.60) -0.0022 (-0.34) 0.0027 (0.59) −0.0126∗ (-1.83)
33
6.Conclusions and limitations
This study has been realized to analyze whether information coming from soccer game results may influence stock price returns of listed company clubs i.e. AS Roma, Borussia Dortmund, Juventus, and Manchester United. The soccer industry proves a very appropriate candidate for applying this research due to specific characteristics: matches are very frequent, they occur when the markets are closed, become publicly available to all agents at the very same time, and have observable expectations due to the existence of betting odds.
Results show a similar pattern for AS Roma, Borussia Dortmund, and Juventus where Hypothesis H1 and Hypothesis H2 have been proved meaning that soccer outcomes influence stock price returns. It is also verified that the unexpected points extrapolated from betting odds have an impact on stock returns as well. The setting is not so clear when the study moves to the investigation of European competition games, since the difference with national games, in terms of stock price reaction, is not so remarkable for those 3 soccer teams. Nevertheless, UEFA Champions League games seem to have a larger impact on stock prices, being the main European competition. Therefore, it is reasonable to assume that UEFA Europa League results have a lower impact on the stock price than the outcome of the UEFA Champions League and national league matches. Moreover, the importance of the game, measured in terms of the degree of rivalry between the two-match competitors, appears to have a very modest impact on returns. The last model for Juventus also confirms that crucial games played in a European context, from the quarter-final on, have a large impact on investors and consequently on Juventus stock price.
With a focus on Manchester United, even though positive coefficients have been found for actual and unexpected points related to national and European game results, they are not significant and different from zero in statistical terms. Those findings can have several motivations behind, but two options seem to be the most reasonable ones.
First, despite disappointing results on the field in the last years, Manchester United excelled on the stock exchange. Since the first day the team was listed on the New York Stock Exchange in August 2012, the share price has gained almost 30% of its initial value. This is due to good management, considerable revenues coming from television rights, sponsorships, merchandising, partnerships, tours abroad, and tickets selling. Therefore, investors are not verily influenced by sports results, but how much more to the previous information.
34
A second reason behind those conclusions can be more related to cultural factors. British supporters are very loyal to their teams, they are usually extremely lucid, and they tend to not over-react in case in case of unexpected wins or losses. This investor–fan may be so trustworthy about their team that mere ownership provides all of the value in the investment. The ability of the firm to produce cash flows may be an irrelevant issue and neither motivates the initial stake in the firm, nor discourages disposal.
Finally, some limitations are present in my dissertation, as I didn’t explore the impact of the number of goals scored and the actual goal score difference as large wins or losses could influence investors’ reactions on the stock market. Moreover, my models did not consider the format of knockout matches that characterizes European competitions that could drive a soccer club to advance (be eliminated) even with a loss (win) in a specific match. Last, future research may investigate and explore more in-depth the reaction of stock prices on club-specific events, such as player transfers, announcement of a new coach, and contract renewals.