EUROPEAN ORGANIZATION FOR NUCLEAR RESEARCH (CERN)
CERN-EP-2017-286 2018/08/16
CMS-TOP-17-005
Measurement of the cross section for top quark pair
production in association with a W or Z boson in
proton-proton collisions at
√
s
=
13 TeV
The CMS Collaboration
∗Abstract
A measurement is performed of the cross section of top quark pair production in association with a W or Z boson using proton-proton collisions at a center-of-mass energy of 13 TeV at the LHC. The data sample corresponds to an integrated
lumi-nosity of 35.9 fb−1, collected by the CMS experiment in 2016. The measurement is
performed in the same-sign dilepton, three- and four-lepton final states. The pro-duction cross sections are measured to be σ(ttW) = 0.77+−0.120.11(stat)+−0.130.12(syst) pb and σ(ttZ) =0.99+−0.090.08(stat)+−0.120.10(syst) pb. The expected (observed) signal significance for the ttW production in same-sign dilepton channel is found to be 4.5 (5.3) standard deviations, while for the ttZ production in three- and four-lepton channels both the expected and the observed significances are found to be in excess of 5 standard devia-tions. The results are in agreement with the standard model predictions and are used to constrain the Wilson coefficients for eight dimension-six operators describing new interactions that would modify ttW and ttZ production.
Published in the Journal of High Energy Physics as doi:10.1007/JHEP08(2018)011.
c
2018 CERN for the benefit of the CMS Collaboration. CC-BY-4.0 license
∗See Appendix A for the list of collaboration members
1
1
Introduction
The 13 TeV center-of-mass energy of proton-proton (pp) collisions at the LHC opens the possi-bility for studying the processes at larger mass scales than previously explored in the labora-tory. The top quark-antiquark pair (tt) produced in association with a W (ttW) or Z (ttZ) boson is among the most massive signatures that can be studied with high precision. The theoretical cross sections at next-to-leading order (NLO) in quantum chromodynamics (QCD) for ttW and
ttZ production at√s=13 TeV are about 3–4 times higher than those at 8 TeV [1]. This, coupled
with the higher integrated luminosity collected at 13 TeV collisions, allows for a much more ac-curate study of these processes. Precise measurements of the production cross section for ttW and ttZ are of particular interest because these topologies can receive sizeable contributions from new physics (NP) beyond the standard model (SM) [2, 3]. Furthermore, these processes form dominant backgrounds to several searches for NP, as well as to the measurements of SM processes, such as tt production in association with the Higgs boson (ttH). In addition, ttZ pro-duction is the most sensitive process for directly measuring the coupling of the top quark to the Z boson. The Feynman diagrams for the dominant production mechanisms of these processes are shown in Fig. 1, to which the charge-conjugate states should be added.
¯ d u ¯t t W+ g d g g t Z/γ∗ ¯t t t
Figure 1: Representative leading-order Feynman diagrams for ttW and ttZ production at the LHC.
The ttZ cross section was measured by the CMS collaboration at√s = 7 TeV with a precision
of ≈ 50% [4]. At √s = 8 TeV CMS used multivariate techniques in events containing two,
three, or four charged leptons to measure the ttW and ttZ cross sections with a precision of 30 and 25%, respectively [5, 6]. The ttZ process was observed with a significance of 6.4 standard deviations, and evidence for ttW production was found with a significance of 4.8 standard de-viations. The ATLAS Collaboration analyzed events containing two and three charged leptons for its ttW measurement, and using two, three, and four charged leptons for the ttZ channel, achieving a similar precision [7]. In a more recent publication, the ATLAS Collaboration
re-ported the first measurement of the ttW and ttZ production cross sections at√s = 13 TeV [8]
with a significantly smaller data set than the one considered here.
In this paper we present measurements of the ttZ and ttW production cross sections at√s =
13 TeV with a data set corresponding to an integrated luminosity of 35.9 fb−1. The
measure-ments are performed using events in which at least one of the W bosons, originating from a top quark decay, further decays to a charged lepton and a neutrino, and the associated W or Z boson decays to a charged lepton and a neutrino or a charged lepton pair, where the charged
lepton (`) refers to an electron or a muon. The contribution from τ leptons are included through
their decays to electrons and muons. The analysis is performed in three exclusive final states, in which events with two leptons of same charge, denoted as same-sign (SS) dileptons, are used to extract the ttW signal, while events with three or four charged leptons that include a lepton pair of opposite charge and same flavor (OSSF) are used to measure the ttZ signal yield. In addition to the individual ttW and ttZ cross section measurements, a fit is performed in all three final
states to simultaneously extract these cross sections. Furthermore, the results are interpreted in the context of an effective field theory to constrain the Wilson coefficients [9], which param-eterize the strength of new physics interactions, for a set of selected dimension-six operators that might signal the presence of NP contributions in ttW and ttZ production.
2
The CMS detector
The central feature of the CMS apparatus is a superconducting solenoid of 6 m internal diame-ter, providing a magnetic field of 3.8 T. Within the solenoid volume are a silicon pixel and strip tracker, a lead tungstate crystal electromagnetic calorimeter (ECAL), and a brass and scintilla-tor hadron calorimeter (HCAL), each composed of a barrel and two endcap sections. Forward calorimeters extend the pseudorapidity (η) coverage provided by the barrel and endcap de-tectors. Muons are detected in gas-ionization chambers embedded in the steel magnetic flux-return yoke outside the solenoid. A more detailed description of the CMS detector, together with a definition of the coordinate system used and the relevant kinematic variables, can be found in Ref. [10]. Events of interest are selected using a two-tiered trigger system [11]. The first level, composed of custom hardware processors, uses information from the calorimeters and muon detectors to select events, while the second level selects events by running a version of the full event reconstruction software optimized for fast processing on a farm of computer processors.
3
Event and object selection
Events are selected by online triggers that require the presence of at least one electron or muon,
with transverse momentum, pT, greater than 27 or 24 GeV, respectively. The selection
efficien-cies for the signal and background events that pass all requirements are found to be greater than 95 and 98% for the dilepton analysis and for the three- and four-lepton analyses, respec-tively.
The Monte Carlo (MC) simulations are used to estimate some of the backgrounds, as well as to calculate the selection efficiencies for the ttZ and ttW signal events. The simulated events
for the Wγ∗, WW, tWZ, and for pairs of top quarks associated with a pair of bosons (ttVV,
where V = W, Z, or H) processes, are performed at leading order (LO) in QCD, and for ttZ,
ttW, tZq, tHq, tHW, WZ, WWZ, WZZ, ZZZ, ttγ∗, and Zγ∗ final states at NLO in QCD
us-ing the MADGRAPH5 [email protected] or v2.3.3 [12]. The NLO POWHEG v2 [13] generator is
used for the production of the ttH [14] and qq→ ZZ [15, 16] processes, while the gg → ZZ
process is generated at LO in QCD withMCFMv7.0 [17]. The simulated samples of ZZ events
are scaled to the cross sections calculated at next-to-next-to-leading order (NNLO) in QCD
for qq → ZZ [18] (using a scaling K factor of 1.1) and for gg → ZZ at NLO [19] (using
K = 1.7). The NNPDF3.0LO [20] parton distribution functions (PDFs) are used for the
sim-ulation generated at LO and the NNPDF3.0NLO [20] PDF for those generated at NLO. Parton
showering, hadronization, and the underlying event are simulated usingPYTHIAv8.212 [21, 22]
with the CUETP8M1 tune [23, 24]. The double counting of the partons generated with MAD
-GRAPH5 aMC@NLOand those withPYTHIAis removed using the MLM [25] and the FXFX[26]
matching schemes, in the LO and NLO generated events, respectively. All events are processed
through a simulation of the CMS detector based on GEANT4 [27] and are reconstructed with
the same algorithms as used for data. Simultaneous pp collisions in the same or nearby bunch crossings, referred to as pileup (PU), are also simulated. The PU distribution used in simulation is chosen to match the one observed in the data.
3
The theoretical cross sections for the ttW and ttZ signal processes are computed at NLO in
QCD using MADGRAPH5 aMC@NLO and found to be 0.628±0.082 and 0.839±0.101 pb [1],
respectively. These values are used to normalize the expected signal yields, as well as to rescale the measured signal strengths to obtain the final cross sections. In the calculation for ttZ, the cross section corresponds to a phase space where the invariant mass of all pairs of leptons is required to be greater than 10 GeV.
Event reconstruction uses the CMS particle-flow (PF) algorithm [28] for particle reconstruction and identification. Because of PU, there can be far more than one collision vertex reconstructed
per event. The reconstructed vertex for which the sum of the pTof the physics objects is largest
is chosen to be the primary pp interaction vertex. The physics objects here are the objects obtained by a jet finding algorithm [29, 30] applied to all charged tracks associated with this
vertex, plus the missing transverse momentum (pmissT ), which is computed as the magnitude of
the vector sum of the pTof all PF candidates.
Leptons are required to have pT > 10 GeV and|η| < 2.5(2.4)for electrons (muons) and must be isolated from the other particles produced in the collision. A relative isolation parameter,
Irel, is determined by a cone-based algorithm. For each electron (muon) candidate, a cone of
∆R = √(∆η)2+ (∆φ)2 = 0.3(0.4)is constructed around the track direction at the event
pri-mary vertex, where∆η and ∆φ are the respective differences in pseudorapidity and azimuthal
angle (in radians) relative to the lepton track. The scalar sum of the pTof all PF particles within this cone is calculated, excluding the lepton candidate and any charged particle not originat-ing from the selected primary vertex. Exclusion of such particles removes the PU contribution from the charged particles, and a correction is therefore still required for the neutral compo-nent. The average energy density deposited by neutral particles in the event, computed with
the FASTJET[30, 31] program, is therefore subtracted from the neutral component to the sum
of the pTof particles in the cone. The quantity Irelis then defined as the ratio of this corrected sum to the pT of the lepton candidate. An electron candidate is selected if Irel < 0.1 for all three analyses, while a muon candidate is selected if Irel < 0.25 for the three- and four-lepton analyses, and if Irel < 0.15 for the SS dilepton analysis. Consistency of the origination of the lepton from the primary vertex is enforced by requiring lepton transverse and longitudinal dis-placements from the primary vertex to be less than 0.05 and 0.1 cm, respectively. Additionally, the transverse impact parameter is required to be smaller than 4 standard deviations, where the impact parameter is the minimum spatial distance between the lepton trajectory and the primary vertex.
Jets are reconstructed by clustering PF candidates using the anti-kT algorithm [29] with a
dis-tance parameter R= 0.4. The influence of PU is mitigated through a charged-hadron
subtrac-tion technique, which removes the energy of charged hadrons not originating from the primary vertex [32]. Jets are calibrated in simulation, and separately in data, accounting for energy de-posits of neutral particles from PU and any nonlinear detector response. Calibrated jets with pT > 30 GeV and|η| < 2.4 are selected for the analysis. Furthermore, jets formed with fewer than three PF candidates or with electromagnetic or hadronic energy fractions greater than 99% are vetoed. A selected jet can also overlap with selected leptons and lead thereby to some
dou-ble counting. To prevent such cases, jets that are found within a cone of∆R =0.4 around any
of the signal leptons are removed from consideration.
A multivariate b tagging discriminator [33, 34] is used to identify jets that originate from the hadronization of b quarks (b jets). The selection criteria used in this analysis gives about 1% rate for tagging light-quark or gluon jets as b jets and a corresponding b tagging efficiency of
4
Event selection
4.1 SS dilepton analysis
We measure the production rate of ttW events in the decay channel that yields exactly two lep-tons with the same charge. Requiring the same electric charge for the two leplep-tons retains only one third of the signal in the dilepton final state. However, this selection significantly improves the signal-to-background ratio, as SS lepton pairs are produced in SM processes with relatively small cross sections. The main backgrounds to this analysis originate from misreconstruction effects: misidentification of leptons from heavy-quark decays, hereafter called nonprompt lep-tons to distinguish them from prompt leplep-tons originating from W and Z boson decays, and mismeasurement of the charge of one of the leptons in events with an oppositely charged lep-ton pair.
We select events with two SS leptons (µµ, µe, ee), requiring the pTof both leptons to be above
25 GeV. To avoid inefficiencies due to the trigger selection in the ee channel, the electron with higher pTis required to have pT >40 GeV. Events containing additional leptons passing looser identification and isolation requirements are vetoed. These loose identification and isolation criteria are the same as used to estimate the nonprompt background in data (see Section 5). The invariant mass of the two leptons must be greater than 12 GeV to suppress Drell–Yan (DY) and
quarkonium processes. To suppress Z→ e+e−events, the invariant mass of the two electrons
is required to lie outside the 15 GeV window around the Z boson mass M(Z)[35], followed by
the requirement that pmissT >30 GeV.
In order to distinguish these backgrounds from the signal, a multivariate analysis (MVA) has been developed. The MVA has been trained using the ttW signal and the main background process, using events with at least two jets, one or more of which are identified as b jets. Among the observables examined as inputs to the MVA training, the following are found to provide the
best discrimination between the signal and background: the number of jets, Nj, the number of
b jets, Nb, the scalar sum of pT of the jets, HT, pmissT , the highest-pT (leading) and the lowest-pT (trailing) lepton pT, the invariant mass calculated using pmissT and pT of each lepton, MT, the
leading and next-to-highest-pT(subleading) jet pT, and the separation∆R between the trailing
lepton and the nearest selected jet.
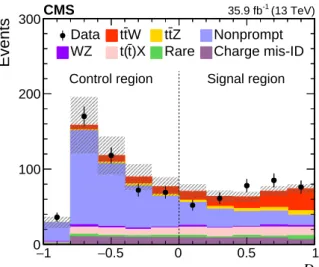
A boosted decision tree classifier with gradient boosting [36] is used as the MVA discriminant, and simulated events are split into equal training and testing samples. Figure 2 shows the kinematic distributions of variables used in the MVA, and Fig. 3 displays the output of the boosted decision tree classifier (D) for all background sources and the signal, scaled to the integrated luminosity of the analyzed data samples.
Events with D> 0 are selected to suppress the background from nonprompt leptons, and, for
final signal extraction, they are split into two categories: 0 < D < 0.6 and D > 0.6. These values are optimized to achieve the best expected sensitivity for ttW. Furthermore, the number of jets and b jets are also used to form five exclusive event categories that maximize signal
significance. The categories are formed using events with Nj = 2, 3, and>3. The latter two
categories are further split according to the number of b jets, Nb= 1 and Nb > 1. Events with
D < 0 are also used in the signal extraction procedure to constrain the uncertainties in the
nonprompt lepton background.
Each of these categories is further split into two sets according to the total charge of the lep-tons: `+`+ or`−`−. This increases the sensitivity to the charge-asymmetric production of the
signal (ttW+vs. ttW−) resulting from the pp nature of the collision at the LHC, while the main
4.1 SS dilepton analysis 5 j N 2 3 4 5 6 7 Events 100 200 300
400 DataWZ tt(tWt)X tRaretZ NonpromptCharge mis-ID
(13 TeV) -1 35.9 fb CMS b N 1 2 3 4 Events 1 − 10 1 10 2 10 3 10 Data ttW ttZ Nonprompt WZ t(t)X Rare Charge mis-ID
(13 TeV) -1 35.9 fb CMS [GeV] T H 200 400 600 800 1000 Events / 50 GeV 50 100 150 200 Data ttW ttZ Nonprompt WZ t(t)X Rare Charge mis-ID
(13 TeV) -1 35.9 fb CMS [GeV] miss T p 100 200 300 Events / 30 GeV 100 200 300 400 Data ttW ttZ Nonprompt WZ t(t)X Rare Charge mis-ID
(13 TeV) -1 35.9 fb CMS [GeV] T Trailing lepton p 40 60 80 100 120 Events / 10 GeV 100 200 300 400 Data ttW ttZ Nonprompt
WZ t(t)X Rare Charge mis-ID
(13 TeV) -1 35.9 fb CMS + µ + µ µ+e+ e+e+ µ−µ− µ−e− e−e− Events 50 100 150 200 250 300 350 Data ttW ttZ Nonprompt WZ t(t)X Rare Charge mis-ID
(13 TeV) -1 35.9 fb
CMS
Figure 2: Distributions of different variables in data from the SS dilepton analysis, compared
to the MC generated expectations. From left to right: jet and b jet multiplicity (upper), HT and
pmiss
T (center), trailing lepton pT and event yields in each lepton-flavor combination (lower).
The expected contributions from the different background processes are stacked, as well as the expected contribution from the signal. The shaded band represents the total uncertainty in the prediction of the background and the signal processes. See Section 5 for the definition of each background category.
D 1 − −0.5 0 0.5 1 Events 0 100 200 300 Data ttW ttZ Nonprompt WZ t(t)X Rare Charge mis-ID
Signal region Control region (13 TeV) -1 35.9 fb CMS
Figure 3: Distribution of the boosted decision tree classifier D for background and signal pro-cesses in the SS dilepton analysis. The expected contribution from the different background processes, and the signal as well as the observed data are shown. The shaded band represents the total uncertainty in the prediction of the background and the signal processes. See Section 5 for the definition of each background category.
4.2 Three-lepton analysis
The production rate of ttZ events is measured in the final state with three leptons.
We select events that contain exactly three leptons (µµµ, µµe, µee, or eee), requiring the leading,
subleading, and trailing lepton pT to be above 40, 20, and 10 GeV, respectively. To reduce
backgrounds from multilepton processes that do not contain a Z boson, we require at least one
OSSF lepton pair with invariant mass, M(``), consistent with the Z boson hypothesis, namely
|M(``) −M(Z)| <10 GeV.
Signal events are expected to have at least four jets, two of which originate from b quarks. When the events pass the jet and b jet requirements defined in the previous section, one obtains a sample of events enriched in signal, with minimal background contribution. However, nearly 70% of the signal events fail the requirement of having four jets with two of them identified as b jets. We therefore make use of lower jet and b jet multiplicities to form nine exclusive event categories to include a larger fraction of the signal events. These nine categories are formed using events with Nj =2, 3, and>3, where each jet multiplicity gets further split according to the b jet multiplicity, Nb=0, 1, and>1.
Despite the larger background contamination, the Nj = 3 categories, especially in bins with
larger Nb, improve the signal sensitivity, as this category recovers signal efficiency for the jets
that fall outside the acceptance. The Nj=2 category provides a background-dominated region
that helps to constrain the background uncertainties. We use all nine signal regions to extract the signal significance and the cross section.
4.3 Four-lepton analysis
In addition to the three-lepton final state, events with four leptons are exclusively analyzed for the measurement of the ttZ production rate.
The ttZ events in this channel are characterized by the presence of two b jets, pmissT , and four leptons, two of which form an OSSF pair consistent with the Z boson mass. The event selection
7
is optimized to obtain high signal efficiency in simulation in order to profit from low expected background yields. Events with exactly four leptons that pass the lepton identification and
isolation requirements described in Section 3 are selected. The leading lepton must have pT >
40 GeV and the pT of the remaining three leptons must exceed 10 GeV. The sum of the lepton
charges must be zero, and the invariant mass of any lepton pair is required to be greater than
12 GeV. At least one OSSF lepton pair with an invariant mass|M(``) −M(Z)| < 20 GeV must
be present in the event. Events with µµµµ, eeee, and µµee final states, in which a second OSSF lepton pair consistent with the Z boson mass is found, are rejected. Events containing two jets are selected and split into two categories for signal extraction: one with zero b jets and the other with at least one b jet.
5
Background predictions
5.1 Background due to nonprompt leptons
Nonprompt leptons, i.e. leptons from heavy-flavor hadron decay, misidentified hadrons, muons from light meson decays, or electrons from unidentified photon conversions, are strongly rejected by the identification and the isolation criteria applied on electrons and muons. Nonethe-less, a residual background from such leptons leaks into the analysis selection. Such back-grounds are mainly expected from tt production, in which one or two of the leptons origi-nate from the leptonic W boson decays and an additional nonprompt lepton comes from the
semileptonic decays of a b hadron, as well as from Z → ``events containing an additional
misidentified lepton. These backgrounds are estimated using a data-based technique. From a control sample in data, we calculate the probability for a loosely identified nonprompt lepton to pass the full set of tight requirements, designated as the tight-to-loose ratio. For loose lep-tons we choose a relaxed isolation requirement, Irel <1, and additional electron identification requirements on the variables that distinguish prompt electrons from hadrons and photons which are misidentified as electrons. The tight-to-loose ratios are measured in a data control sample of QCD multijet events that are enriched in nonprompt leptons. This control sample consists of events with a single lepton and at least one jet, where the lepton and jets are
sep-arated by ∆R > 1. We suppress the prompt lepton contamination, mostly from W+jets, by
requiring pmissT < 20 GeV and MT < 20 GeV, where MT is the transverse mass constructed
us-ing pmissT and the selected lepton. The residual prompt lepton contamination is subtracted using
estimates from MC simulation. This subtraction is relevant only for the high-pT leptons, and
its effect on the total estimated background does not exceed a few percent. These tight-to-loose
ratios are parametrized as functions of the η of the leptons and pcor
T , with the latter calculated through corrections to lepton pTas a function of the energy in the isolation cone. This definition
has no impact on the pTof the leptons that pass the isolation requirement, but modifies the pT
of those that fail, and extract thereby a more accurate value of true pT[37]. The tight-to-loose
ratios are then used together with the observed number of events in sideband regions. These sideband regions contain events that pass full event criteria in each analysis region, except that at least one of the leptons passes the loose selection but does not pass the tight selection. Each
event in this region is assigned a weight as a function of the pT and η of the loose lepton to
account for the probability of the lepton to pass the tight selection.
We validate this technique using simulated events. The tight-to-loose ratios are first measured for electrons and muons in simulated multijet events, and applied in simulated tt and Z+jets events in the same way as in data, to extract predictions for the nonprompt background contri-bution. These predictions agree very well with the observed yields in simulation, not only for the integral yields, but also for distributions in all kinematic variables used to form the analysis
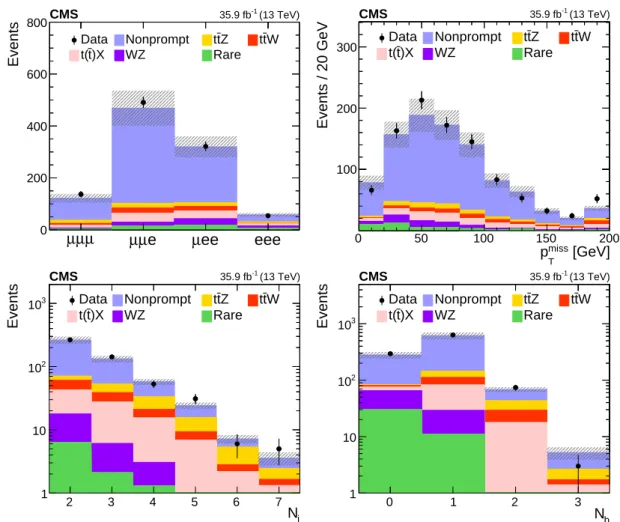
regions, including the boosted decision tree output D. Additionally, data control regions used in the signal-extraction regions and enriched in processes with nonprompt leptons, are formed to check any other potential sources of mismodeling. For the SS dilepton channel, we use the
region with D<0. Figure 4 shows the predicted background and observed data yields versus
Njand the pTof the trailing lepton. Events in this region are also used in the signal extraction procedure for ttW. The potential systematic effects for the extrapolation from D < 0 to D> 0 are studied in simulation and found to be negligible compared to other sources of uncertainty. For the three-lepton channel this control region is defined by either the absence of an OSSF lep-ton pair, or by the presence of an OSSF, with its invariant mass being at least 10 GeV away from
M(Z), and with at least one b jet present. This region is dominated by tt events in which both
W bosons decay leptonically and an additional nonprompt lepton is present. Figure 5 shows
the predicted and observed yields versus the flavor of the leptons, pmiss
T , Nj, and Nb. Both of these control regions show very good agreement between predicted and observed yields and for kinematic distributions that are relevant for the signal extraction.
Based on the extensive aforementioned validation in both data and simulated control samples, we conclude that a systematic uncertainty of 30% is appropriate for the prediction of the back-ground from nonprompt leptons. The statistical uncertainties due to the limited number of observed events in the sideband regions of data are taken into account, and are often found to be larger or comparable to the systematic uncertainty.
j N 2 3 4 5 6 Events 50 100 150 200 250
300 Datat(t)X NonpromptCharge mis-ID tRaretW tWZtZ
(13 TeV) -1 35.9 fb CMS [GeV] T Trailing lepton p 40 60 80 Events / 6 GeV 50 100 150 200 Data Nonprompt ttW ttZ )X t
t( Charge mis-ID Rare WZ
(13 TeV) -1 35.9 fb
CMS
Figure 4: Distributions of the predicted and observed yields versus Nj(left) and pTof the trail-ing lepton (right) in control regions enriched with nonprompt lepton background in the SS dilepton channel. The shaded band represents the total uncertainty in the prediction of the background and the signal processes. See Section 5 for the definition of each background cate-gory.
5.2 Background induced by the mismeasurement of the lepton charge
The charge mismeasurement rate for muons is negligible and background is significant only for the channels with at least one electron. This background is estimated with a partially data-based approach. The opposite-charge ee or eµ data events passing the full kinematic selection
are weighted by the pT- and η-dependent electron-charge misidentification probabilities. These
probabilities are obtained from MC simulation. The charge mismeasurement rate in simulation is validated through a comparison with data. It is measured in DY events in MC and in data, where events are selected when the two SS electrons have an invariant mass that falls within a Z
5.3 Background due toWZ production 9 µ µ µ µµe µee eee Events 0 200 400 600 800 Data Nonprompt ttZ ttW )X t t( WZ Rare (13 TeV) -1 35.9 fb CMS [GeV] miss T p 0 50 100 150 200 Events / 20 GeV 100 200
300 Datat(t)X NonpromptWZ tRaretZ ttW
(13 TeV) -1 35.9 fb CMS j N 2 3 4 5 6 7 Events 1 10 2 10 3 10 Data Nonprompt ttZ ttW )X t t( WZ Rare (13 TeV) -1 35.9 fb CMS b N 0 1 2 3 Events 1 10 2 10 3 10 Data Nonprompt ttZ ttW )X t t( WZ Rare (13 TeV) -1 35.9 fb CMS
Figure 5: Distributions of the predicted and observed yields versus different three-lepton chan-nels, pmissT (upper panels), and jet and b jet multiplicity (lower panels) in control regions en-riched with nonprompt lepton background. The shaded band represents the total uncertainty in the prediction of the background and the signal processes. See Section 5 for the definition of each background category.
rates in data and in DY simulation are in good agreement and vary from 4×10⁻⁵for low-pT
electrons in the barrel region to 4×10⁻³for high-pT electrons in the endcap.
The process contributing to this category of background in signal regions is primarily tt produc-tion. Based on the agreement in the charge mismeasurement rate between data and MC events, and the simulation studies of charge misidentification rate comparison between tt and DY MC events, we assign a 20% systematic uncertainty in the estimation of this background [38]. 5.3 Background due to WZ production
Kinematic distributions for the background from WZ events are taken from simulation. This background has the highest expected yields in the analysis region with no b-tagged jets. The data used for this analysis contain a substantial number of WZ events that can be isolated and compared with the MC predictions. We define a control region in a subset of the data with the
following requirements: we select events with three leptons, with the same pT thresholds as
the ones used in the ttZ selection, that have two leptons forming an OSSF pair with|M(``) −
M(Z)| < 10 GeV, less than two jets, and no b-tagged jets. Additionally pmiss
T is required to be
calculation, is required to be greater than 50 GeV.
This selection provides a data sample that is expected to be 85% pure in WZ events.
Fig-ure 6 shows the number of events as a function of MT, lepton flavor, Nj, and M(``). The
expected background from nonprompt leptons is measured from data using the method de-scribed above. The other background contributions are obtained from simulation. We observe overall agreement between data and the total expectation in all four-lepton channels and also in the kinematic distributions. The ratio of the total observed yield to the predicted one is found to be 0.94±0.07, where the uncertainty reflects only statistical sources. With this level of agreement between the data and MC prediction, we proceed without applying any corrections to the WZ prediction obtained from the simulation. The statistical uncertainty in the ratio is propagated to the final prediction. We also study possible mismodeling of the WZ + heavy-flavor background at large b jet multiplicities. We find that the WZ contribution at high b jet multiplicities is mainly caused by the misidentification of light-flavor jets as b jets. The fraction of WZ events containing at least one b quark is predicted by the simulation to vary between 5 and 15% across all of the analysis categories. We apply scale factors to take into account the differences in b tagging efficiencies and misidentification probabilities between data and sim-ulation [33, 34]. Once all the corrections are applied, we check the agreement between data
and Z+jets simulated events as a function of Nbin OSSF dilepton events consistent with the
M(Z). Based on this study, we assign a 10% systematic uncertainty to the WZ background
estimate, which covers the differences between data and expectations found in the control re-gion. For the three-lepton analysis, an additional 20% uncertainty is introduced for regions
with Nj > 3. Other systematic uncertainties associated with the extrapolation from this
con-trol region to high Njor Nb regions, such as jet energy scale and b tagging uncertainties, are
considered separately.
5.4 Background due to t
(
t)
X and other rare SM processesThe background events containing either multiple bosons or top quark(s) in association with a W, Z, or a Higgs boson are estimated from simulation scaled by their NLO cross section and normalized to the integrated luminosity. The backgrounds that have at least one top quark in final state, i.e. ttH, tWZ, tqZ, tHq, tHW, ttVV, and tttt, are denoted as t(t)X, while all others,
i.e. WW, ZZ, Wγ∗, Zγ∗, WWW, WWZ, WZZ, ZZZ, are grouped into the rare SM processes
category.
For background yields in the t(t)X category, we studied the theoretical and systematic
un-certainties separately. The theoretical unun-certainties for the inclusive cross section are around 10% [12, 39, 40]. Using the simulations, we study the effect of the changes made in renormal-ization and factorrenormal-ization scales (µRand µF), as well as the uncertainties from choice in PDF in the phase-space region relative to this analysis. From these studies we deduce an additional theoretical uncertainty of 2%. On the experimental side, to account for the differences in the lepton-selection efficiencies, b jet identification efficiencies, mistagging rate between the simu-lation and the data, we apply scale factors to the predictions obtained from simusimu-lations, and assign systematic uncertainties associated with these scale factors. These experimental uncer-tainties are estimated in each analysis category (see Section 6) and are applied in addition to the above-mentioned 10% uncertainty in the yield.
The rate for the backgrounds from rare SM processes, except ZZ, are assigned an overall 50% systematic uncertainty. This is motivated by the fact that these processes are not yet measured at the LHC and the uncertainties associated with the absence of higher-order effects might be large in the phase-space region relevant to this analysis. For the ZZ background, the
consis-11 [GeV] T M 0 50 100 150 200 Events / 10 GeV 500 1000 Data WZ ttZ ttW )X t t( Rare Nonprompt (13 TeV) -1 35.9 fb CMS > 50 T M µ µ µ µµe µee eee Events 500 1000 1500 2000 Data WZ ttZ ttW )X t t( Rare Nonprompt (13 TeV) -1 35.9 fb CMS j N 0 1 2 3 4 Events 1 10 2 10 3 10 4 10 Data WZ ttZ ttW )X t t( Rare Nonprompt (13 TeV) -1 35.9 fb CMS ) [GeV] ll M( 85 90 95 100 Events / 2 GeV 500 1000 1500 Data WZ ttZ ttW )X t t( Rare Nonprompt (13 TeV) -1 35.9 fb CMS
Figure 6: Distributions of the predicted and observed yields versus MT (upper left), lepton
flavor (upper right), jet multiplicity (lower left), and the reconstructed invariant mass of the
Z boson candidates (lower right) in the WZ-enriched control region. The requirements on MT
and Nj are removed for the distributions of these variables. The shaded band represents the
total uncertainty in the prediction of the background and the signal processes.
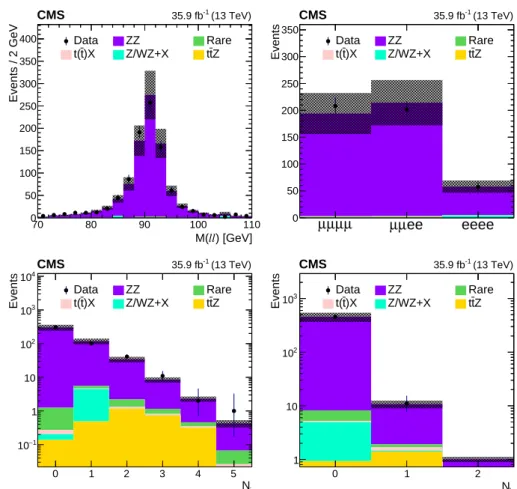
tency between data and simulation is validated in a ZZ-dominated background region. The events are selected following the first four steps mentioned in Section 4.2, in the given selection sequence, requiring two OSSF lepton pairs with an invariant mass within a 20 GeV window
of M(Z). The distributions of the expected and observed data yields in this ZZ enriched
con-trol region are shown in Fig. 7. The ZZ concon-trol region, which is better than 95% pure in ZZ events, shows good agreement between data and simulation in events with extra jets. Based on this study in the four-lepton control region, as well as considering the studies done for the WZ background at high jet multiplicities, we assign a 20% systematic uncertainty. Additional
experimental uncertainties, as previously described for the t(t)X and WZ backgrounds, are also
applied to the ZZ background.
6
Signal acceptance and systematic uncertainties
The uncertainty in the integrated luminosity is 2.5% [41]. Simulated events are reweighted according to the distribution of the true number of interactions at each bunch crossing. The uncertainty in the total inelastic pp cross section, which affects the PU estimate, is 5% [42] and it leads to a 1–2% uncertainty in the expected yields.
We measure the trigger efficiencies in a data sample independent from the one used for the signal selection, as well as in simulation. These efficiencies are measured for each channel
sep-) [GeV] ll M( 70 80 90 100 110 Events / 2 GeV 0 50 100 150 200 250 300 350 400 Data ZZ Rare )X t t( Z/WZ+X ttZ (13 TeV) -1 35.9 fb CMS µ µ µ µ µµee eeee Events 0 50 100 150 200 250 300 350 Data ZZ Rare )X t t( Z/WZ+X ttZ (13 TeV) -1 35.9 fb CMS j N 0 1 2 3 4 5 Events 1 − 10 1 10 2 10 3 10 4 10 Data ZZ Rare )X t t( Z/WZ+X ttZ (13 TeV) -1 35.9 fb CMS b N 0 1 2 Events 1 10 2 10 3 10 Datat(t)X ZZZ/WZ+X RarettZ (13 TeV) -1 35.9 fb CMS
Figure 7: Comparison of data with MC predictions for the mass of the Z boson candidate (upper left), event yields (upper right), jet multiplicity (lower left) and b jet multiplicity (lower right) in a ZZ-dominated background control region. The shaded band represents the total uncertainty in the prediction of the background and the signal processes.
arately and parametrized as a function of lepton pT and η. The overall efficiency for the SS
dilepton channel is higher than 95% and that for the three- and four-lepton analyses is greater than 98%. The trigger efficiencies measured in simulation agree within 1% with the measure-ments in data, with an exception of the SS dimuon channel, in which the difference reaches 3%. The event yields in simulation are therefore scaled to match the trigger efficiencies in data. The systematic uncertainty due to this scaling is 2–4% depending on the channel.
Reconstructed lepton selection efficiencies are measured using a “tag-and-probe” method [43,
44] in bins of lepton pT and η, and are higher than 65 (96)% for electrons (muons). These
mea-surements are performed separately in data and in simulation. The differences between these two measurements are typically around 1–4% per lepton, which corresponds to 3–7% for all leptons in the event. The systematic uncertainties related to this source vary between 2 and 7%.
Uncertainties in the jet energy calibrations are estimated by shifting the energy of jets in the
simulation up and down by one standard deviation. Depending on pT and η, the uncertainty
in jet energy scale changes by 2–5% [45, 46]. For the signal and backgrounds modelled through simulation, the resulting uncertainty is determined by the observed differences in yields with and without the shift in jet energies. The same technique is used to calculate the uncertainties caused by the jet energy resolution, for which the uncertainty is found to be 1–6%. These uncertainties are also propagated in the pmissT variable, and the resulting uncertainty in signal
13
selection is found to be around 1%. The b tagging efficiency in the simulation is corrected using scale factors determined from data [33, 34]. These contribute with an uncertainty of about 2–5%
on the predicted yields, which depend on pT, η and jet and b-tag multiplicity.
To estimate the theoretical uncertainties due to µRand µFchoices, each of these parameters is
varied independently up and down by a factor of 2, ignoring the anti-correlated variations. For the acceptance uncertainties, the envelope of the results is used as an uncertainty in each search bin, and found not to exceed 2%. The different replicas in the NNPDF30 PDF set [20] are used to estimate the corresponding uncertainty in acceptance, which is typically less than 1%. The theoretical uncertainty in the cross sections for top quark (pair) production in association with a Higgs boson or a vector boson is 11% [1]. For the WZ and ZZ backgrounds, the overall uncertainty in the cross section is 10%, with additional uncertainties at large jet multiplici-ties. Rare SM processes are assigned a 50% systematic uncertainty. All of the experimental uncertainties described above are evaluated for each process in all analysis categories. A 20% systematic uncertainty is assigned to the charge-misidentified background. The uncertainty in the nonprompt lepton contribution in the SS dilepton and three-lepton analyses is 30%, for which the statistical uncertainty in the observed yields in the sideband region is also taken into account.
The theoretical uncertainties for individual backgrounds as well as the systematic uncertainties for the nonprompt background are uncorrelated, but correlated across the analysis categories. The different sources of experimental uncertainty are correlated across the analysis categories and among the background and signal predictions. The statistical uncertainties from the lim-ited number of events in MC simulation and from the data events in the sideband regions are considered fully uncorrelated.
The impact of different sources of systematic uncertainty is estimated by fixing the nuisance parameter corresponding to each uncertainty one at a time and evaluating the decrease in the total systematic uncertainty. Uncertainties associated with the integrated luminosity, lepton identification, trigger selection efficiencies, nonprompt lepton, and t(t)X backgrounds have the greatest effect on both the ttW and the ttZ cross section measurements. The full set of systematic uncertainties is shown in Table 1.
7
Results
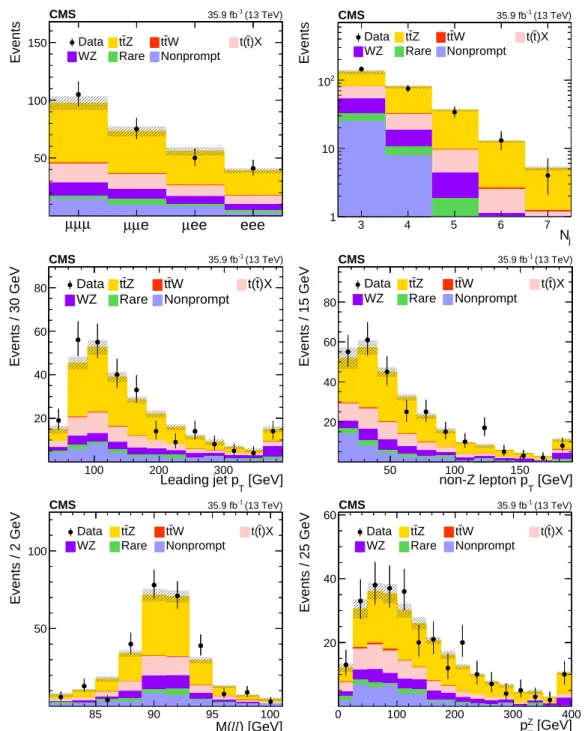
As described in Section 4, the data are analyzed in three exclusive channels according to the number of leptons in the final state: SS dilepton, three- and four-lepton events. Each channel is further categorized according to the number of jets and b-tagged jets. The predicted SM background and signal yields, and the observed data are shown in Figs. 8 and 9, and in Tables 2–5, for each of the above categories, respectively. In general, we find good agreement between the predicted yields and the observed data, except for some excess of events accumulated in the Nj=2, 3 and Nb>1 category of the three-lepton channel. Extensive studies were performed to ensure the robustness of the estimated background yields in this region. No hints of a missing or underestimated background were found; therefore, we attribute this excess to a statistical fluctuation in data. In Figs. 10 and 11, various kinematic distributions in the predicted and
observed yields are presented in ttW and ttZ signal-enriched regions: SS dileptons with Nj>2
and Nb>1, and three-lepton events with Nj >2 and Nb>0, respectively.
The statistical procedure to extract the cross section is detailed in Refs. [47–50]. The observed yields and background estimates in each analysis category, described in Section 4, and the
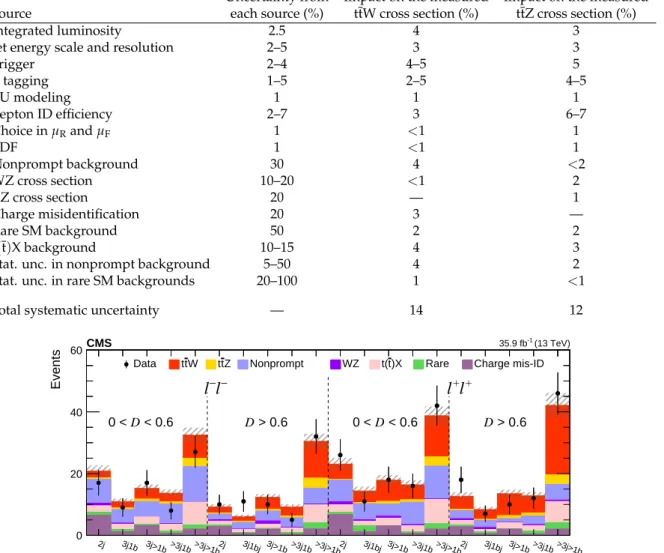
sys-Table 1: Summary of the sources of uncertainties, their magnitudes, and their effects in the final measurement. The first column indicates the source of the uncertainties, while the second column shows the corresponding input uncertainty on each background source and the signal. The third and fourth columns show the resulting uncertainties in the respective ttW and ttZ cross sections.
Uncertainty from Impact on the measured Impact on the measured Source each source (%) ttW cross section (%) ttZ cross section (%)
Integrated luminosity 2.5 4 3
Jet energy scale and resolution 2–5 3 3
Trigger 2–4 4–5 5 B tagging 1–5 2–5 4–5 PU modeling 1 1 1 Lepton ID efficiency 2–7 3 6–7 Choice in µRand µF 1 <1 1 PDF 1 <1 1 Nonprompt background 30 4 <2 WZ cross section 10–20 <1 2 ZZ cross section 20 — 1 Charge misidentification 20 3 — Rare SM background 50 2 2 t(t)X background 10–15 4 3
Stat. unc. in nonprompt background 5–50 4 2
Stat. unc. in rare SM backgrounds 20–100 1 <1
Total systematic uncertainty — 14 12
2j 3j1b 3j>1b >3j1b >3j>1b2j 3j1bj 3j>1b >3j1b >3j>1b2j 3j1bj 3j>1b >3j1b >3j>1b2j 3j1bj 3j>1b >3j1b >3j>1b Events 0 20 40 60
Data ttW ttZ Nonprompt WZ t(t)X Rare Charge mis-ID
− l − l < 0.6 D 0 < D > 0.6 + l + l < 0.6 D 0 < D > 0.6 (13 TeV) -1 35.9 fb CMS
Figure 8: Predicted signal and background yields, as obtained from the fit, compared to ob-served data in the SS dilepton analysis. The hatched band shows the total uncertainty associ-ated with the signal and background predictions, as obtained from the fit.
tematic uncertainties described in Section 6 are used to construct a binned likelihood function L(r, θ)as a product of Poisson probabilities of all bins. The parameter r is the signal-strength modifier and θ represents the full suite of nuisance parameters. The signal strength parameter
r =1 corresponds to a signal cross section equal to the SM prediction, while r=0 corresponds
to the background-only hypothesis.
The test statistic is the profile likelihood ratio, q(r) = −2L(r, ˆθr)/L(ˆr, ˆθ), and asymptotic ap-proximation is used to extract the fitted cross section, the associated uncertainties, and the significance of the observation of the signal process [47–50], where ˆθrreflects the values of the nuisance parameters that maximize the likelihood function for signal strength r. The quantities ˆr and ˆθ are the values that simultaneously maximize L.
15 j N 2 3 >3 2 3 >3 2 3 >3 Events 1 10 2 10 3 10 4 10 Data ttZ ttW WZ )X t t( Rare Nonprompt (13 TeV) -1 35.9 fb CMS = 0 b N = 1 b N > 1 b N b N 0 ≥1 Events 0 5 10 15 20 25 30 35 Data ttZ ZZ )X t t( Rare Nonprompt (13 TeV) -1 35.9 fb CMS
Figure 9: Predicted signal and background yields, as obtained from the fit, compared to ob-served data in Nj = 2, 3, and> 3 categories in the three-lepton analysis (left), and in Nb = 0, 1 categories in the four-lepton analysis (right). The hatched band shows the total uncertainty associated with the signal and background predictions, as obtained from the fit.
+ µ + µ µ+e+ e+e+ µ−µ− µ−e− e−e− 20 40 60 80 Events Data ttW ttZ Nonprompt WZ t(t)X Rare Charge mis-ID
(13 TeV) -1 35.9 fb CMS 100 200 300 [GeV] miss T p 20 40 60 Events / 30 GeV Data ttW ttZ Nonprompt WZ t(t)X Rare Charge mis-ID
(13 TeV) -1 35.9 fb CMS 3 4 5 6 7 j N 50 100 Events Data ttW ttZ Nonprompt WZ t(t)X Rare Charge mis-ID
(13 TeV) -1 35.9 fb CMS 50 100 150 200 250 [GeV] T Leading lepton p 20 40 60 Events / 20 GeV Data ttW ttZ Nonprompt WZ t(t)X Rare Charge mis-ID
(13 TeV)
-1
35.9 fb CMS
Figure 10: Predicted signal and background yields, as obtained from the fit, compared to
ob-served data versus the flavor and the charge combination of leptons (upper left), pmissT (upper
right), jet multiplicity (lower left), and the pTof the leading lepton (lower right) in the SS dilep-ton channel with at least three jets and at least two b jets. The last bin in each distribution includes the overflow events, and the hatched band shows the total uncertainty associated with the signal and background predictions, as obtained from the fit.
µ µ µ µµe µee eee 50 100 150 Events Data ttZ ttW t(t)X WZ Rare Nonprompt (13 TeV) -1 35.9 fb CMS 3 4 5 6 7 j N 1 10 2 10 Events Data ttZ ttW t(t)X WZ Rare Nonprompt (13 TeV) -1 35.9 fb CMS 100 200 300 [GeV] T Leading jet p 20 40 60 80 Events / 30 GeV Data ttZ ttW t(t)X WZ Rare Nonprompt (13 TeV) -1 35.9 fb CMS 50 100 150 [GeV] T non-Z lepton p 20 40 60 80 Events / 15 GeV Data ttZ ttW t(t)X WZ Rare Nonprompt (13 TeV) -1 35.9 fb CMS 85 90 95 100 ) [GeV] ll M( 50 100 Events / 2 GeV Data ttZ ttW t(t)X WZ Rare Nonprompt (13 TeV) -1 35.9 fb CMS 0 100 200 300 400 [GeV] Z T p 20 40 60 Events / 25 GeV Data ttZ ttW t(t)X WZ Rare Nonprompt (13 TeV) -1 35.9 fb CMS
Figure 11: Predicted signal and background yields, as obtained from the fit, compared to ob-served data in the three-lepton channel for events containing at least three jets and at least one b jet. From left to right: the lepton flavor and jet multiplicity (upper), pTof the leading jet and
the lepton not used to form Z (central), and invariant mass of the OSSF lepton pair and pTof the
reconstructed Z boson (lower). The last bin in each distribution includes the overflow events, and the hatched band shows the total uncertainty associated with the signal and background predictions, as obtained from the fit.
The measurement of the individual cross sections for ttW and ttZ is performed using the events in the SS dilepton, and the three- and four-lepton categories, respectively, while the ttW+(ttW−) signal extraction is performed using the SS dilepton category with`+`+(`−`−). The summary of the expected and observed signal significances for each of these processes is given in Table 6. We find an expected (observed) signal significance of 4.5 (5.3) standard deviations in the SS
17
Table 2: Predicted signal and background yields, as obtained from the fit, compared to observed
data in the SS dilepton channel for the D< 0 region, i.e. the nonprompt lepton control region.
The total uncertainty obtained from the fit is also shown.
Process Nj=2 Nj=3 Nj >3 Nonprompt 136.5±13.9 110.3±11.3 57.3±6.1 Total background 192.1±15.6 137.7±11.7 74.0±6.4 ttW 13.1±0.3 17.6±0.3 13.8±0.3 ttZ 1.6±0.4 3.1±0.7 4.4±1.0 Total 206.8±15.7 158.4±11.8 92.3±6.5 Observed 229 144 92
Table 3: Predicted signal and background yields, as obtained from the fit, compared to observed data in the SS dilepton final state. The total uncertainty obtained from the fit is also shown.
Nj Nb Background ttW ttZ Total Observed
`−`− 0<D<0.6 2 >0 18.1±1.8 2.2±0.4 0.5±0.1 20.8±1.9 17 3 1 8.3±0.9 2.1±0.4 0.5±0.1 10.9±0.9 9 >1 10.9±1.1 3.5±0.6 0.8±0.1 15.2±1.3 17 >3 1 10.1±1.1 2.8±0.5 0.7±0.2 13.7±1.3 8 >1 22.2±2.0 7.6±1.2 2.7±0.4 32.5±2.4 27 D>0.6 2 >0 6.8±0.9 2.0±0.3 0.4±0.1 9.2±0.9 10 3 1 4.1±0.6 1.6±0.3 0.3±0.1 6.1±0.6 11 >1 7.8±0.9 3.8±0.6 0.7±0.1 12.3±1.1 10 >3 1 5.6±0.7 2.9±0.5 0.7±0.2 9.2±0.9 5 >1 15.3±1.5 12.0±1.9 3.2±0.5 30.5±2.5 32 `+`+ 0<D<0.6 2 >0 17.9±1.8 4.9±0.8 0.3±0.1 23.1±2.0 26 3 1 10.2±1.3 3.7±0.6 0.4±0.1 14.4±1.4 11 >1 10.2±1.2 6.9±1.1 0.8±0.2 17.9±1.6 18 >3 1 10.7±1.2 4.9±0.8 0.8±0.2 16.4±1.4 16 >1 22.4±2.0 13.3±2.2 3.0±0.5 38.7±3.0 42 D>0.6 2 >0 8.0±1.1 4.3±0.7 0.4±0.1 12.7±1.3 18 3 1 4.8±0.7 3.2±0.5 0.3±0.1 8.4±0.9 7 >1 5.4±0.7 7.1±1.2 1.0±0.2 13.5±1.4 10 >3 1 6.3±0.8 5.6±0.9 0.9±0.2 12.8±1.2 12 >1 16.5±1.5 22.5±3.7 3.1±0.5 42.1±4.0 46
dilepton channel, and 4.7 (4.5) standard deviations in the four-lepton channel, while in three-lepton channel both the expected and the observed significances are found to be much larger
than 5 standard deviations. The expected (observed) signal significances for ttW+ and ttW−
processes are calculated as well, being 4.2 (5.5) and 2.4 (2.3), respectively.
The measured signal strength parameters are found to be 1.23+−0.190.18(stat)+−0.200.18(syst)+−0.130.12(theo) for ttW, and 1.17+−0.110.10(stat)+−0.140.12(syst)+−0.110.12(theo) for ttZ. These parameters are used to multiply the corresponding theoretical cross sections for ttW and ttZ mentioned in Section 3, to obtain the measured cross sections for ttW and ttZ:
Table 4: Predicted signal and background yields, as obtained from the fit, compared to observed data in the three-lepton final state. The total uncertainty obtained from the fit is also shown.
Nb Nj Background ttW ttZ Total Observed
0 2 1032.8±77.1 0.9±0.1 18.2±3.2 1051.9±77.2 1022 3 293.5±21.4 0.4±0.1 22.3±3.9 316.3±21.8 318 >3 95.4±7.4 0.3±0.1 26.1±4.6 121.8±8.7 144 1 2 164.6±17.8 1.9±0.3 24.3±4.3 190.7±18.3 209 3 66.6±6.7 0.9±0.2 41.2±7.2 108.7±9.8 99 >3 32.8±3.3 0.8±0.1 61.3±10.8 94.9±11.3 72 >1 2 12.9±2.4 1.0±0.2 5.9±1.0 19.8±2.6 32 3 11.6±1.7 0.6±0.1 17.9±3.2 30.1±3.6 46 >3 10.6±1.6 0.4±0.1 41.0±7.2 52.0±7.4 54
Table 5: Predicted signal and background yields, as obtained from the fit, compared to observed data in the four-lepton final state. The total uncertainty obtained from the fit is also shown.
Process Nb=0 Nb>0
Total background 12.8±2.0 3.3±0.3
ttZ 4.5±0.6 14.5±1.8
Total 17.2±2.0 17.8±1.8
Observed 23 15
Table 6: Summary of expected and observed significances (in standard deviations) for ttW and ttZ.
Channel Expected significance Observed significance
SS dilepton`−`−(ttW−) 2.4 2.3
SS dilepton`+`+(ttW+) 4.2 5.5
SS dilepton`±`±(ttW±) 4.5 5.3
Three-lepton (ttZ) >5.0 >5.0
Four-lepton (ttZ) 4.7 4.5
Three- and four-lepton combined (ttZ) >5.0 >5.0
σ(pp→ttZ) =0.99−+0.090.08(stat)+−0.120.10(syst) pb.
The measured cross sections for the ttW+and ttW−processes are:
σ(pp→ttW+) =0.58±0.09 (stat)+−0.090.08(syst) pb, σ(pp→ttW−) =0.19±0.07 (stat)±0.06 (syst) pb.
The individual measured cross sections for ttW and ttZ, as well as the results of a simultane-ous fit for these cross sections in all three analysis categories, SS dilepton, three-lepton, and four-lepton, are summarized in Fig. 12. The corresponding 68 and 95% confidence level (CL) contours and intervals are also shown. The cross section extracted for ttZ from the simulta-neous fit is identical to the one obtained from the individual measurement, while for ttW the simultaneous fit result is shifted down by about 6%, which is smaller than the total systematic uncertainty. This is because the fitted value for the nonprompt background contribution in the three-lepton channel is 9% higher than the nominal value, so the fitted nonprompt yields in the SS dilepton channel are higher in the combined fit compared to the one in the individual fit.
19 [pb] W t t σ 0.2 0.4 0.6 0.8 1 1.2 [pb] Ztt σ 0.6 0.8 1 1.2 1.4 1.6CMS (13 TeV) -1 35.9 fb ttV best fit 68% CL contour 95% CL contour V theory [1] t t [pb] W t t σ 0.2 0.4 0.6 0.8 1 1.2 lnL ∆ -2 0 1 2 3 4 5 6 7 8 ttW theory 68% 95% [pb] Z t t σ 0.6 0.8 1 1.2 1.4 1.6 lnL ∆ -2 0 1 2 3 4 5 6 7 8 ttZ theory 68% 95%
Figure 12: Result of the simultaneous fit for ttW and ttZ cross sections (denoted as star), along with its 68 and 95% CL contours are shown on the left panel. The right panel presents the individual measured cross sections along with the 68 and 95% CL intervals and the theory prediction [1] with their respective uncertainties for ttW and ttZ.
8
Effective field theory interpretation
Within the framework of effective field theory, cross section measurements can be used to search for NP in a model-independent way at energy scales that are not yet experimentally accessible. Using this approach, the SM Lagrangian is extended with higher-order operators that correspond to combinations of SM fields. The extended Lagrangian is a series expansion in the inverse of the energy scale of the NP, 1/Λ [51], hence operators are suppressed as long
asΛ is large compared with the experimentally-accessible energy.
The effective Lagrangian is (ignoring the single dimension-five operator, which violates lepton number conservation [51]) Leff = LSM+ 1 Λ2
∑
i ciOi+ · · · , (1)whereLSMis the dimension-four SM Lagrangian, Oi are dimension-six operators, and the
el-lipsis symbol represents higher-dimension operators. The dimensionless Wilson coefficients ci
parameterize the strength of the NP interaction.
Assuming baryon and lepton number conservation, there are fifty-nine independent dimension-six operators [52]. Thirty-nine of these operators were chosen for study in Ref. [53] because they include at least one Higgs field; the four-fermion operators were omitted. Constraints on the Wilson coefficients of some dimension-six operators have been reported in Refs. [2, 6, 54–60]. To investigate the effects of NP on any given process, it is necessary to calculate the expected cross section as a function of the Wilson coefficients. The matrix element can be written as the sum of SM and NP components:
M = M0+
∑
i
ciMi. (2)
t g ¯ t g t Z t W− b q0 ¯ q ¯t W− t t g ¯ t g t H t
Figure 13: Feynman diagrams representing some of the most significant NP contributions to the ttZ, ttW, and ttH processes.
of the matrix element, and has the following structure [57]: σSM+NP(ci)∝|M|2
∝ s0+s1ici+s2ic2i.
(3)
The coupling structures s0, s1i, and s2i are constants which can be determined by evaluating
the cross section for at least three values of ci. Note that while σ(ci)is always quadratic, the
minimum is not constrained to appear at the SM value (ci = 0), and in cases of destructive
interference with the SM, it is possible to have σSM+NP(ci) <σSM.
NP effects on ttW and ttZ are considered. Because ttH is sizeable background to ttW, and the NP effects on ttH are considered as well, as they cannot be disentangled from NP effects on ttW. The range of Wilson coefficient values to study is chosen such that |ci| < (4π)2 [61]. The dimension-six operators are encoded using the the FeynRules [62] implementation from Ref. [53], and we follow their notation and operator-naming scheme throughout this work. This implementation assumes flavor-independent fermion couplings. Because the W and Z boson couplings to light quarks are highly constrained by other measurements, i.e. inclusive W or Z cross section measurements, we removed all NP couplings to the first two generations. This
modified implementation is used in MADGRAPH5 aMC@NLO[63] to evaluate the cross section
σSM+NP expected due to both SM and NP effects at LO, with no constraints on the number of allowed QCD or electroweak vertices, for 30 values of ci, with all other couplings set to their SM values. We then fit those points with a quadratic function (see Eq. (3)) to determine σSM+NP(ci). The signal strength rttZ(ci)is defined as the ratio of σSM+NP, ttZ(ci)to σSM+NP, ttZ(0), and similarly for ttW and ttH. We use this to construct a profile likelihood test statistic q(ci). The likelihood statistic is maximized to find the asymptotic best fit ci, similarly to the procedure described in Section 7. Each coupling is profiled with the other couplings set to their SM values.
Of the thirty-nine operators in Ref. [53], we choose not to consider operators that do not affect ttW, ttZ, or ttH. The expected 95% CL interval is calculated for the remaining 24 operators. We also exclude from consideration operators that produce large effects in better-measured processes for Wilson coefficient values to which our measurement is sensitive. To accomplish this, we require that the cross section for each of tt, WW, ZZ, WZ, and inclusive Higgs boson production is not modified by more than 70% within our expected 95% CL interval. Finally, we do not include any operators that produce a significant effect on background yields (as described in Section 5) other than ttH, as these can be studied more effectively in other signal regions.
21
Table 7: Expected 68% and 95% CL intervals for selected Wilson coefficients.
Wilson coefficient 68% CL[TeV−2] 95% CL[TeV−2]
¯cuW/Λ2 [−1.6, 1.5] [−2.2, 2.2] |¯cH/Λ2−16.8 TeV−2| [3.7, 23.4] [0, 28.7] e c3G/Λ2 [−0.5, 0.5] [−0.7, 0.7] ¯c3G/Λ2 [−0.3, 0.7] [−0.5, 0.9] ¯cuG/Λ2 [−0.9,−0.8]and[−0.3, 0.2] [−1.1, 0.3] |¯cuB/Λ2| [0, 1.5] [0, 2.1] ¯cHu/Λ2 [−9.2,−6.5]and[−1.6, 1.1] [−10.1, 2.0] ¯c2G/Λ2 [−0.7, 0.4] [−0.9, 0.6]
Eight operators satisfy the above requirements, and constraints on their Wilson coefficients, ¯cuW, ¯cH, ec3G, ¯c3G, ¯cuG, ¯cuB, ¯cHu, and ¯c2G are reported here. Feynman diagrams representing some of the most significant NP contributions to the ttZ, ttW, and ttH processes are shown in Fig. 13.
The expected CL intervals for the selected Wilson coefficients are summarized in Table 7. Ob-served best fit values and CL intervals are summarized in Table 8. For three representative operators, the calculated signal strengths rttZ(ci), rttW(ci), and rttH(ci) are shown in the left panels of Fig. 14. The profile likelihood scan is presented in the center panels. In the right
panels, results are shown in the σttZversus σttWplane. The 68% and 95% contours are obtained
by sampling randomly from the fitted covariance matrix and extracting the contours which enclose 68.27% and 95.45% of the samples. We remove any assumptions about the energy scale of the NP made in Ref. [53] and report the ratio ci/Λ2. In cases where σSM+NP(ci)has the same minimum for all three processes, the profile likelihood is symmetric around this point, and we present results for|ci−ci,min|to make this symmetry explicit.
Table 8: Observed best fit values for selected Wilson coefficients determined from this ttW and ttZ measurement, along with corresponding 68% and 95% CL intervals. In some cases the profile likelihood shows another local minimum that cannot be excluded; the number reported here is the global minimum.
Wilson coefficient Best fit [TeV−2] 68% CL [TeV−2] 95% CL [TeV−2]
¯cuW/Λ2 1.7 [−2.4, −0.5] and [0.4, 2.4] [−2.9, 2.9] | ¯cH/Λ2− 16.8 TeV−2| 15.6 [0, 23.0] [0, 28.5] |ec3G/Λ2| 0.5 [0, 0.7] [0, 0.9] ¯c3G/Λ2 −0.4 [−0.6, 0.1] and [0.4, 0.7] [−0.7, 1.0] ¯cuG/Λ2 0.2 [0, 0.3] [−1.0, −0.9] and [−0.3, 0.4] | ¯cuB/Λ2| 1.6 [0, 2.2] [0, 2.7] ¯cHu/Λ2 −9.3 [−10.3, −8.0] and [0, 2.1] [−11.1, −6.5] and [−1.6, 3.0] ¯c2G/Λ2 0.4 [−0.9, −0.3] and [−0.1, 0.6] [−1.1, 0.8]
9
Summary
A measurement of top quark pair production in association with a W or a Z boson using proton-proton collisions at 13 TeV is presented. The analysis is performed in the same-sign dilepton final state for ttW, and the three- and four-lepton final states for ttZ, and these three final states are used to extract the cross sections for ttW and ttZ production. For both processes the ob-served signal significance exceeds 5 standard deviations. The measured signal strength param-eters are 1.23+−0.190.18(stat)+−0.200.18(syst)+−0.130.12(theo) and 1.17 +−0.110.10(stat)+−0.140.12(syst)+−0.110.12(theo) for ttW and ttZ, respectively. The measured cross sections are σ(ttW) = 0.77+−0.120.11(stat)+−0.130.12(syst) pb
-3.0 -2.0 -1.0 0.0 1.0 2.0 3.0
c
uB/
2 0.0 0.5 1.0 1.5 2.0 2.5 3.0 NP + SM/
SM CMS Simulation MG5_aMC@NLO LO ttW ttZ ttH 0.0 1.0 2.0 3.0|c
uB/
2| [TeV
2]
0 2 4 6 8 10 122
ln
L
CMS Best fit35.9 fb1 (13 TeV)68% CL 95% CL 0.0 0.2 0.4 0.6 0.8 1.0 1.2 ttW
[pb]
0.8 1.0 1.2 1.4 1.6 1.8 2.0 2.2 ttZ[p
b]
CMS ttV theory [1]35.9 fb1 (13 TeV) 2D best fit 68% CL 95% CL Best fit |cuB/ 2| -1.0 -0.5 0.0 0.5c
uG/
2 0.0 0.5 1.0 1.5 2.0 2.5 3.0 NP + SM/
SM CMS Simulation MG5_aMC@NLO LO ttW ttZ ttH -1.0 -0.5 0.0 0.5c
uG/
2[TeV
2]
0 2 4 6 8 10 122
ln
L
CMS 35.9 fb1 (13 TeV) Best fit 68% CL 95% CL 0.0 0.2 0.4 0.6 0.8 1.0 1.2 ttW[pb]
0.8 1.0 1.2 1.4 1.6 1.8 2.0 2.2 ttZ[p
b]
CMS ttV theory [1]35.9 fb1 (13 TeV) 2D best fit 68% CL 95% CL Best fit cuG/ 2 -2.0 0.0 2.0c
uW/
2 0.0 0.5 1.0 1.5 2.0 2.5 3.0 NP + SM/
SM CMS Simulation MG5_aMC@NLO LO ttW ttZ ttH -2.0 0.0 2.0c
uW/
2[TeV
2]
0 2 4 6 8 10 122
ln
L
CMS 35.9 fb1 (13 TeV) Best fit 68% CL 95% CL 0.0 0.2 0.4 0.6 0.8 1.0 1.2 ttW[pb]
0.8 1.0 1.2 1.4 1.6 1.8 2.0 2.2 ttZ[p
b]
CMS ttV theory [1]35.9 fb1 (13 TeV) 2D best fit 68% CL 95% CL Best fit cuW/ 2Figure 14: Left: signal strength as a function of selected Wilson coefficients for ttW (crosses), ttZ (pluses), and ttH (circles). Center: the 1D test statistic q(ci)scan as a function of ci, profiling all other nuisance parameters. The global best fit value is indicated by a dotted line. Dashed and dash-dotted lines indicate 68% and 95% CL intervals, respectively. Right: The ttZ and ttW
cross section corresponding to the global best fit ci value is shown as a cross, along with the
corresponding 68% (dashed) and 95% (dash-dotted) contours. The two-dimensional best fit to the ttW and ttZ cross sections is given by the star. The theory predictions [1] for ttW and ttZ are shown as a dot with bars representing their respective uncertainties.
23
and σ(ttZ) = 0.99+−0.090.08(stat)+−0.120.10(syst) pb, in agreement with the standard model predictions. These results have been used to set constraints on the Wilson coefficients of dimension-six operators. Eight operators have been identified which are of particular interest because they change the expected cross sections of ttZ, ttW, or ttH without significantly impacting expected
background yields. Both ttZ and ttH are affected by O3G, O
f
3G, O2G, andOuB. Only ttZ is
af-fected byOHu, whileOHaffects only ttH. All three processes ttZ, ttW, and ttH are affected by
OuGandOuW. In cases where new physics beyond the standard model modifies the expected
ttZ cross section, the sensitivity is mainly determined by ttZ and the fit is able to match the observed excess in data. No operators were identified which provide an independent handle on ttW. The constraints presented, obtained by considering one operator at a time, are a useful first step toward more global approaches.
Acknowledgments
We congratulate our colleagues in the CERN accelerator departments for the excellent perfor-mance of the LHC and thank the technical and administrative staffs at CERN and at other CMS institutes for their contributions to the success of the CMS effort. In addition, we grate-fully acknowledge the computing centers and personnel of the Worldwide LHC Computing Grid for delivering so effectively the computing infrastructure essential to our analyses. Fi-nally, we acknowledge the enduring support for the construction and operation of the LHC and the CMS detector provided by the following funding agencies: BMWFW and FWF (Aus-tria); FNRS and FWO (Belgium); CNPq, CAPES, FAPERJ, and FAPESP (Brazil); MES (Bulgaria); CERN; CAS, MoST, and NSFC (China); COLCIENCIAS (Colombia); MSES and CSF (Croatia); RPF (Cyprus); SENESCYT (Ecuador); MoER, ERC IUT, and ERDF (Estonia); Academy of Fin-land, MEC, and HIP (Finland); CEA and CNRS/IN2P3 (France); BMBF, DFG, and HGF (Ger-many); GSRT (Greece); OTKA and NIH (Hungary); DAE and DST (India); IPM (Iran); SFI (Ireland); INFN (Italy); MSIP and NRF (Republic of Korea); LAS (Lithuania); MOE and UM (Malaysia); BUAP, CINVESTAV, CONACYT, LNS, SEP, and UASLP-FAI (Mexico); MBIE (New Zealand); PAEC (Pakistan); MSHE and NSC (Poland); FCT (Portugal); JINR (Dubna); MON, RosAtom, RAS, RFBR and RAEP (Russia); MESTD (Serbia); SEIDI, CPAN, PCTI and FEDER (Spain); Swiss Funding Agencies (Switzerland); MST (Taipei); ThEPCenter, IPST, STAR, and NSTDA (Thailand); TUBITAK and TAEK (Turkey); NASU and SFFR (Ukraine); STFC (United Kingdom); DOE and NSF (USA).
Individuals have received support from the Marie-Curie program and the European Research Council and Horizon 2020 Grant, contract No. 675440 (European Union); the Leventis Foun-dation; the A. P. Sloan FounFoun-dation; the Alexander von Humboldt FounFoun-dation; the Belgian Fed-eral Science Policy Office; the Fonds pour la Formation `a la Recherche dans l’Industrie et dans l’Agriculture (FRIA-Belgium); the Agentschap voor Innovatie door Wetenschap en Technologie (IWT-Belgium); the Ministry of Education, Youth and Sports (MEYS) of the Czech Republic; the Council of Science and Industrial Research, India; the HOMING PLUS program of the Foun-dation for Polish Science, cofinanced from European Union, Regional Development Fund, the Mobility Plus program of the Ministry of Science and Higher Education, the National Science Center (Poland), contracts Harmonia 2014/14/M/ST2/00428, Opus 2014/13/B/ST2/02543, 2014/15/B/ST2/03998, and 2015/19/B/ST2/02861, Sonata-bis 2012/07/E/ST2/01406; the National Priorities Research Program by Qatar National Research Fund; the Programa Severo Ochoa del Principado de Asturias; the Thalis and Aristeia programs cofinanced by EU-ESF and the Greek NSRF; the Rachadapisek Sompot Fund for Postdoctoral Fellowship, Chulalongkorn University and the Chulalongkorn Academic into Its 2nd Century Project Advancement Project (Thailand); the Welch Foundation, contract C-1845; and the Weston Havens Foundation (USA).