The Role of Sales
Promotions on Consumer
Purchase Intention:
The mediation effect of perceived risk
Carolina Sofia Gonçalves Martins
152116121
Dissertation written under the supervision of
Prof. Paulo Romeiro
Dissertation submitted in partial fulfilment of requirements for the International
MSc in Management with Major in Marketing at the Universidade Católica
Portuguesa, June 2018.
ABSTRACT
Title: “The Role of Sales Promotions on Consumer Purchase Intention: The mediation effect of perceived risk.”
Author: Carolina Sofia Gonçalves Martins
Sales promotions are one of the key elements of the companies’ marketing budget due to their positive impact on consumer choice and behavior, inducing their purchase intention. In Portugal, this phenomenon has been gaining extremely relevance for all retailers and has a huge penetration in all markets. This tool has become a strong habit for consumers who buy almost half of the products on promotions.
The purpose of this study is to explore the relationship between sales promotions and consumer purchase intention and the potential mediating effect of perceived risk. More precisely, the study investigates the effect of two sales promotions elements’, the type of promotions (Monetary & Non-monetary promotions) and level of discount (High & Low level). Additionally, the perceived risk will be also expressed through financial perceived risk and performance perceived risk.
An online survey was conducted for Portuguese population reaching 414 valid responses. The key findings of the study are that sales promotions don’t predict well perceived risk not having a significant influence on this variable, then sales promotions have a positive influence on purchase intention while perceived risk has a negative, however, both variables are not the best drivers of purchase intention. Lastly perceived risk is not a good mediator for this relationship. This study will be helpful for managers to gain insights in a way to increase the effectiveness of sales promotions and thus, generate a higher consumer purchase intention.
SUMÁRIO
Título: “O papel das promoções na intenção de compra dos consumidores: O efeito mediador do risco percecionado”
Autora: Carolina Sofia Gonçalves Martins
As promoções são um dos principais elementos do orçamento de marketing das empresas devido ao seu impacto positivo na escolha e no comportamento dos consumidores, induzindo à sua intenção de compra. Em Portugal, este fenómeno tem vindo a ganhar extrema relevância para todos os retailers tendo uma enorme penetração em todos os mercados. Este instrumento tem se tornado um hábito para os consumidores que já compram quase metade dos produtos em promoção.
O objetivo deste estudo é explorar a relação entre as promoções e a intenção de compra dos consumidores e o potencial efeito de mediação do risco percecionado da compra. Mais precisamente, o estudo investiga o efeito de dois elementos das promoções, o tipo de promoção (Promoção monetárias & não-monetárias) e o nível de desconto (Desconto elevado & baixo). Adicionalmente, o risco percecionado será expressado através do risco financeiro e de performance.
Um questionário online foi realizado na população portuguesa obtendo 414 respostas válidas. As principais conclusões do estudo são que as promoções não preveem bem o risco percecionado, não tendo uma influência significativa nesta variável, seguidamente as promoções têm uma influência positiva na intenção de compra enquanto que o risco percecionado tem negativa, contudo ambas as variáveis não são os principais influenciadores da intenção de compra. Finalmente, o risco percecionado não é um bom mediador para esta relação. Este estudo será útil para os gestores ganharem insights no sentido de aumentar a eficácia das promoções e assim, gerar uma intenção de compra superior.
ACKNOWLEDGEMENTS
Firstly, I would like to express my sincere gratitude to my biggest support, my parents, who always believed in me, they were presented in every moment of my life wishing always the best for me. Their love, their belief, their advice were crucial during my academic life. Thank you is not enough for all they have done for me.
Secondly, I would like to thank Tiago for all the love and support throughout this period, for the patience and understanding and for all the moments. He was the best, my perfect half, one of my biggest motivations and my great support.
Thirdly, I would like to thank my supervisor, Paulo Romeiro, for all the helpful and important advice. For his availability, interest, and support which have become essential throughout this process.
Lastly, I would like to give special thanks to Professor Fernando Machado and Professor Isabel Moreira for their help and availability during the thesis. They were super accessible and helpful to clarify my doubts regarding the data analysis procedure and SPSS output.
TABLE OF CONTENTS
ABSTRACT ... II SUMÁRIO ... III ACKNOWLEDGEMENTS ... IV TABLE OF CONTENTS ... V TABLE OF FIGURES ... VII TABLE OF APPENDICES ... VIII GLOSSARY ... IX CHAPTER 1: INTRODUCTION ... 1 1.1 BACKGROUND ... 1 1.2 PROBLEM STATEMENT ... 2 1.3 RELEVANCE ... 2 1.4 RESEARCH METHODS ... 3 1.5 DISSERTATION OUTLINE ... 4
CHAPTER 2: LITERATURE REVIEW AND CONCEPTUAL FRAMEWORK ... 5
2.1 PURCHASE INTENTION ... 5
2.2 SALES PROMOTIONS ... 5
2.3 PERCEIVED RISK ... 8
2.4 SALES PROMOTIONS AND PERCEIVED RISK ... 10
2.5 PERCEIVED RISK AND PURCHASE INTENTION ... 11
2.6 CONCEPTUAL FRAMEWORK ... 12 CHAPTER 3: METHODOLOGY ... 13 3.1 RESEARCH APPROACH ... 13 3.2 SECONDARY DATA ... 13 3.3 PRIMARY DATA ... 14 3.3.1 ONLINE SURVEY ... 14 3.3.1.1 DATA COLLECTION ... 14 3.3.1.2 RESEARCH DESIGN ... 15 3.3.1.3 MEASUREMENT ... 16 3.3.1.4 DATA ANALYSIS ... 18
CHAPTER 4: RESULTS AND DISCUSSION ... 20
4.1 SAMPLE CHARACTERIZATION... 20
4.2 MEASURE RELIABILITY ... 21
4.3 RESULTS FROM THE HYPOTHESIS TEST ... 22
4.3.1 HYPOTHESIS 1 ... 22
4.3.2 HYPOTHESIS 2 ... 26
4.3.3 HYPOTHESIS 3 ... 30
4.3.4 HYPOTHESIS 4- THE MEDIATION EFFECT – MACRO PROCESS HAYES ... 33
5.1 MAIN FINDINGS & CONCLUSIONS ... 36 5.2 MANAGERIAL / ACADEMIC IMPLICATIONS ... 39 5.3 LIMITATIONS AND FURTHER RESEARCH ... 39 REFERENCE LIST ... I APPENDICES ... VII APPENDIX 1: SURVEY (PORTUGUESE VERSION) ... VII APPENDIX 2: SURVEY (ENGLISH VERSION) ... XI APPENDIX 3: DESCRIPTIVE STATISTICS AND FREQUENCIES ... XVI APPENDIX 4: CRONBACH ALPHA ... XVII APPENDIX 5: SPPS RESULTS FROM THE HYPOTHESIS ... XXI
TABLE OF FIGURES
Figure 1: Conceptual Framework……….12
Figure 2: Survey Design……….………..18
Figure 3: Measurement Model………...…..18
Figure 4: Statistical Diagram………....19
Figure 5: Promotion Stimuli Output………...21
Figure 6: Cronbach Alpha Results………22
Figure 7: H1a Results………23
Figure 8: H1b Results………...24
Figure 9: H1c Results………25
Figure 10: H2a Results……….26
Figure 11: H2b Results……….28
Figure 12: H2c Results……….30
Figure 13: H3a Results……….31
Figure 14: H3b Results……….33
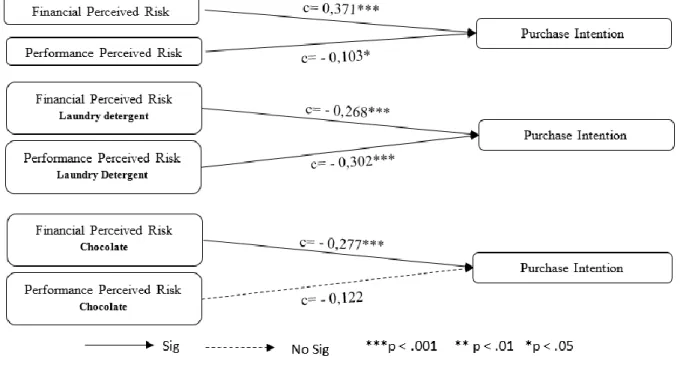
Figure 15: Statistical Diagram with coefficients- Total Sample………35
Figure 16: Statistical Diagram with coefficients- Laundry Detergent………..35
TABLE OF APPENDICES
Appendix 1- Survey (Portuguese Version)………VII Appendix 2- Survey (English Version)………..XI Appendix 3- Descriptive Statistics and Frequencies………..XVI Appendix 4- Cronbach Alpha Outputs………...XVII Appendix 5-SPSS Results from hypothesis………....XXI
5.1 Hypothesis 1a- The impact of sales promotions on consumer purchase intention………...XXI 5.2 Hypothesis 1b- The effect of types of promotions on purchase intention………XXIII 5.3 Hypothesis 1c- The effect of level of discounts on purchase intention………XXIV 5.4 Hypothesis 2a-The impact of sales promotions on perceived risk………..XXVI 5.5 Hypothesis 2b- The effect of types of promotions on financial and performance perceived risk...XXVII 5.6 Hypothesis 2c- The effect of level of discounts on financial and performance perceived risk…...XXIX 5.7 Hypothesis 3a- The impact of perceived risk on purchase intention ………...XXXI 5.8 Hypothesis 3b- The impact of financial and performance perceived risk on purchase intention....XXXIII 5.9 Hypothesis 4 – Mediation effect……….XXXVI
GLOSSARY NP- No promotion
MH- Monetary Promotion & High Level of Discount ML- Monetary Promotion & Low Level of Discount
NMH- Non-Monetary Promotion & High Level of Discount NML- Non-Monetary Promotion & Low Level of Discount PI- Purchase Intention
F-Financial P-Performance
CI- Confidence Interval LD- Laundry Detergent C-Chocolate NL- No Level HL- High Level LL- Low Level SP- Sales Promotions PR- Perceived Risk
CHAPTER 1: INTRODUCTION 1.1 Background
Over the last years, branding and brand management have emerged as a key aspect for organizations. The recognition that brand is the most valuable intangible asset of the company has been the main cause that triggered this growing interest (Keller & Lehmann, 2006) and sales promotions as a marketing communication tool have been used as a brand- building activities (Palazón-Vidal & Delgado-Ballester, 2005).
Sales promotions have been achieving such relevance in marketing techniques due to their ability to impact consumer purchase intention and brand choice (Davis, Inman, & McAslister, 1992; Lattin & Bucklin, 1989). Indeed, sales promotions have several short-term benefits such as improve the short-term profits (Wong Ai Jean, Yazdanifard, Ai Jean α, & Yazdanifard σ, 2015) or generate quicker and immediate sales response of the promoted brand (Gupta, 1988), becoming the perfect tool to compete in the market (Chandon, Wansink, & Laurent, 2000) because of its powerful effect on the point of sales (Davis et al., 1992). In fact, according to Davis, Inman & McAslister (1992), when a product is promoted, the probability of the consumer purchases it increases 40%.
Moreover, there was a need to conceptualize sales promotions in monetary promotions and non-monetary promotions because each type of promotion displays a specific benefit to the consumers (Chandon, Wansink, & Laurent 2000; Diamond and Johnson 1990). Regarding their impact on consumer purchase intention, there is no clear consensus on which type have the largest impact. Several researchers assumed that monetary promotions have the strongest due to their financial benefits (Huff et al., 2008; Kwok & Uncles, 2005; Luk & Yip, 2008), however other researchers propose the opposite (Lowe, 2010; Lowe & Barnes, 2012; Yoo, 2011). For the level of discount, there is unanimity among the researches that higher level of discount leads to higher purchase intention.
Perceived risk is another variable that may influence purchase intention. It is important to analyse its effect and find risk-reduction strategies to make the purchase decision more effective.
In terms of risk-reduction strategies, sales promotions are one of the strategies that companies can adopt (Cox & Rich, 1964.; Ho & Ng, 1994). Those strategies will have a positive effect on consumer purchase intention (M.Aghekyan-Simonian et al. 2012; Garretson & Clow 1999; Samadi & Yaghoob-Nejadi 2009; Park et al. 2005).
The perceived risk concept was extensively studied in the past having a wide range of definitions. The most used stated that perceived risk comprises two dimensions, uncertainty and consequences (Cox & Rich, 1964; Dowling & Staelin, 1994; Forsythe & Shi, 2003; Kim, Ferrin, & Rao, 2008; Taylor, 1960).
1.2 Problem Statement
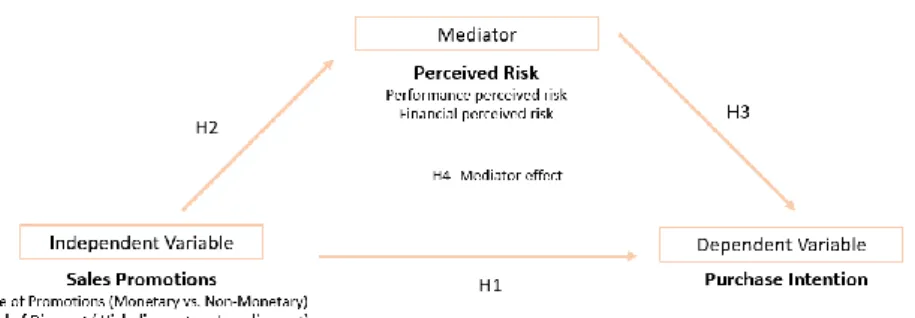
The purpose of this dissertation is to explore the relationship between sales promotions - the type of promotions (monetary and non-monetary promotions) and the level of discount (high discounts vs. low discounts) - and consumer’s purchase intention, mediating by perceived risk that is represented by performance perceived risk and financial perceived risk. Thus, the problem statement was established as:
“The Role of Sales Promotions on Consumer Purchase Intention: The mediation effect of perceived risk.”
This problem statement is highlighted by the following research questions: RQ1: What is the impact of the sales promotions on purchase intention?
RQ2: What is the effect of different sales promotions elements on purchase intention? RQ3: What is the relationship between sales promotions and perceived risk?
RQ4: What is the impact of perceived risk in purchase intention? 1.3 Relevance
Sales promotions is a subject that has gained importance for brand managers (Simonson, Carmon, & Curry, 1994) who have been spent a tremendous amount of money on those marketing instruments (Mela et al. 1997) and those expenditures have extremely importance for consumer-packaged goods manufacturers (Valette-Florence, Guizani, & Merunka, 2011). According to Promotion Marketing Association (2003), the sales promotions expenditures exceeded $200 billion in 2002 (Delvecchio, 2005.)
This growing investment on sales promotions is due to their influence at consumer’s purchase choice (Davis et al., 1992; Inman & McAlister, 1993) and behaviour (Ar & Leone, 1988; Alvarez and Casielles 2005; Lattin & Bucklin 1989). Therefore, it is fundamental to have a deep knowledge about sales promotions and the related variables that may affect the purchase intention with the aim to maximize the sales of the product in the point of sale.
For the consumer shopping experience, promotions are no more unusual situations. The consumers are constantly bombarded with promotions, which created a powerful addition to this type of marketing tool. Concretely, in Portugal, 45% of the products are selling on promotions, according to Nielsen report 2017.
Regarding perceived risk, this variable has also a strong impact on purchase intention, since risk is presented in all types of choices and throughout the product’ decision making process. Thus, understand this relationship is crucial to interpreting the consumer choices (Bettman, 1973) and comprehend the impact of such promotional incentives in the consumer perceived risk.
Academically, this study will be relevant in several different aspects. Although many researchers have been confirmed that sales promotions have a significant impact on consumer’s purchase intention, the studies are scarce about the effect of different types of promotions and levels of discounts. Secondly, just a few studies focused on the effect that sales promotions and its elements have on perceived risk, mainly performance and financial risk. Further, within the type of promotions, the monetary promotions were the only been examined. Lastly, there is no study that considers the mediator effect of perceived risk in the relationship between sales promotions and purchase intention.
From the managerial perspective, this research will provide fundamental insights to retailers allowing them to understand which type of promotion is adequate and more efficient to induce a consumer’s immediate sales response and to learn which level of discount is more relevant to encourage purchase intention. Additionally, with this study, managers will become aware and take in consideration perceived risk in this relationship recognizing the influence of such dimension on purchase intention.
1.4 Research methods
To answer properly the proposed research questions, both primary and secondary data were used throughout this study.
Firstly, to design a detailed literature review and to acquire a deep background knowledge about the variables, an extensive search was done among the existing literature about perceived risk, sales promotions, its type and level of discount, and consumer’s purchase intention. This search was completed essentially through academic papers from marketing, consumer behavior and retailing journals.
Regarding the primary data, an online survey was conducted to quantitatively determine the possible relationships among those variables. All the results were analyzed through SPSS. The most relevant statistical tests used were the Hayes Process macro in SPSS to analyze the possible mediator effect of perceived risk in the relationship between sales promotions and purchase intention, ANOVA tests and linear regression.
1.5 Dissertation outline
This dissertation is organised as follows. The next section presents the literature review and the development of the hypotheses. The literature review introduces a theoretical background about the sales promotions, perceived risk and purchase intention. Then, the third section explains the methodology, starting with the data collection and finalized with data analysis. The fourth section displays the results and analysis of the study. Finally, the last section addresses the main conclusions and outlining some managerial/academical implications and limitations of this research.
CHAPTER 2: LITERATURE REVIEW AND CONCEPTUAL FRAMEWORK
This chapter presents an extensive theoretical review of the concepts of perceived risk, sales promotions -types of promotions and level of discount-, purchase intention and the interactions between those variables. Based on this background literature, the research hypotheses were defining and developing.
2.1 Purchase Intention
Purchase Intention is an important concept in marketing and management (Morrison, 1979) in the way that purchase intention will directly affect the purchase behavior and consequently the perceived price, quality and value (Chang & Wildt, 1994).
Hence, it is important to clarify the concept and understand that intention to purchase something is based on attitudes which can be related to the brand itself or other alternative brands (Laroche & Kim, 1996).
According to Spears, Spears, & Singh (2004), purchase intention is “an individual’s conscious plan to make an effort to purchase a brand”. Thus, this concept is related to the individual, either their action and motivations, about one brand or their propensity to fulfil an action which make it a future pretend response (Brien, 1971) where confidence is a relevant element (Laroche & Kim, 1996).
2.2 Sales Promotions
There has been an escalation of promotions expenditures on companies marketing budget (Alvarez and Casielles 2005; Netemeyer 1997). This situation is due to several aspects, such as the growing competition in the market, the short-term pressures involved, the mature state of the markets (Huff et al., 2008) and the purpose to make the product more appealing and valuable (Alvarez and Casielles, 2005). Within promotions, sales promotions have been acquired a considerable relevance due to their effective importance at the point of choice (Alvarez and Casielles, 2005; Kumar & Leone 1988; Davis, Inman & McAslister 1992).
According to Alvarez and Casielles (2005) sales promotions might be defined as “a set of stimuli that are offered sporadically, and it reinforces publicity actions to promote the purchasing of a certain product”. For Kotler (1988), sales promotions are “a diverse collection of incentive tool, mostly short-term, designed to stimulate quicker and greater purchase of particular products/services by consumer”(Wong Ai Jean et al., 2015).
Hence, there are large benefits associated with its usage in a short- term period, such as the direct impact on the promoted product increasing its current sales (Ar & Leone, 1988; Inman & McAlister, 1993), accelerate purchase decisions (Nijs, Dekimpe, Steenkamp, Hanssens, & Hanssens, 2001), brand switching (Alvarez and Casielles, 2005), stockpiling ( Gupta 1988) , increase the trial (Grewal, Krishnan, Baker, & Borin 1998; Alvarez and Casielles 2005) , increase the store traffic (Grewal et al., 1998), attract new customers (Luk and Yip, 2008 ; Alvarez and Casielles, 2005) and increase the category purchase (Ailawadi & Neslin, 1998; Cotton & Babb, 1978; Spring, Neslin, Henderson, & Quelch, 2018). Therefore, sales promotions is one of the most powerful tools to differentiated from the competition (Huff et al., 2008; Lee & Lee, 2006). However, few researchers stated that sales promotions may not have such positive effect on the promoted brand. According to Simonson et al. (1994), there is an avoidance of promoted products when the consumers don’t perceive the promotion as added value which is more common when consumers are not sure about which brand should choose. This dissertation will be analysed the most consistent and consensual approach among the researchers. Hence, the hypothesis is predicted:
H1a: Sales promotions positively affect the consumer purchase intention.
Some researchers stressed the need to separate sales promotions in two different categories, monetary promotions and non-monetary promotions due to some differences on attitudes towards the type of promotions used (Campbell and Diamond 1990; Wheat & Angeles, 1995) and differences in benefits that each type of promotions may provide to consumers (Chandon et al., 2000; Luk & Yip, 2008). Some researchers also entitle those types as price-oriented promotions and non-price promotions, respectively (Huff et al., 2008; Lee & Lee, 2006). Besides, few researchers considered this division favorable and profitable for the managers whereas they will be informed of which type of promotion should they used to communicate each product and how they could induce efficiently sales response (Campbell and Diamond, 1990).
Monetary promotions, such as price discounts, coupons, cents-off deals, and rebates, are perceived as a reduced loss and it is merely associated with behavior goals (Campbell and Diamond, 1990). This type of promotions is regularly used to achieve short-term goals (Huff et al., 2008; Lee & Lee, 2006). Contrary, non-monetary promotions, such as premiums, sweepstakes, contests, premiums and free gifts, are viewed as a gain and they are mostly associated with affective, emotional and behavior goals. They are greater associated with
long-term results such as enhancing brand equity (Huff et al., 2008; Lee & Lee, 2006). Despite this distinction, both types of promotions have a relevant impact on purchase decision (Chandon et al., 2000; Wong Ai Jean et al., 2015).
Most of the managers have been adopted monetary promotions due to its easiness to reach short-term goals (Lee & Lee, 2006). Further, consumers recognize easily the monetary promotions which are considering the most evident promotions (Campbell and Diamond, 1990). Nevertheless, a non-monetary promotion may add value to the product while monetary only reduce their cost (Campbell and Diamond, 1990). Still, according to the Kahneman and Tversky (1979) prospect theory, consumers prioritize the avoidance of losses and getting monetary incentives than looking for gains (Huff et al. 1999). Contrary, few researchers suggested that consumers react better to non-monetary promotion than monetary promotions due to their tendency to seem as gains, thus they are likely to perceived non-monetary as more valuable than monetary promotion (Yi and Yoo, 2011). Despite Diamond (1992) concluded that this last premise may depend on the size of promotions. The importance of monetary promotions increases when the size is larger due to its effects on absolute values of the discount (Lowe,2010).
Nevertheless, for several researchers, monetary promotions are favored over non-monetary promotions on their ability to lead to purchase intention in all product categories (Huff et al., 2008; Kwok & Uncles, 2005; Luk & Yip, 2008). This dominance of monetary promotions may be explained by the immediate benefits, such as financial benefits (Luk and Yip, 2008), that may afford to the consumers (Kwok and Uncles, 2005).
Following this, the study suggests the following research hypotheses:
H1b: The type of promotion used has a different effect on purchase intention.
H1b1: Monetary promotions have a larger effect on purchase intention than non-monetary promotions.
Beyond the impact of types of promotions on consumer’s purchase intention, another dimension can influence the consumer purchase behavior and decision which is the level of discount (Gupta & Cooper, 1992). Some researchers suggested that the level of the discount is a crucial criterion when the consumers evaluate the promotions (DelVecchio, 2005).
According to Gupta and Cooper (1992), there is a relationship between the level of discount and consumer’s purchase intention. An increase in the level of discount leads to a rise in consumer’s perceptions of the discount and consequently this situation generates an increase on purchase intention. However, the level of discount should have a maximum and a minimum limit. The highest discount should not be too large because consumers can anticipate that the discount is not bona fide. Regarding the minimum discount, the managers should establish 15%, as the limit, to attract consumers to the promoted product. Based on the findings, it is proposed the following:
H1c: The level of discount affects differently purchase intention.
H1c1: A high level of discount have a larger effect on purchase intention comparing to low level of discount.
2.3 Perceived Risk
The concept of perceived risk was primarily introduced by Bauer (1960) in consumer behavior research (Dowling & Staelin, 1994; Mitchell, 1999; Taylor, 1960). He stated that “consumer behavior involves risk in the sense that any action of a consumer may lead to unpleasant consequences” (Ho & Ng, 1994). Taylor (1974) reinforced the idea of Bauer by proposed that the choice is at the basis of consumer behaviour and suggested that risk or uncertainty are inherent in any consumer purchase decision because the consumers will only observe the outcome in the future. Cox and Rich (1964) supported those ideas by suggesting that perceived risk is in all purchase decisions and suggested that this concept is closely related to buying goals because consumers purchase something to obtain a specific goal.
Thereby, from a consumer behavior perspective, perceived risk is a critical dimension which is extensible to all consumer products (Samadi & Yaghoob-Nejadi, 2009).
Many researchers have been defined differently the concept of perceived risk and such definitions may vary according to the context of the study (Conchar, Zinkhan, Peters, & Olavarrieta, 2004). According to Peter & Ryan (1976) and Dowling & Staelin (1994), there are two approaches to perceived risk. The first one involves uncertainty and consequences, based on Bauer conceptualization, and the second comprises the probability and importance of loss. For some researchers, perceived risk is examined as the consumer’s perceptions of uncertainty about the potential outcomes and adverse consequences about the purchase (Cox & Rich, 1964.; Dowling & Staelin, 1994; Forsythe & Shi, 2003; Kim et al., 2008). Taylor (1960) affirmed that
those two components are always involved in choice situations, their importance diverged merely due to the type of situation, thus he assumed that risk equals a possible loss.
On the other hand, few researchers defined perceived risk as the expectation of losses related to purchase’s decisions (Lowe, 2010; Peter & Ryan, 1976; Sweeney, Soutar, & Johnson, 1999). Further, Brachinger & Weber (1997) suggested that the amount of potential loss and the likehood of that losses are the two main determinants of perceived risk.
Another definition was adopted by Conchar et al. 2014, who defined perceived risk as “A consumer’s importance-weighted subjective assessment of the expected value of inherent risk in each of the possible choice alternatives for a given decision goal.”. The concept “inherent risk” was deeply developed by Bettman (1973). This author argued that perceived risk can be divided into two types of risk, inherent risk and handle risk. By his definition, inherent risk refers to “the latent risk a product class holds for a consumer” and handle risk is “the amount of conflict the product class is able to arouse when the buyer chooses a brand from a product class in his usual buying situation.”. Further, Dowling and Staelin (1994) suggested another definition of perceived risk. They considered that perceived risk has two components, cognitive and affective, and the overall perceived risk is separated in product-category risk (PCR), which is the intrinsic risk of a specified product category, and product-specific risk (SR), the risk of considering a product in the product class.
Even though there is no accordance about the perceived risk definition, there is a consensus about its multidimensional construct ( Stone & Gronhaug 1993;Chiu, Wang, Fang, & Huang 2014; Conchar et al. 2004; Peter & Ryan, 1976; Peter, Tarpey, Peter, & Tarpey, 1975).
Jacoby and Kaplan (1972) proposed five types of perceived risk, financial, performance, physical, psychological and social risk and all those dimensions are functionally independent. Roselius (1971) suggested an additional type such as convenience risk or time loss. (Conchar et al. 2004; Jacoby & Kaplan 1972). Further, Berkman, Lindquist, and Sirgy (1996) considered another dimension, linked decision risk (Conchar et al. 2004). The importance of each type of risk dimension will depend on the purchase/shopping decision (Simon & Victor 1994; Stone & Gronhaug 1993) and will vary according to the type of consumer and products (Cox & Rich 1964; Stone & Gronhaug 1993). Despite the significance of each risk dimension differs according to different purchase situation, all the dimensions together may capture perfectly the overall risk perceived (Stone &Gronhaug, 1993).
This dissertation will barely focus on two types of perceived risk, performance and financial risk. Financial perceived risk is associated with opportunity cost and time (Kim et al., 2008) and it is also described as a net financial loss (loss of money) to the customer (Chiu et al., 2012; Forsythe & Shi, 2003; Sweeney et al., 1999)including the opportunity of repair, replaced and refund the purchase (Sweeney et al. 1999). Performance perceived risk is defined as a loss when the product performs in an unexpected way. (Lowe 2010; Forsythe et al. 2003; Chiu et al. 2012; Sweeney et al. 1999).
2.4 Sales Promotions and Perceived Risk
Through the extensive studies and researches on perceived risk concept, marketers may recognize and implement strategies to reduce the perceived risk such as enhancing product quality which is the best action to reduce financial and performance risk (Mitra, Reiss, & Capella, 1999; Sweeney et al., 1999), increase brand loyal (Sweeney et al. 1999) and information acquisition and processing (Mitra et al. 1999). Thus, decreasing the uncertainty of the purchase (Dowling & Staelin, 1994) will enable consumers to take more effective the consumer behavior decisions (Samadi & Yaghoob-Nejadi,2009).
Few researchers emerged with the conclusion that sales promotions may be adequate tool to reduce perceived risk (Ho & Ng, 1994). According to Cox (1967), information acquisition as a strategy to diminish perceived risk includes promotions (Mitra et al., 1999). Therefore, it is proposed the following:
H2a: Sales promotions would decrease the perceived risk.
Regarding the type of promotions used and its impact on perceived risk, Garretson & Clow (1999) proposed that monetary promotions such as coupons may have a significant impact on consumer decision that allows reducing the perceived risk of the purchase. Further, this study concluded that monetary promotions may reduce the financial perceived risk because the financial loss will be lower. The same effect will happen with performance risk. Thus:
H2b: Monetary promotions decrease financial and performance perceived risk.
Regarding the non-monetary promotions, there is no study or academic article that evaluates the impact of non-monetary promotions in financial perceived risk because with this type of promotions, there is no financial loss. Nevertheless, this dissertation will analyse if there is any effect. The relationship between performance risk and non-monetary promotions is briefly studied. According to Lowe (2010), non-monetary promotions are used when the products
purchased has low performance risk. However, there is no study that proves the direct impact of non-monetary promotions on performance risk. Hence, this study proposed the following hypothesis:
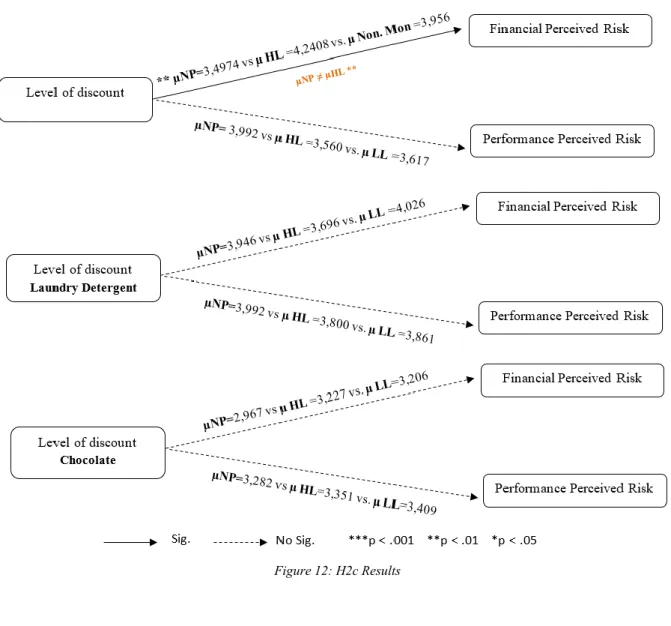
H2b1: Non-monetary promotions decrease financial and performance perceived risk. Moreover, the level of discount also has an impact on perceived risk, when the discounts are larger, the risk perceived by the consumers tend to decrease. The financial risk is the one that decreases the most in the way that when the discount increases, the financial loss of the purchase decreases. However, this positive effect is not similar for all types of risks (Garretson & Clow, 1999). Performance risk will increase when the level of discounts increases, this effect is due to the importance of quality on perceived performance risk. When the level of discount is higher, the quality perceived by consumers tends to decrease, becoming more sceptics about the product performance, thus the quality has the opposite effect on this type of risk. (Garretson & Clow, 1999). Hence, the study proposed the following hypotheses:
H2c: The level of discounts affects differently financial and performance perceived risk. H2c1: The level of discounts has an inverse impact on financial perceived risk.
H2c2: The level of discounts has a positive effect on performance perceived risk. 2.5 Perceived Risk and Purchase Intention
After Bauer’s conceptualization of risk (1960) that declared that risk is implicit in consumer behavior and the reaffirmation of Taylor (1960) that confirmed that in any consumer purchase decision, risk is permanent and consistent variable, extensive research has been published and has examined the effects of perceived risk on consumer decision making (Bettman, 1973; Aghekyan-Simonian, Forsythe, Suk Kwon, & Chattaraman, 2012; Cox & Rich, 1964.; Taylor, 1960) , mainly on consumer purchase intention (Wood & Scheer, 1996; Chiu et al., 2012). Many researches proposed that perceived risk has a significant impact on purchase intention (Wood and Scheer 1996; Chiu et al., 2012; Kim et al. 2008). Dowling and Staelin (1994) conclude that the risk is reflected by the consumer involvement with the purchase which has an impact on purchase decision.
Some researchers suggested that perceived risk reduce the consumer’s purchase intention, in the way that the higher the perceived risk by the consumer, the lower is the intention to buy the product (Aghekyan-Simonian et al., 2012; Garretson, Clow, & Garretson, 1999; Park, Lennon,
& Stoel, 2005.; Samadi & Yaghoob-Nejadi 2009). Moreover, Park et al. (2005) introduced the element confidence to explain this inverse relationship. According to their study, confidence is a relevant and positive element in purchase intention and conceptually it is the opposite of perceived risk. Thus, perceived risk has a reversed effect of confidence on purchase intention. Therefore, it leads to establishing the following hypothesis:
H3a: Perceived risk has an inverse impact on purchase intention.
Succeeding this effect on the overall perceived risk, performance and financial perceived risk have the similar impact on purchase intention. Thus, this hypothesis is proposed:
H3b: Performance risk and Financial risk affect negatively the purchase intention. The previous hypotheses suggest that perceived risk may be the mediator on the relationship between sales promotions and purchase intention. Hence, the empirical results should demonstrate this effect by the following hypothesis:
H4: Perceived risk mediates the relationship between sales promotions and purchase intention.
2.6 Conceptual Framework
CHAPTER 3: METHODOLOGY
This chapter presents the methodology used to analyse the research questions of this dissertation and collecting both primary and secondary data to reach some conclusions regarding the hypotheses displayed in the previous chapter. The structure of the chapter is the following: firstly, the research approach is displayed, then a summary about the primary and secondary research used through the thesis and lastly, a more exhausted approach about the primary research.
3.1 Research Approach
The main goal of this dissertation is to gain insights about the relationship between sales promotions and purchase intention, having perceived risk as a mediator. In other words, comprehend which the optimal promotion bundle (the type of promotion & level of discount) is and thus maximize the consumer purchase intention and, at the same time, diminishing the perceived risk of the purchase. At a primary point, it was established a conceptual framework based on extensive background literature on the concepts and further ahead, this model will be studied empirically to identify possible significant connections between the variables.
To accomplish those objectives and to reach the proposed conclusions, different research methods and distinct types of research have been employed. Regarding the research methods, it is possible to highlight three, exploratory, descriptive and explanatory (Saunders, Lewis & Thornhill, 2009). In this dissertation, only exploratory and explanatory methods were used. The dissertation started by using the exploratory method, to gain some insights, clarify some concepts, to formulate the research problem and establish the hypotheses through the existing literature. Subsequently, the explanatory method was used to confirm and explain potential casual relationships that may exist between the variables (Saunders, Lewis & Thornhill, 2009). Moving to the research’s approaches, (Creswell, 2003.) suggested three types, quantitative, qualitative and mixed. The study will only focus on quantitative approach using a survey research strategy which was used to collect data about the variables, test the proposed hypotheses and displays models of the effects which could be further analysed quantitatively through statistics.
3.2 Secondary Data
Secondary research was largely presented in form of academic articles and journals on literature review chapter which allowed to take some insights for this research.
3.3 Primary Data
Only quantitative analyse was used through an online survey which was submitted on social media platforms and via e-mails.
Using this type of quantitative approach entails some strengths and weaknesses of the study. On the advantages side, online surveys have a greater speed of response, involve lower costs, flexibility, possibility to reach a larger number of respondents, time saving/ timeliness, convenience (Duffy & Smith, 2005; Evans, Evans, & Mathur, 2005). Regarding the disadvantages, they are more related with sampling problems, selection bias and error (Duffy & Smith, 2005), privacy and security problems and more impersonal approach (Evans et al., 2005).
Before the introduction of the survey on online base, a pilot test was conducted with 7 people with the aim to ensure the effectiveness of the survey in answering to the questions and to perceived whether the questions and the language of the survey were clear to the respondents. 3.3.1 Online Survey
3.3.1.1 Data Collection
This study will analyse the impact of sales promotions on PI in two product categories with the purpose to analyse potential differences that may arise from the consumer purchase intention and study their reactions to sales promotions in both categories. The categories chosen were chocolate and laundry detergent. This choice was made according to Palazón-Vidal & Delgado-Ballester ( 2005) research which is supported by Chandon et al. (2000), where it stated that those products are associated with different consumer purchase benefits. Accurately, the chocolate is correlated with hedonic benefits and laundry detergent with utilitarian benefits. To test this impact, an online survey has been shared via social media platforms, Facebook and LinkedIn, and by e-mail from 18thApril 2018 to 30thApril 2018 through which were collected 414 valid responses and 147 invalid responses.
Regarding the target population, the survey was restricted to Portuguese people who buy the categories in the last 12 months. Thus, to ensure this premise, the first question of the questionnaire is about the purchase and respondents only answer questions related to the product that they purchase.
The data of the survey was collected through non-probability or judgmental sampling technique which means that the sample was not chosen statically randomly. This technique is quicker and
has low costs comparing with probability sampling technique (Saunders et al.,2009). More precisely, using convenience technique which is characterized by the little variation in the population (Saunders et al.,2009) and easiness to conduct a study (Cooper & Schindler, 2011). 3.3.1.2 Research Design
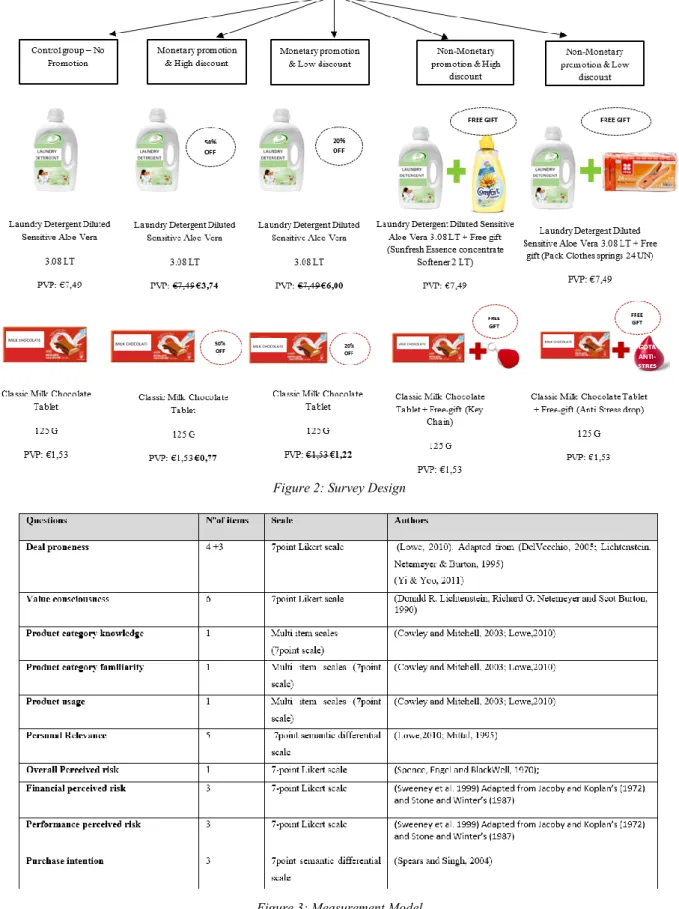
With a cross-sectional design, the model uses a 2 (monetary promotions, non-monetary promotions) x 2 (high discount, low discount) factorial design experiment. To exclude the potential brand preference bias and the past knowledge and experience about brands, the survey was done with unbranded products (Figure 2).
The survey has three main sections: the first one is common to all respondents who at least respond positively to one product purchase. The goal is to analysis the relationship between the respondents and sales promotions by asking about their propensity to buy products in promotions due to their deal form, deal proneness (Donald R Lichtenstein, Netemeyer, Burton, Netemeyer, & Burton, 1995; Dorjiald R Lichtenstein & Burton, 1990), and about their relationship between the quality of the product and the price paid for it, value consciousness (Dorjiald R Lichtenstein & Burton 1990, Donald R. Lichtenstein, Ridgway, & Netemeyer, 1993).
In the second section, the respondents will be exposed to one stimulus for product. Each product has 5 possible scenarios stimulus. The first one is a control stimulus which the product is displayed without promotion and in the remaining stimuli, the product will present with promotion using the different types of promotions and different level of discount (Figure 2). The respondents will be allocated randomly to one of the five scenarios. As the previous researches, sales promotions will be presented through a price discount, monetary promotions, and extra free-gift, non-monetary promotions (Lowe, 2010; Yoo, 2011). The value of the extra free-gift will have approximately the same value of the price discounts (Lowe, 2010).
After the exposure to the product stimulus, the respondents will answer about perceived risk and consumer’s purchase intention. Then, some questions were displayed to evaluate the personal relevance of category, product category knowledge and familiarly and the product usage and thus analyse the heterogeneity between groups. Each stimulus involves 8 questions. The survey finalizes with demographic questions such as age, gender, education level, yearly household income, marital status, and occupation.
3.3.1.3 Measurement
Following the survey’s division, the first section starts by estimating deal proneness that was measured through seven items on 7-point Likert scale by asking consumer’s proneness respond to promotions due to the deal form that it acquires (“I enjoy buying brands with deals”; “Compared to most people, I would say I have a positive attitude toward deals”; and “When I buy a brand on sale, I feel that I am getting a good deal.”; “Buying products with pence-off deals makes me feel good”, “ when I take advantage of a buy-one-get-one-free I feel good” ; “ I will sometimes switch brands when I can get something for free when purchasing another brand” and “ I like to take advantage of special deals I notice in the store”). The first 3 questions that were previously used by Yi & Yoo (2011) and the remaining questions were used by Lowe (2010) who adapted from Delvecchio (2005) and Lichtenstein, Netemeyer & Burton (1995). This section also evaluates value consciousness through the model used by Lichtenstein, Netemeyer & Burton (1990) by using six items on a 7-point Likert scale (“I am very concerned about low prices, but I am equally concerned about product quality.”; “When grocery shopping, I compare the prices of different brands to be sure I get the best value for the money.”; “When purchasing a product, I always try to maximize the quality I get the money I spend.”; “When I buy products, I like to be sure that I am getting my money's worth.”; “I generally shop around for lower prices on products, but they still must meet certain quality requirements before I will buy them.”; “I always check prices at the grocery store to be sure I get the best value for the money I spend.”).
In the second section, the stimulus will be presented to the respondents. Both products’ price was collected through Jumbo Online, the PVP of laundry detergent is €7,49 and the chocolate is €1,53. Regarding the type of promotions, monetary promotion is presented as price discount in percentage terms. According to Chen, Monroe, & Lou (1998), for low-price products, price discount framed in percentage terms (%off) is more significant than the same discount presented in dollar terms ($off). Thus, knowing that laundry detergent and chocolates are a low-priced category, this dissertation will flow the same logic of their model. Non-monetary promotions will be displayed as an extra free-gift. The levels of discount used for monetary promotions will follow the model of Lowe (2010), low level of discount presented by 20%, this level was also used by Garretson & Clow (1999), and high level of discount, 50% (Figure 2). Regarding the non-monetary promotions, for laundry detergent, the high discount is presented by offering a comfort concentrate softener 2LT with a price of € 3,49 and the low discount is a pack of clothes springs 24 UN with a price of €1,99. The prices presented were obtained through
Jumbo Online. Regarding the chocolate’s free-gifts, the high discount is presented by a keychain with a price of €0,85 and the low discount is an anti-stress drop priced €0,45 which were obtained from Brindes-Companhia website.
To assess the impact of sales promotions on perceived risk, 5 questions had been established. One first question about the overall perceived risk, to evaluate the amount of risk that consumer perceived in purchasing the products (extremely risky; very risk; moderately risky; neutral; slightly risky; low risky; not at all risky) using a 7-point scale adapted from Spence, Engel, & Blackwell (1970). Performance perceived risk and financial perceived risk had been measured by a construct that was used by Sweeney, Soutar, & Johnson (1999) which was an adaptation from Jacoby & Koplan’s (1972) and by Stone & Winter’s (1987). Those two types of risk can be estimated through three items each (Performance risk – “There is a chance that there will be something wrong with this product or that it will not work properly.”; “This product is extremely risky/not risky in terms of how it would perform.”; Financial risk – “There is a chance that I will stand to lose money either because it won’t work at all or costs more than it should maintain it.” ; “This product is extremely risky/not risky in terms of its long-term cost.”) at a 7-point Likert scale. To be accurate in measuring the variables, the scales of types of perceived risk that were previously at 9-point multi-item scale which were adapted to a 7-point Likert scale due to the consistency among the survey.
To measure the consumers’ purchase intention, this dissertation follows the construct used by Spears, Spears, & Singh (2004) using 3 items (“definitely not buy it - definitely buy it”; “definitely do not intend to buy - definitely intend to buy”; “Very low purchase interest - very high purchase interest”) at a 7-point semantic differential scale.
The questions about product category knowledge and familiarity, product usage and personal relevance, adapted from Cowley & Mitchell (2003) and Lowe (2010) models, will be inquired and are displayed on a 7-point scale, the first three will be present in a multi-item scale and the last in semantic differential scale.
For the concepts that are associated with two or more items, there is a possibility to compress all the items in one global variable if the internal consistency/reliability (Cronbach alpha value) between the items is, at least good / acceptable (>0.7). The procedure will start by transforming the variable, compute new variable, and the global variable will be the mean of all items. This process will make the analysis simpler and easier to interpret the results.
3.3.1.4 Data Analysis
All quantitative data collected through the survey was analysed in SPSS to confirm the proposed hypotheses of this dissertation. This confirmation was done through statistically significant parametric tests due to their statistical power (Saunders, Lewis &Thornhill, 2009).
Figure 2: Survey Design
Firstly, to describe the sample, descriptive statistics were used to analyse the demographics and some filtered questions (deal proneness and value consciousness).
Then, to analyse the effect of different type of promotions and level of promotions on purchase intention, independent-sample T-tests (compare means tests) were performed. ANOVA tests were conducted to understand the effects of sales promotions elements (the type of promotions and level of discount) on the types of perceived risk (financial and performance). Regarding the impact of perceived risk and sales promotions on purchase intention, a linear regression and a correlation tests were conducted to determine the nature of the relationship between those variables.
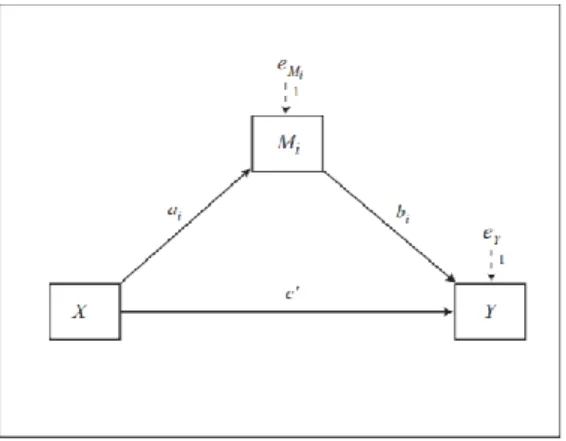
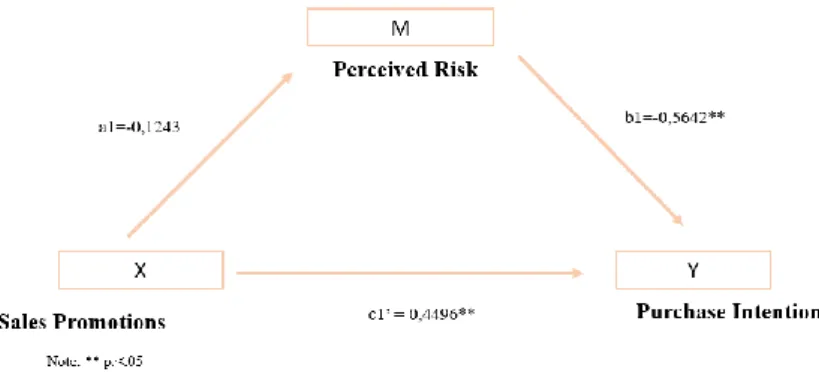
Finally, to study the possible mediator effect of perceived risk on the relationship between sales promotions and purchase intention, a macro PROCESS in SPSS created by Andrew F. Hayes was applied. In this study, the simple mediation model which only include one mediator was employed as it is shown in Figure 3. Through this model, X (independent variable) can affect Y (dependent variable) in two ways, directly and indirectly. Using a direct path, X affect Y independently the effect of M (mediator). Regarding the indirect path, X influences M and consequently this effect will impact Y (Preacher & Hayes 2004, Preacher & Hayes 2014, Preacher & Hayes, 2008). In sum, M tries to explain the relationship between X and Y.
CHAPTER 4: RESULTS AND DISCUSSION
This chapter analyses the quantitative data extracted from the online survey with the aim to evaluate the hypothesis described in literature review chapter and consequently respond to the research questions.
4.1 Sample Characterization
In total, 429 individuals represented valid responses for the study, however, 15 were excluded for not buy chocolate and laundry detergent on the last 12 months, thus, the sample was 414 individuals.
There was a female predominance which 63% of the sample. Only 37% were men. Most of them were single (51,2%) or were married/domestic partner (41,3%). In terms of age, the sample is slightly diversified, 30% were aged between 18-24, 22% aged between 35-44 years, 19,1% aged 25-34 and 17,9% aged 45-54 years old. Almost all the individuals were students (22,5%) or employed (74,6%) and 260 individuals had, at least, the bachelor’s degree, which made 62,8% of the sample, perhaps this happened due to the convenience sampling technique used in the survey. On what refers to yearly household income, 69,8% of the individuals affirmed that their yearly income is inferior to €50 000.
Considering the consumers’ proneness to buy products in promotions due to deal format and the value consciousness, more than a half of individuals assumed that, at least, somewhat agree with every sentence of each subject which presume that they are more propense to buy on deal form and they value the price/quality relationship.
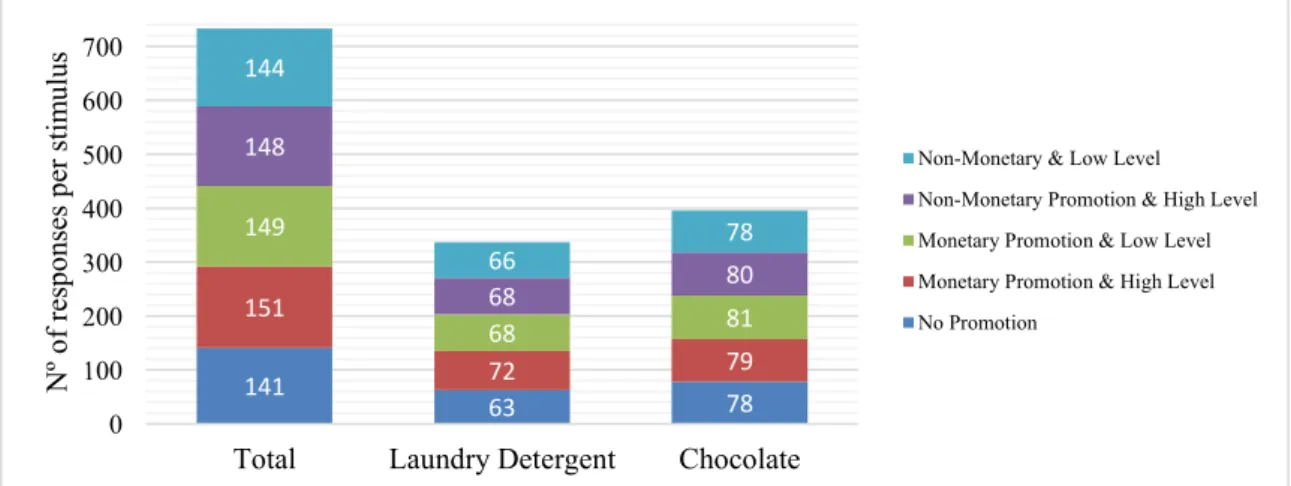
Finally, through the survey, the different stimuli were presented 733 times because each product has one stimulus associated, thus if the respondents answer “yes” in the purchase question for both products, it will appear two randomized stimuli per respondent. For laundry detergent, there were 337 valid responses and each stimulus was presented, on average, 67 times. Regarding the chocolate, 396 answers were validated, and each stimulus was displayed, on average, 79 times (Figure 4).
4.2 Measure Reliability
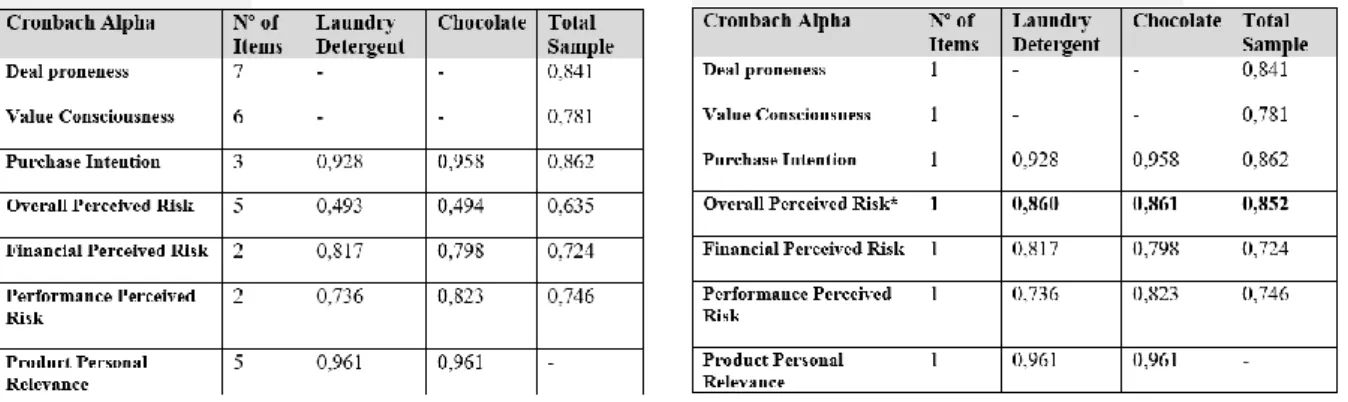
To check the reliability and the internal consistency of the variables used in the sample, a Cronbach’ alpha test was conducted for purchase intention, perceived risk and filtered variables (deal proneness, value consciousness and product relevance). To calculate the Cronbach alphas for the total sample, the study joined the items associated to the two products in one Cronbach alpha analysis.
For all seven items of deal proneness the Cronbach alpha equals 0,841 which is an acceptable value and the elimination of any items will not increase the reliability of the constructs. For value consciousness, this construct is connected to six items and have a Cronbach alpha equals to 0,781. Therefore, it is possible to create a unique variable for each concept as explained in chapter 3.
The purchase intention’s concept is associated to 3 items where the Cronbach alpha for laundry detergent equals 0,928, for the chocolate equals 0,958 and for the total sample is 0,862. No exclusion of items would increase the Cronbach alpha value. Due to the excellent internal consistency across the items, it is possible to compress those items in just one variable.
Regarding the perceived risk, the Cronbach alpha of overall perceived risk which include financial, performance and the general question is 0,493 and 0,494 for laundry detergent and chocolate, respectively, which is a very low internal consistency of the construct, however with the removal of the item “Which risk category best expressed the amount of risk you perceived in the purchase of this product in this specific buying situation?”, the Cronbach alpha increases to 0,860 for laundry detergent and 0,861 for chocolate which make a very good reliability and thus create the unique variable for this concept. For the total sample, with the removal of the same questions, the Cronbach alpha equals 0,852.
141 63 78 151 72 79 149 68 81 148 68 80 144 66 78
Total Laundry Detergent Chocolate
Nº o f resp on ses per s tim ulu s Promotions Stimuli
Non-Monetary & Low Level Non-Monetary Promotion & High Level Monetary Promotion & Low Level Monetary Promotion & High Level No Promotion
The financial perceived risk for laundry detergent is 0,817, for chocolates equals 0,798. And for the total sample equals 0,725. Regarding the performance perceived risk, the Cronbach alpha is 0,736, 0,823 and 0,746 for laundry detergent, chocolate and total sample, respectively. For both concepts, it is possible to create one general variable since the Cronbach alpha has acceptable values.
Finally, the Cronbach alpha of the product relevance equals 0,961 and 0,964 for laundry detergent and chocolate, respectively, meaning an excellent reliability among the items. As explained in chapter 3, there is a chance to create the global product relevance variable.
4.3 Results from the Hypothesis Test 4.3.1 Hypothesis 1
a) Linear Regression Analysis: The impact of sales promotions on consumer purchase intention
To analysis this effect, a linear regression analysis where the independent and dependent variables are metric should be performed. Knowing that sales promotions is a categorical variable, the only way to conduct a linear regression is to transform into dummy variable where “No promotions” assumes the value of 0 and all types of promotions (MH; ML; NMH; NML) will take the value of 1, the SPSS output is presented in appendix 5.1.
All the assumptions were validated. There is independence of observations (Durbin-Watson_total=1,849; Durbin-Watson_detergent=1,935; Durbin-Watson_chocolate=1,814), the variables are approximately normally distributed, there is homoscedastic across data (scatterplots) and the residuals errors of the regression are approximately normally distributed. There are no multicollinearity effects, condition index < 15 (Liu, Kuang, Gong, & Hou, 2003).
The correlation between sales promotions and purchase intention is extremely weak (ρ=0,085). The model with this independent variable do not explain very well the variance of the dependent variable with a R-Squared of 0,07, sales promotions only explain 7% of the variance of purchase intention. Sales promotions are just a small driver of purchase intention. Although this weakness, the model is significant (ANOVA p-value=0,022) so it predicts well the purchase intention. At a significant level of 5%, sales promotions have a statistically significant positive effect on purchase intention (β=0,348), an increase of 1 unit of sales promotions will lead to an increase of 0,348 of purchase intention. This test validated the H1a).
Analysing each product category separately, the correlation between those variables is stronger in laundry detergent (ρ LD=0,137; ρ C=0,0499). The variance of purchase intention is better explained by laundry detergent (R-Squared LD = 0,019; R-Squared C =0,002) and only this category predicts well the purchase intention being statistically significant. Hence, for laundry detergent, the sales promotions have a statistically significant positive effect on purchase intention (β=0,520; p-value=0,012) and the case of chocolate, this effect is not statistically significant (β=0,215; p-value=0,328). Thus, the H1a) is just validated for laundry detergent.
b) Independent-samples T-test: The effect of types of promotions on purchase intention This test was conducted to understand if the types of promotions (Monetary and Non-Monetary), a categorical variable with two independent groups, differed based on consumer purchase intention, a metric variable, appendix 5.2.
H0:
µ
Monetary promotions =µ
Non-Monetary promotions Figure 7: H1a ResultsRegarding the assumptions, the dependent variable is approximately normally distributed among the groups of the independent variable (histograms and Q-Q normal) despite the Shapiro-Wilk test rejected the Ho, this test is quite “robust” to violations of normality and the homogeneity of the variances (Levene’s test) was confirmed for the two products (p-value LD =0,527; p-value C=0,05) and for the total sample was not validated (p-value_total= 0,041). Nevertheless, at a significant level of 5%, the independent samples test determines that there are statistically significant differences among the means of the two types of promotions (p-value=0,004) when looking at “equal variances not assumed = variâncias iguais não
assumidas” due to the violation of homogeneity of variances. The mean of monetary
promotions (µ=4,288) is superior from the mean of non-monetary (µ=3,906) which means that the consumers purchase intention increases when the product include monetary promotions. Therefore, the H1b and H1b1 are both confirmed, in fact, the two types of promotions have statistically different effects on purchase intention where monetary promotions have the largest one.
The conclusions of the two products are different. For laundry detergent, there are no statistically significant differences between the types of promotions (p-value=0,552), even though, the mean of purchase intention using monetary promotions (µ=4,06) is higher than using non-monetary promotions (µ=3,96), it is not statistically relevant. Hence, the H1b and H1b1 are not proved.
Unlike laundry detergent, chocolate has statistically significant differences on the means of purchase intention using different types of promotions, at a significant level of 5% (p-value=0,001). The mean of monetary promotions (µ=4,48) is statistically superior comparing to the mean of non-monetary promotions (µ=3,86). In other words, the monetary promotions influence more positively the purchase intention. This analysis confirms the H1b and H1b1.
c) Independent-samples T-test: The effect of level of discounts on purchase intention This analysis include as the dependent variable, purchase intention (metric variable) and as the independent variable, level of discount which have two unrelated groups, high and low level of discount, presented in appendix 5.3.
H0:
µ
High Level =µ
Low LevelThe assumptions were confirmed. The homogeneity of the variances was validated through the Levene’s test (p-value_total =0,245; p-value LD =0,974; p-value C =0,095) and despite Shapiro-wilk test have rejected the hypothesis of normality, the dependent variable is approximately normally (histograms and Q-Q Normal Graphic).
At a significant level of 5%, the Ho is rejected (p-value=0,032) meaning that purchase intention are statistically affected differently by the two level of discounts. The high level of discounts has a higher mean of purchase intention (µ=4,24). Hence, the consumer purchase intention is bigger when the product is associated with high level of promotions. Thus, the H1c and H1c1 are confirmed in this test.
Going specifically through both products, in the case of laundry detergent, the Ho is rejected with a p-value of 0,007, at a level of significant of 5%, which means that there are statistically significant differences among the two level of discounts in purchase intention. The mean of high level (µ=4,25) is statistically superior comparing with low discount (µ=3,77). Thus, the consumer purchase intention is higher when the promotion has a high level of discount that confirmed the H1c and H1c1.
For chocolate, the Ho is not rejected (p-value=0,529), not rejecting the equality of the means of each group. There are no statically significant differences between both groups on purchase intention. Nevertheless, the mean of high level of discount is residually superior from the mean of low level even though it is no statistically significant at a 5% of significance, thus H1c and H1c1 are rejected.
4.3.2 Hypothesis 2
a) Linear Regression Analysis: The impact of sales promotions on perceived risk
Similar of what happened in H1a, sales promotions are used as dummy independent variable and perceived risk is the metric and dependent variable, the results are presented in appendix 5.4.
The assumptions of the model were confirmed. There is independence of observations (Durbin-Watson_Total=1,752; Durbin-Watson_LD=1,936; Durbin-Watson_C=1,753), the variables are approximately normally distributed, homoscedastic is confirmed across the data (scatterplot) and the residuals errors of the regression are approximately normally distributed. There are no multicollinearity effects, condition index < 15 (Liu et al., 2003).
The correlation between both variables is quite low (ρ=0,015). This model doesn’t explain any variance of the overall perceived risk, meaning that sales promotions is not a driver of overall perceived risk. More, the model is not significant on predicting the dependent variable (ANOVA p-value=0,695). At a confidence level of 95%, sales promotions do not have a statistically significant effect on overall perceived risk (β=0,049; p-value=0,695). Thus, the H2a is not validated. This result also implies that perceived risk may not be a good variable to explain the relationship between sales promotions and purchase intention since there is not significant effect of sales promotions on this variable.
For the product categories used, the output of its models is not satisfactory. The R-Squared values of the models are extremely low, 0,001 and 0,003 for laundry detergent and chocolate, respectively, not explaining the variance of perceived risk. Both models are not significant. More, neither in laundry detergent or chocolate, sales promotions have a statistically significant effect on perceived risk. In laundry detergent case, sales promotions have the inverse effect on perceived risk, it means that when the sales promotions increase, the perceived risk would decrease, however this impact is not statistically significant at a level of significant of 5%. Unlike laundry detergent, sales promotions on chocolate would increase the perceived risk. The H2a is not validated for both products.
c=0,049 c= - 0,125
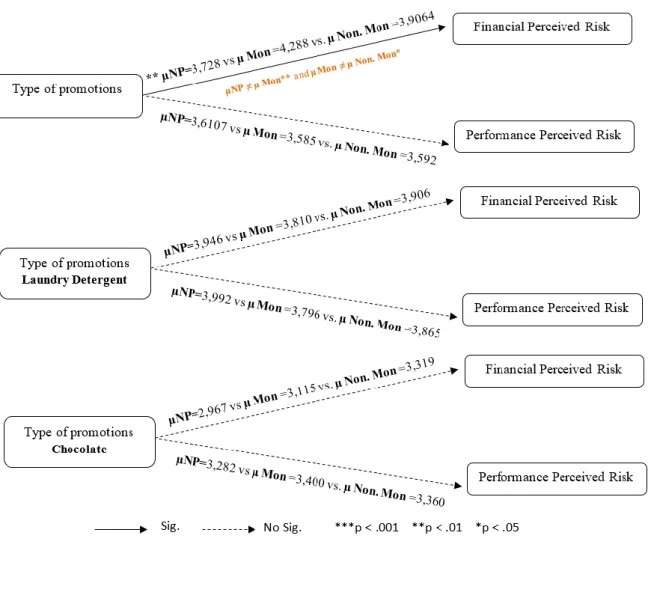
b) One-way ANOVA: The effect of types of promotions on financial and performance perceived risk
A compare means test, one-way ANOVA, was conducted to determine whether the financial and performance perceived risk, metric dependent variables, differ based on the type of promotion used, categorical independent variable, which is divided into three independent groups (No promotion, Monetary promotion, Non-Monetary promotion), displayed in Appendix 5.5.
H0:
µ
No promotions =µ
Monetary promotions =µ
Non-Monetary promotionsAll the assumptions of the model are validated. There is homogeneity of variance (Levene’test) was validated for the total sample (p-value F=0,118; p-value P=0,129) and for laundry detergent (p-value F= 0,066; p-value P=0,069) however, for chocolate, there is no homogeneity of variance for performance perceived risk (p-value P= 0,010) which implies that the means’ analysis must be through Welch test. The dependent variable is approximately normally distributed among each group of independent variables. Despite the shapiro-wilk test reject Ho, the histograms demonstrate that the distribution is approximately normal.
The conclusions of ANOVA model, at a significant level of 5 %, are that financial perceived risk have statistically significant differences among the three groups of promotions (p-value=0,001) and in the case of performance perceived risk, there are no statistical differences between the promotion used (p-value=0,985).
To identify the groups that differ from each other, a post-hoc (Turkey) test was conducted and concluded that, for financial perceived risk, the statistically significant differences are between no promotions-monetary promotions (p-value=0,002) and monetary-non-monetary promotions (p-value = 0,011). Monetary promotions (µ=4,2889) lead to a higher financial perceived risk comparing to the other two groups (µNP=3,7286; µNMP=3,9064). Looking at the means, it is possible to highlight that the financial perceived risk is lower than when there are no promotions associated with the product.
Regarding the performance perceived risk, the differences between means are not statistically significant which implies that promotions will not affect significantly the performance perceived risk. However, the promotions decrease this type of risk, independently the type of promotions used. Therefore, the H2b and H2b1 are not validated.
Considering the two product categories individually, it is possible to conclude that there are no statistically significant differences among the three different groups of promotions for financial perceived risk and performance perceived risk in both products (value F LD= 0,757 and p-value F C=0,185) (p-p-value P LD = 0,618; p-p-value P C (welch test) = 0,869). Hence, for both perceived risk, the use of promotions is not statistically significant. Therefore, the H1b and H1b1 are not confirmed. Even so, for laundry detergent, it is likely to recognize that the financial and the performance perceived risk are lower on monetary promotions and non-monetary promotions comparing with no promotion stimulus. For chocolate, the conclusions are completely opposite, the financial and the performance perceived risk are higher when uses sales promotions.