.
Understanding membership programs
effectiveness: the impact of perceived value,
hard and soft benefits on the consumers’
purchase intention.
Marta Carrasco
Dissertation written under the supervision of
Prof. Paulo Romeiro
Dissertation submitted in partial fulfilment of requirements for the MSc in
Business, at the Universidade Católica Portuguesa, Abril de 2020.
ABSTRACT
Title: Understanding membership programs effectiveness: the impact of perceived value, hard
and soft benefits on the consumers’ purchase intention.
Author: Marta Carapinha Carrasco
Companies that have been using memberships have increased sales from millions to billions. Membership programs enhance customer retention, providing excluding benefits to members. This allows to increase the yield of the most profitable customers through long-term and interactive, value-added relationships. Moreover, it has been proofed that customer retention leads to long-term financial performance, as a result of reducing costs, less price sensitivity and increasing the average ticket. However, there is a high percentage of churn and the effectiveness of these programs can be hard to achieve. Nevertheless, what if companies could understand which benefits, they need to offer to achieve successful membership programs? This research aims to answer four research questions that contribute to the understanding of which benefits lead to membership program effectiveness and their weight on consumers' purchase intention by introducing: soft benefits, hard benefits, and perceived value.
Accordingly, three research procedures were carried out: Pre-Survey, Focus Groups, and Survey. This rational path allowed the application of different techniques to test the hypotheses. Findings show that these three elements influence positively the purchase intention of membership programs. Moreover, it presents status and gratitude as essential keys of soft benefits and perceive value as a crucial element on affecting consumers’ willingness to buy. Yet, it demonstrates that low price is highly effective and prevail versus soft benefits.
That said, this paper recommends managers to invest in membership programs pricing strategies and academics to further explore this topic.
Keywords: membership programs, perceived value, soft benefits, hard benefits, gratitude,
SUMÁRIO
Título: Compreensão da efetividade de programas de fidelização exclusivos a membros: o
impacto da perceção de valor, benefícios interpessoais e financeiros na intenção de compra do consumidor.
O uso de programas de fidelização exclusivos a membros tem vindo a aumentar as vendas de retalhistas de milhões para biliões, através da retenção de clientes e oferta de benefícios exclusivos. Estudos prévios confirmam que a retenção de clientes se reflete a longo prazo em resultados financeiros, através da redução de custos e da sensibilidade de preço, assim como o aumento do ticket médio gasto por cliente. No entanto, existe uma alta taxa de insucesso destes programas, resultando na dificuldade de atingir efetividade. O que aconteceria se as empresas conseguissem perceber que benefícios tem que oferecer de forma a atingirem o sucesso destes programas? O objetivo desta investigação é responder a quatro perguntas de estudo que contribuem para a compressão dos benefícios que influenciam a intenção de compra destes programas. Esta pesquisa apresenta três elementos cruciais: benefícios interpessoais, financeiros e perceção de valor.
Foram desenvolvidos três procedimentos: pré questionário, grupo de foco e questionário. As conclusões demonstraram que estes três elementos afetam positivamente a intenção de compra de programas de fidelização exclusivos a membros. O estatuto e gratidão, foram apresentados como benefícios interpessoais. Não obstante, a perceção de valor é também fundamental. Por último, é demonstrado que quando as empresas tiverem que optar por uma estratégia de marketing, preços baixos e atrativos tem que ser a sua maior preocupação.
Posto isto, esta pesquisa recomenda os gestores a investir em estratégias de preço quando construem programas exclusivos a membros e a investigadores a desenvolver mais pesquisas sobre este tema.
Palavras-chave: programas de fidelização, programas de fidelização exclusivos a membros,
TABLE OF CONTENTS
ABSTRACT ... II SUMÁRIO ... III TABLE OF CONTENTS ... IV TABLE OF FIGURES ... VI TABLE OF TABLES ... VII TABLE OF APPENDICES ... VIII GLOSSARY ... IX
CHAPTER 1: INTRODUCTION ... 1
1.1BACKGROUND AND PROBLEM STATEMENT ... 1
1.3RELEVANCE ... 3
1.4RESEARCH METHODS ... 4
1.5DISSERTATION OUTLINE ... 4
CHAPTER 2: LITERATURE REVIEW AND CONCEPTUAL FRAMEWORK ... 6
2.1E-COMMERCE AND MAJOR PLAYERS ... 6
2.2MEMBERSHIP PROGRAMS ... 6
2.3TYPES OF MEMBERSHIP PROGRAMS ... 7
2.4THE IMPACT OF THE PERCEIVED VALUE ON CONSUMERS ... 9
2.5UNDERSTANDING DEEPLY PERCEIVED VALUE ... 10
2.6DIVING DEEP ON SOFT AND HARD BENEFITS ... 10
2.7SOFT BENEFITS ... 11 2.8HARD BENEFITS ... 11 2.9PURCHASE INTENTION ... 12 2.10CONCEPTUAL FRAMEWORK ... 13 2.11HYPOTHESIS ... 14 CHAPTER 3: METHODOLOGY ... 14 3.1RESEARCH APPROACH ... 14 3.2SECONDARY DATA ... 15 3.3PRIMARY DATA ... 15 3.3.1DATA COLLECTION ... 15
3.3.1.1TARGET POPULATION AND SAMPLING ... 15
3.3.1.2PRE-SURVEY ... 16 3.3.1.3FOCUS GROUP ... 17 3.3.1.4SURVEY ... 18 3.4DATA ANALYSIS ... 20 3.4.1RELIABILITY OF SCALES... 21 3.4.2NORMALITY TEST ... 21
CHAPTER 4: RESULTS AND DISCUSSION ... 23
4.1RESULTS ... 23
4.1.2DESCRIPTIVE STATISTICS ... 23
4.1.3 RESULTS FROM THE HYPOTHESIS TEST ... 28
4.2RESULTS DISCUSSION ... 33
CHAPTER 5: CONCLUSIONS AND LIMITATIONS ... 35
5.1MAIN FINDINGS &CONCLUSIONS ... 35
5.2MANAGERIAL /ACADEMIC IMPLICATIONS ... 36
5.3LIMITATIONS AND FURTHER RESEARCH ... 37
REFERENCE LIST ... I APPENDICES ... V
TABLE OF FIGURES
Figure 1 - The membership marketing model from (Wirtz & Kum, 2001) ... 9
Figure 2- Online shopping buyer behavior (Riley, 2012) ... 12
Figure 3- Conceptual Framework ... 13
Figure 4- Perceived Value Impact on Purchase Intention ... 30
Figure 5- The impact of Soft Benefits on Purchase Intention ... 30
Figure 6- The Impact of Low price on Purchase Intention ... 31
Figure 7- The weight of soft benefits and low price on Purchase Intention ... 32
TABLE OF TABLES
Table 1- Types of Memberships – Font from (Wirtz & Kum, 2001) ... 8
Table 2- The Hypothesis ... 14
Table 3- Stimuli ... 17
Table 4- Constructs ... 19
Table 5- Cronbach's Alpha Results ... 21
Table 6-Normality Test Results ... 22
Table 7-Distribution of cases for incitement ... 22
Table 8- Membership Programs Knowledge Measures and Statistic Tests ... 25
Table 9 - MPs and Amazon Prime MP Admission ... 26
Table 10- Gender ... 26
Table 11- Age ... 27
Table 12- Education level ... 28
Table 13- Spearman correlation ... 29
Table 14- Linear Regression for Perceived Value ... 30
Table 15- Soft Benefits Linear Regression ... 30
Table 16- Low and High Price Linear Regressions' ... 31
TABLE OF APPENDICES
Appendix 1:Pre-Survey ... V Appendix 2: Focus Group ... X Appendix 3: Survey ... XII Appendix 4: Sample Characteristics ... XVII Appendix 5: Spearman Correlations ... XIX Appendix 6: SPSS Results ... XIX
GLOSSARY MP – membership program MPs – membership programs PV – perceived value PI – purchase intention SB- soft benefits HB – hard benefits CC - correlation coefficient DV – dependent variable IV – independent variable
CHAPTER 1: INTRODUCTION 1.1 Background and problem statement
The use of the internet brought a significant change in the way buyers and sellers interact. As a consequence of the emergence of e-commerce, a huge variety of channels has surged to interact with customers, however, the challenge remains on creating valued customer relationships that can achieve higher business’ performances. Online Shopping allowed the nature of different interactions with customers that grant companies the tools to collect data and design a customer advantage strategy. (Rust, Ambler, Carpenter, Kumar, & Srivastava, 2004). Companies are working to build and retain strong online relationships with their clients. However, customers have the decision to allow or not companies to interact and nourish that relationship (Steinhoff, Arli, Weaven, & Kozlenkova, 2019). Therefore, in order to increase customer lifetime value, a new generation of online membership programs has arisen developing new opportunities and challenges for businesses and consumers. Marketers have been increasingly using membership programs to enhance customer retention by providing exclusive benefits to consumers. The managerial goal of these programs is to have stable customer retention through customer satisfaction which will lead to long-term financial performance, (Wirtz & Kum, 2001) as a result of reduced servicing costs, less price sensitivity, increasing tickets and word of mouth (Grahame R. Dowling and Mark Uncles, 1997). Previous authors define this type of marketing as membership marketing, a form of loyalty program that identifies, maintains and increases the yield from the most profitable customers through long-term, interactive, value-added relationships. (Wirtz & Kum, 2001). There are different types of membership programs, however, companies have been lately investing in the price-driven memberships which are those that the consumer must pay a joining or monthly/annual fee. Amazon, Google, and Sephora are examples of firms selling online membership programs in order to offer the consumer not only advantages but a feeling of belonging to something exclusive. For instance, Amazon has already 101 million members on its paid membership which purchased over 175 million items on an exclusive two days shopping that shacked the whole industry sales. (CNBC, 2019). On the other hand, there have been unsuccessful membership programs like Air Miles award programs and Food and Beverages memberships. The intention of membership programs is to maintain a long-term customer relationship by providing members exclusive benefits versus the non-members. Previous case studies have shown that members of loyalty programs are less likely to be informed of competitors' advantages, inclusive cost advantages, quality, billing aspects, than non-members because their focus is on its main service provider. However, customers on memberships programs are deeply exposed to the share of information and
shopping experiences which can lead to bigger barriers when purchasing a program.(Bolton & Bramlett, 2000). Although membership program usage is increasing between companies' strategies, little previous research was made on which concepts and mechanisms are involved in a membership program purchase decision. (Wirtz & Kum, 2001b).
To make the right managerial decisions through the design of a membership program, managers, need to understand how they can influence the decision-making process of consumers. There are few previous research that leads us to explanations on how and why membership marketing is effective in some programs and not in others. (Wirtz & Kum, 2001). The absence of theoretical understanding in respect of the concepts and foundations of membership programs' effectiveness leads to the need for new research. The goal of this analysis is to fill this gap, by identifying and exploring the three key elements on the purchase decision of membership programs: hard benefits, soft benefits, and perceived value. Different authors have discussed that perceived value has a direct effect on consumers’ purchase intention (Zeithaml, 1988; Parasuraman, Zeithaml &Berry, 1988; Jen & Hu, 2003, ), defining it as “the relationship between price, quality, tangible and intangible benefits”(Parasuraman, Zeithaml & Berry, 1988). Hard benefits are considered the tangible advantages are given to the consumers, related to price discounts or promotions; soft benefits are usually the intangible benefits and account for the value-added through exclusiveness and special treatment. Previous researchers have discussed how these benefits can contribute to consumers’ purchase intention, however, while some researchers agree that price in the form of sales promotions has a negative effect on the PI of a loyalty program (Zhang & Breugelmans, 2012) and therefore a marketing strategy should be based on soft benefits, in the sense that they are constructing a permanent advantage (Grahame R. Dowling and Mark Uncles, 1997). Other authors disagree, defending that should be based on price. (Cengiz & Kirkbir, 2007). Moreover, other articles defend that having a combination of both, hard and soft benefits is key for a successful and value-oriented membership strategy (Wirtz & Kum, 2001). Therefore, is not clear which benefits or combination have a greater influence on a consumers’ purchase intention and little knowledge is discussed regarding their significance on a membership program. Since no previous research was found on this specific matter, further research is required in order to understand the weight of hard and soft benefits on a consumers’ purchase intention of a membership program, to support managerial decisions and expand academic knowledge. This new research proposes a broad analysis of membership programs, in terms of the effects of hard and soft benefits, as like perceived value, on consumer s’ purchase intention.
1.2 Problem Statement
The scope of this research is to understand which benefits, hard or soft, have a positive impact on the purchasing intention of a membership program and consequently identify their weights on this decision. Additionally, understanding how perceived value can influence purchase intention. These are the three keys to lead the effectiveness of membership programs. This analysis could be summarized through:
Understanding membership programs effectiveness: the impact of perceived value, hard and soft benefits on the consumers’ purchase intention.
The present research intends to give answers to the following research questions:
RQ1. What is the effect of perceived value on a consumers’ purchase intention of a membership
program?
RQ2. What is the impact of soft benefits on a consumers’ purchase intention of a membership program?
RQ3: What is the impact of hard benefits on a consumers’ purchase intention of a membership program?
RQ4: Do Hard benefits have a stronger impact on consumers' purchase intention of a membership program than Soft Benefits do?
1.3 Relevance
Nowadays, consumers have more choices than ever, and due to legal requirements, they are the ones who can now choose who and when companies can interact with them. Companies need to work hard on their customer relationship strategies to have a competitive advantage. It is no longer enough to offer sales promotions, marketers need to be customer obsessives, anticipate customer needs and offer meaningful interactions that create value (Forbes, 2018). In order to offer an exclusive service while collecting data, it has emerged the membership programs that have shown significant results on business performances. Retailers that have been using marketing membership have increased sales from $57.0 million to 2.6$ billion in 5 years. However, there is a high percentage of churn. (Mckinsey & Company, 2018). Previous authors agreed that loyalty programs are an important marketing strategy, however many of them have been showing low performances and the reason has remained unknown by marketers and researchers. (Steinhoff & Palmatier, 2016). The challenge remains on understanding which benefits have a positive impact on the consumer while purchasing a membership program. In this way, companies can design long term marketing memberships strategies focused on the right key factors, that will provide future revenue growth. From what I am concerned about,
there are few previous research that can help managers to understand consumers making decision factors while designing membership program features. As Wirtz and Kum have identified on one of a few papers focused on understanding the determinants of membership marketing, future research could be made “for instance, the consumer values that drive the decision to "purchase" a membership could be examined through an empirical study. This would advance knowledge and perhaps illuminate marketers' understanding of the consumer decision-making process.”(Wirtz & Kum, 2001)
The present research is critical to service managerial decisions on membership programs and academic institutions that intend to have a broader knowledge of this topic. I intend to offer knowledge that will allow managers to build effective membership programs in their organizations and therefore increase client retention through their purchase.
1.4 Research methods
To offer the most concise possible analysis, this research will use, both, primary and secondary data. Secondary data conducted by literature review would be collected from previous studies based on loyalty and membership programs, perceived value, hard and soft benefits, and purchase intention, which will extensively be analyzed to extract learnings. As a result, it would be obtained a deeper understanding of these subjects, helping to establish constructs and develop a rational path to define the hypothesis.
Additionally, supported by primary data, collected through a pre-survey and the main survey, both distributed online. A focus group was also developed between the questionnaires. The questionnaire was based on qualitative questions to understand the strength of the variables towards consumers' purchase intention. The primary statistical analyses which are used to answer the RQs are parametric and non-parametric tests, such as, Linear and Multiple Regressions, Levene’s, Mann- Whitney, Kruskal–Wallis and Spearman Correlations.
1.5 Dissertation outline
The following chapter will present a literature review focused on the key elements of memberships programs from the broader topics to the specific ones, this stage focus on presenting different theoretical foundations previously presented about the different variables. The methodology chapter clarifies which research methodology would be used to answer the research questions. The next chapter will present the results of the secondary and primary data, deeply analyzed the outcomes and a discussion of the findings. The last chapter would be
presented the main and critical findings as well as the limitations and suggestions for further researches.
CHAPTER 2: LITERATURE REVIEW AND CONCEPTUAL FRAMEWORK 2.1 E-commerce and Major Players
The usage of the internet brought a significant change in the way buyers and sellers interact. As IBM has stated in 1997, e-commerce can be defined as the act of buying and purchasing goods and services through the use of technology and telecommunications infrastructure. Further ahead in 2002, Philip Kottler added the concept of buying and selling processes supported already by electronic devices. Since then, e-commerce sales have been growing worldwide and with it the rise of new opportunities and challenges. The total global sales of e-commerce have reached US$2.3 trillion, 10.1% representing overall retail sales (eMarketer 2017). Companies need to perceive how to take leverage from this advance in order to keep competitive in the market (McGlaughlin, 2015). The value of online sales in Europe has been significantly increasing from 455€ billion in 2015 to over 510€ billion in 2016. It is inevitable to monitor factors that affect purchasing behavior, otherwise, businesses may experience the risk of losing clients and be left behind (Bucko, Kakalejčík, & Ferencová, 2018). The major e-commerce websites players that have contributed significantly to the industry development are Amazon, eBay, and Alibaba. Overall, these companies attract more than 660 million online visitors monthly and in the USA 60% of users buy online at least monthly (Steinhoff, Arli, Weaven, & Kozlenkova, 2019). The comprehension of consumer behavior allows Marketeers to leverage customer experience and consequently generate higher performances (McGlaughlin, 2015). However, previous researches have shown that European e-commerce development is diversified as a result of several barriers, that can be identified as a lack of information for online businesses (Bucko et al., 2018). Online shopping can represent a threat to customer loyalty for companies that are not able to work on interpersonal relationships with their clients (Steinhoff et al., 2019).
2.2 Membership Programs
Nowadays, customers have the decision to allow or not companies to interact and nourish a relationship before or after the purchase (Steinhoff, Arli, Weaven, & Kozlenkova, 2019). In order to establish value customer relationships, companies are offering loyalty reward programs with the belief that these programs have a long-run effect on customer behavior and consequently on long-term financial performance (P.K.Kannan and Matthew D.Bramlett And, 2000). Previous studies have shown that on average retaining existing clients is 6 times less expensive than acquiring new ones, furthermore, the increase of customer satisfaction can in some cases, double profits. (Bhattacharya, 1998)
Nonetheless, reward programs have been developed to a higher level of customer commitment: membership programs. “Membership marketing is a form of a loyalty program, it is a marketing strategy that identifies, maintains and increases the yield from best customers through long-term, interactive, value-added relationships. “ (Wirtz & Kum, 2001). A membership program differs from the loyalty one, in the way that consumers need to take action. Either is to participate, such as signing in, paying an entry or monthly fee, or taking a step to earn the program. It is during the making decision process where consumers balance the weight of the costs and benefits exchanged during the membership duration and come to the conclusion whether the membership has enough benefits or not to make the financial effort. On the opposite, loyalty programs do not require the previous effort and offer rewards, directly through the purchase of the product or service (Wirtz & Kum, 2001). For instance, when you have a supermarket loyalty card the benefits are discounted automatically. The intention of membership programs is to maintain a long-term customer relationship by providing through a certain amount of time exclusive benefits to members versus the non-members. Previous case studies have shown that members of loyalty programs are less likely to be informed of competitors' advantages, inclusive cost advantages, quality, billing aspects, than non-members because their focus is on its main service provider. However, customers on memberships programs are deeply exposed to the share of information and shopping experiences which can lead to bigger barriers when purchasing a program (Bolton & Bramlett, 2000). Members are exposed to higher shopping expectations which can lead to easier losses on brand value since customers tend to take deeper the lack of trust than the gains, consequently can facilitate the switch to another service provider (Bolton & Bramlett, 2000). Although membership programs are a growing trend to companies as E-bay, Amazon, and Sephora, there is little knowledge about the concepts and structure behind membership marketing effectiveness, why do some programs are effective and others not are the question that remains about this strategy (Wirtz & Kum, 2001).
2.3 Types of Membership Programs
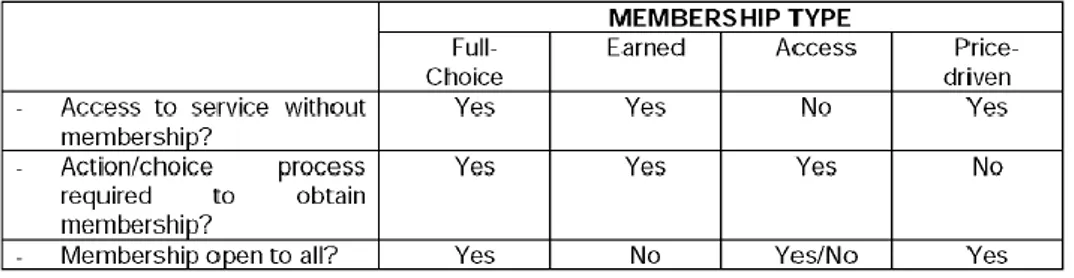
Previous research presented four different types of marketing membership programs : (1) full choice, (2) earned, (3) access and (4) price-driven. In a full-choice membership the consumers have the choice of participating in the program, the access to the company service is independent of the program access. However, special advantages are given to consumers that choose to be members of the program. For instance, a hairdresser’s membership card where a client can choose to be part of the program or not, despite having full access to the services the
consumer only has access to special promotions by accessing the membership card. The Earned membership goal is to make the most profitable consumers loyal, hence, the access to this membership is given by the firm exclusively to the best customers, as, an air company gold membership program. On the opposite, Access memberships, are the ones in which the company goods can only be acceded through the membership participation, for instance, a golf club where a client can only play if is a member. Price-driven memberships are those in which the consumers can accede to the regular company services, however, they have the option to sign in a membership that offers extra and exclusive benefits to members ( not available for non-members). Clients are required to pay a fee to join the membership (Wirtz & Kum, 2001). For example, Amazon has a Prime membership in which customers pay around 12,99$ per month in exchange for advantages as free and less than 24h delivery (Amazon, 2019). Companies have been lately investing in price-driven memberships as a result of their high long-term profitability. (Mckinsey & Company, 2018).
Table 1 below presents a summary of the four types of MPs and their characteristics.
Table 1- Types of Memberships – Font from (Wirtz & Kum, 2001)
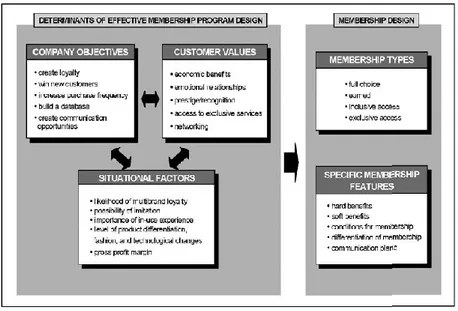
After deciding which type of membership to implement, marketers need to understand the important drivers that will enhance consumers' decision to join the program. A membership marketing model can have different determinants of effectiveness. Below are represented different features and a more abroad marketing model of these programs. This research will be analyzing price-driven memberships regarding their increased usage and impact on nowadays businesses’.
Figure 1 - The membership marketing model from (Wirtz & Kum, 2001) 2.4 The impact of the Perceived Value on consumers
“Value creation is widely discussed in the practitioner literature and is often a part of organizations ‘mission statements and objectives. It is seen by many commentators as the key to long-term success (…)”(Sweeney & Soutar, 2001).
Different authors have defined perceived value in distinguishing ways, Zeithaml in 1998 has referred it as “ the relationship between price, quality, tangible and intangible benefits”, furthermore, Monroe explains it as the tradeoff between quality and benefits received compared with the price paid. Moreover, in 2001, Samuels and Hakala affirm that perceived value was the main driver of a consumer to join or not a program. Previous authors have mentioned to three value propositions: (1) comparable quality at a comparable price, (2) superior quality at a superior price, (3) inferior quality at a discounted price, that can be related to joining fees and membership benefits (Parasuraman, Zeithaml & Berry, 1988). Additionally, Jillian and Geoffrey aligned that these sub functional should be measured separately. (Sweeney & Soutar, 2001). Overall, previous studies have agreed that customer perceptions of value directly influence their purchase intention (Zeithaml, 1988; Parasuraman, Zeithaml &Berry, 1988; Jen & Hu, 2003, ). The perception of value has a direct influence on the willingness to buy a consumer (Dodds, Monroe, & Grewal, 1991). As a consequence of what was discussed the first hypothesis is:
2.5 Understanding deeply Perceived Value
In 1998, Zeithaml stated that perceived value is defined by the costumer's perception of what is received compared with what is given (Souza & Baldanza, 2018). It is found common in previous research that perceived value is determined through the comparison of perceived benefits and perceived costs. Kim et al. (2007), has stated that it is not enough to offer a perceived value of a product based only on its price. Price is important, however, consumers consider other factors such as the perceived quality of a product (Grahame R. Dowling and Mark Uncles, 1997). Others developed a study that has concluded that perceived quality has a stronger impact on overall perceived value (Sweeney & Soutar, 2001). Results show that quality value has a significant impact on consumer’s willingness to buy, which has a substantial implication for marketing strategies, for instance, many companies have had experiment big losses due to their focus on pricing strategies and loss of confidence among consumers (Sweeney & Soutar, 2001). The scale developed by Sweeney is considered reliable since it has been tested in a post-purchase situation and also in a pre-purchase moment. Therefore, it will measure the perceived value and their subsequent perceived quality and price of this research.
2.6 Diving deep on Soft and Hard Benefits
Benefits are provided to consumers in order to solve problems and they are the main source of customer value, and these can be functional, economic and psychological. Moreover, previous researchers have considered hard and soft benefits essential features which resulted in the need of marketers to understand how to provide these benefits (Butscher, 1998).Hard benefits are considered the tangible advantages are given to the consumers, more specifically discounts, promotions, all related to price. To drive customer loyalty hard benefits can be necessary, however, they need to be accomplished with soft benefits. Indeed, a marketing strategy based on economic discounts can lead to dangerous customer behaviors such as discount-based purchases. On the other side, soft benefits are usually the intangible benefits and account for the value-added through exclusiveness and special treatment, additionally, they are harder for competitors to replicate. Having a combination of both, hard and soft benefits is key for a successful and value-oriented membership strategy (Wirtz & Kum, 2001). Economic benefits can be identified as hard benefits, which previous authors consider to not support a long-term value proposition to the client, in the way that when an economic advantage is given customers are satisfied however when is taken off it is considered a bad thing. By contrast, soft benefits are identified as providers of long-term value relationships in the sense that they are constructing a permanent advantage (Grahame R. Dowling and Mark Uncles, 1997). Previous
researches have shown a negative effect between sales promotions and purchase behavior as well as consumer decision to join a loyalty program (Zhang & Breugelmans, 2012). Thus, different consumers perceive different elements as value (Cengiz & Kirkbir, 2007).
2.7 Soft Benefits
Previous authors have indicated three drivers that guide relationship value:– 1(gratitude),
2(status), 3(unfairness), can simultaneously explain the positive and negative effects of the
loyalty program's performance. Studies should also be considered that not only the characteristics of the program matters, likewise how a company delivers the program matters (Steinhoff & Palmatier, 2016). Gratitude can be defined as “emotional appreciation for benefits received”, an emotion that when created in customers not only enhances performance as like create advantage customer behaviors and client retention, while status accounts for the emotional position benefits give in comparison with other consumers (Palmatier et al., 2006). Marketers should decide the conditions to be a member, the effort, the level of commitment of membership fee that is demanded from the customer. These features shouldn’t be too hard to obtain or very demanding (Wirtz & Kum, 2001). As a result, this research will evaluate these feelings on a MP through the combination of gratitude and status, which will be further mentioned as soft benefits in this research. On a price-driven membership, every client can have access to the MP through a joining fee, therefore, the feeling of unfairness is not presented regarding that is opened to everyone. Consequently, unfairness will not be considered as a valuable construct in this research, and the program designed will focus only on gratitude and status. The following hypothesis is:
H2: Soft benefits have a positive impact on the purchase intention of membership programs.
2.8 Hard Benefits
Previous authors have stated price as the most important element of marketplaces decisions. Donald and Rigway have defined price on its negative role as “(…) the amount of money that must be given up, and therefore higher prices negatively affect purchase probabilities (…)”. However, other studies have shown that, on the other side, some customers use price as an indicator of quality, thus, higher prices have a positive impact on purchase intention and therefore the price is considered on its positive role (Lichtenstein, Ridgway, & Netemeyer, 1993). The higher a price the higher the sacrifice of a consumer which can lead to a lower willingness to buy, however, lower the price can lead to lower perceived quality and value (Dodds et al., 1991). The price must be studied isolated from perceived value and quality, they are different dimensions of the value construct. Price was previously measured in other research
exclusively with the item “this product offers value for money”. However, Jillian and Geoffrey have shown through its research that a multi-item scale has a stronger impact on a purchase intention of a product, a useful and practical scale constructed to be easily applied to different purchase situations (Sweeney & Soutar, 2001). Marketers have been using price and promotions to attract traffic to retail stores, however, marketers that intend to design a profitable loyalty program need to ensure that attractive prices are offered under the programs or may be facing the risk of losing profit. (Grewal et al., 1998). Despite that, past research has also demonstrated that consumers are very diverse in terms of the perception of prices and promotions and there is a need to study price on specific situations (Zhang & Breugelmans, 2012). Grewal research findings illustrate that price is a key variable to be considered by marketers when designing strategies (Grewal et al., 1998). Therefore, relying on price-driven memberships, the price will be measured through a joining fee, the price a consumer needs to pay to have access to the membership program and will be applied through the comparison of two different stimuli: high price and low price. With that being said, the last hypotheses are:
H3: A Lower Joining Fee Price has a positive impact on the purchase intention of membership programs.
H4: A Lower Joining Fee Price has a higher weight on impacting positively consumers' purchase intention of a membership program versus soft benefits does.
2.9 Purchase Intention
Regarding online shopping buyer behavior, Riley has proposed a 5 stages framework that describes the making decision process: need recognition, information search, evaluation of alternatives, purchase decision and post-purchase behavior (Perreau, 2013).
Figure 2- Online shopping buyer behavior (Riley, 2012)
The first stage appears when a consumer has a lack between his actual situation and the desired one, then it passes for the information search to fill that gap and start to evaluate the different alternatives in order to do so. Moreover, after analyzing the alternatives the customer will purchase the product or service that fills better its needs and after using it the customer will build its opinion based on its experience and behave differently consequently, for instance, the
consumer can repurchase or not (Perreau, 2013). Marketers must understand what influences consumers in this decision-making process so that they can develop efficient marketing strategies. Previous researches on consumer behavior have confirmed that customers seek value maximization, preferring products that offer this value. That said, empirical results supported these studies demonstrating that perceived value leads to purchase intention (Kim, Xu, & Gupta, 2012). Dodds, Monroe, & Grewal have developed a research that studies the effect os price, brand and store information on buyers’ product evaluations, the finding suggested that customers brand and store information has a significant impact on the purchase intention, rather than just the price. Customers rely more on price when further information is not available (Dodds et al., 1991).
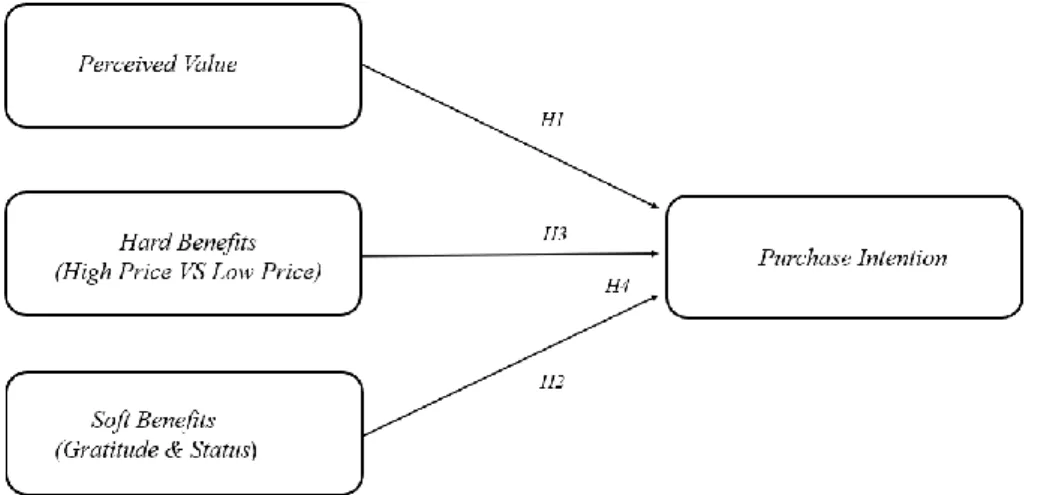
2.10 Conceptual Framework
To summarize the expected impact between the Independent Variables: Hard Benefits (High Price, Low Price); Soft Benefits (Gratitude, Status); Perceived Value and the Dependent Variable (Purchase Intention), a conceptual framework is presented below.
2.11 Hypothesis
Find below a summary of the hypothesis’ that are going to be further tested in this research.
Table 2- The Hypothesis
CHAPTER 3: METHODOLOGY
This chapter presents the methodology that has been used to study the main subject and analyze the research questions. The collection of both, primary and secondary data is presented in order to reach conclusions about the hypothesis presented in the previous chapter. On the second part is described the methodology used.
3.1 Research Approach
For the purpose of answering the research questions and analyze the validity of the hypothesis purposed, both exploratory and explanatory research approaches were followed. The first approach is usually used to advance a new topic or to dive deeper into a specific subject and its components. (Saunders, 2009). This approach has used secondary data such as the relevant topics to obtain a deeper understanding of the main concepts that constitute this research and analyze what has been previously studied by different authors, concluding which possible studies can enhance this research and helping to answer RQ. It is necessary to engage in explanatory research in an initial stage which is referred to as the extent of the collection, assessment, and structuring of secondary data. This process provides fundamental knowledge allowing the development of the hypotheses and constructs. On the other side, assumptions can lead to mistakes and fallible conclusions and taking into account that a research primary goal is to develop statements that are valid and reliable (Creswell, 2009), the research continues by collecting data to either support or disprove the theories presented in the literature.
H1: Perceived value has a positive impact on the purchase intention of a membership program. H2: Soft benefits have a positive impact on the purchase intention of membership programs. H3: A Lower Joining Fee Price has a positive impact on the purchase intention of membership programs.
H4: A Lower Price has a higher weight on impacting positively consumers' purchase intention of a membership program versus soft benefits does.
3.2 Secondary Data
In order to establish a theoretical framework, providing not only know-how as a consistent background of the overall and specific topics further studied, but secondary data was also collected. This theoretical stage relied on previous researches that contribute to a deeper understanding of the topics and an adequate assessment of the constructs and respective impacts. Furthermore, this rational path allowed the development of the present hypotheses. Secondary data was collected from top journal articles, published books and market researches.
3.3 Primary Data
The primary data collection was a quantitative analysis developed through three different stages: 1(pre-survey), 2(focus group), 3(main survey). Both questionnaires were developed in Qualitrics and distributed online which can be a time-saving method, having a bigger speed of response, with lower costs associated and that through its flexibility and convenience would allow reaching a greater number of respondents. (Duffy & Smith, 2005; Evans, Evans, & Mathur, 2005). Moreover, all participants were provided with a brief description of the research, followed by a pre-survey of questions 19 and a survey of 24, since an advantage can be privacy and insecurity problems (Evans et al., 2005). A focus group was also developed between these two surveys, to gather information about the consumer's perspectives of MP concepts.
3.3.1 Data Collection
3.3.1.1 Target Population and Sampling
The target populations were men and women, between 18-54 years old, with a worldwide nationality. The main purpose was targeting individuals that frequently shop online to avoid a lack of knowledge regarding online shopping. Accordingly, with Forbes, Millennials, also known as Generation Y, were born between 1982 and 1996, which means 24 to 38 years old nowadays, are the population that spends more online, almost $600 billion annually, which represents almost 30% of their daily spending. (Kestenbaum,2017) . The mainly target population on the research was defined in order to ensure sufficient knowledge and experience regarding online shopping. However, 24% of online shoppers are still between the ages of 45 to 54, on the other side, baby boomers between 18-24 years old are also increasing significantly their online shops. ( Smith, 2015). With that being said, our final target age is between 18-54 years old, to include a wide range of the population that is contributing to the online shopping trend.
A non-probability was the sampling technique selected regarding resource and time constraints. This method relies on participants' availability and convenience (Creswell, 2009), however, it presents several limitations regarding the generalizability of the sample to the general population. Nonetheless, it is considered a reasonable method when researches are facing time constraints. (Saunders et al., 2008)
3.3.1.2 Pre-Survey
A pre-survey was developed in order to understand, the perceptions of the soft benefits of consumers regarding different brands. The main goal was to choose one brand to be tested in the main survey: the company with the highest values of the variables: gratitude, status, perceived value. The purpose was choosing a brand that consumers frequently have in mind when it comes to online shopping to prevent the misleading of focusing on a company that is not related to online shopping and soft benefits. Thus, providing interest and relevance for the respondents as well as accruable answers for the results of the overall research.
The pre-survey with 19 questions ( appendix 1) was shared between 12 days through social media platforms and mailing. For the pre-survey, it was estimated a total of 25-35 answers, to represent 10-20% of the main survey sample.
The brands chosen to be included in the pre-survey were: Amazon, Media Market, ZARA and El Corte Inglés. These brands were chosen for being considered part of the biggest companies on e-commerce by different journals and articles, additionally, the fact of a) being companies with a significant impact and increase on online shopping b) companies that could benefit from having a membership program. Additionally, in order to not restrict any industry category, these four different companies represented different categories: electronic, home, kitchen and fashion. Amazon is an online retailer that has been having a huge impact on online shopping with a 16% growth year-over-year (YOY) and with almost 10Mmembers on its Prime membership program ( Keyes, 2019). Media Market has a growth of almost 16% YOY and has generated approximately around $960M in 2018 ( Statista, 2019) ZARA is the biggest fashion industry e-commerce, the online sales of the company represent approximately 12% of Inditex’s total business (Bain, 2019). El Corte Inglés has an online presence with a value of $619.6M in 2019 (ecommerceDB, 2019) and has been heavily investing in digital, signing a €210M agreement to boost the company’s digital platform on 2019 ( European Investment Banking, 2019).
The pre-survey included in the first phase, two questions regarding the four companies. Following these two questions, it was already identified which brand the participant had more contact on online shopping, therefore the next 13 questions were carried forward choices presented regarding one brand only. The pre-survey collected 30 valid responses and this data was analyzed through the Qualitrics report. The results show that 56,7% of consumers are more willing to shop at Amazon, while 33,3% have chosen Zara and only 10% choose El Corte Inglés. Amazon has shown more positive results regarding the feelings of status, gratitude and perceived value than the other 3 brands, with the participant's answers, mostly between “agree” and “somewhat agree”. Therefore, the pre-survey has proofed Amazon to be the most valid company to be tested in the main survey.
3.3.1.3 Focus Group
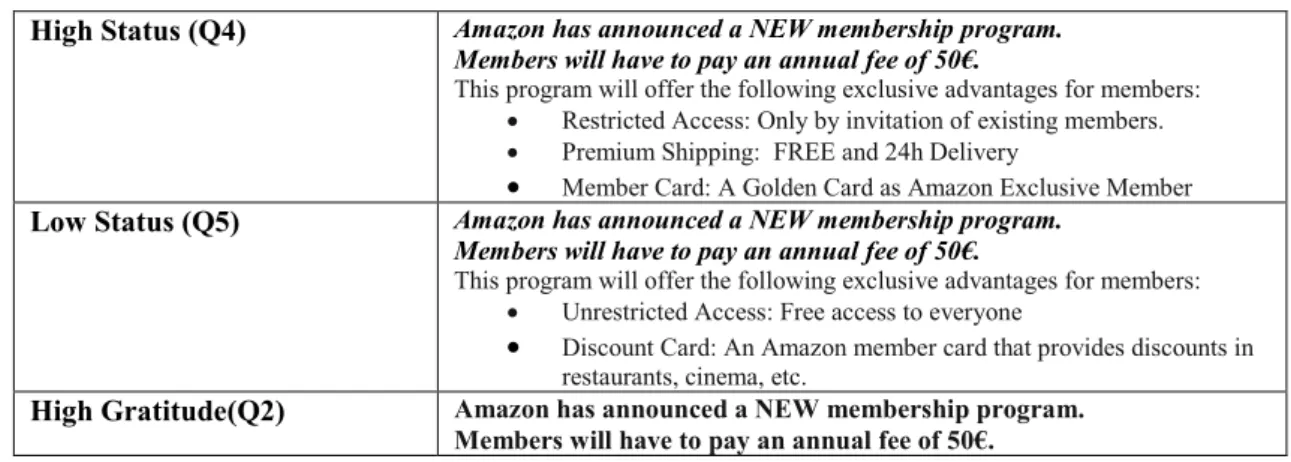
As previously mentioned, after the pre-survey, a focus group was developed to gather information about consumers' perspectives, ideas and opinions about the concept of the membership program and consequently their relationship with the different variables: gratitude, status, perceived value, high price, low price. The focus group was previously prepared with a guideline containing different questions ( appendix 2). During a one hour session, the 10 participants in the target age between 18-65, were asked 8 different questions and were conducted by a moderator through an answer model: firstly respondents had to reflect about the question asked during 2-3 minutes, then on random choice participants were asked one by one to share their opinion and thirdly to engage in a group discussion where the group needed to select 1-2 points they as the most and less important to each specific question. Open and free discussions help researches to identify realistic perceptions and can provide accruable information for the research itself (Lotich, P., 2011). The results have allowed a fundamental development of 6 different stimulus, that are presented in the followed table.
Table 3- Stimuli
High Status (Q4) Amazon has announced a NEW membership program. Members will have to pay an annual fee of 50€.
This program will offer the following exclusive advantages for members: Restricted Access: Only by invitation of existing members. Premium Shipping: FREE and 24h Delivery
Member Card: A Golden Card as Amazon Exclusive Member Low Status (Q5) Amazon has announced a NEW membership program.
Members will have to pay an annual fee of 50€.
This program will offer the following exclusive advantages for members: Unrestricted Access: Free access to everyone
Discount Card: An Amazon member card that provides discounts in restaurants, cinema, etc.
High Gratitude(Q2) Amazon has announced a NEW membership program. Members will have to pay an annual fee of 50€.
This program will offer the following exclusive advantages for members: No Ad Experience: Shopping without being interrupted by an
advertisement
Access to specific events and promotions
Low Gratitude (Q3) Amazon has announced a NEW membership program. Members will have to pay an annual fee of 50€.
This program will offer the following exclusive advantages for members: Monthly Communication: Newsletter with key information Receive messages with promotions of all type of categories High Price (Q6) Amazon has announced a NEW membership program.
Members will have to pay an annual fee of 150€.
This program will offer the following exclusive advantages for members: Restricted Access: Only by invitation of existing members. Premium Shipping: FREE and 24h Delivery
Member Card: A Golden Card as Amazon Exclusive Member Low Price (Q7) Amazon has announced a NEW membership program.
Members will have to pay an annual fee of 30€.
This program will offer the following exclusive advantages for members: Restricted Access: Only by invitation of existing members. Premium Shipping: FREE and 24h Delivery
Member Card: A Golden Card as Amazon Exclusive Member Q(x) – This represents the number of the question of each stimuli on the survey. 3.3.1.4 Survey
The research software chosen to develop the online survey was the Qualitrics and it was pre-tested by six individuals in order to guarantee that the questions were clear and understandable. After this, a few questions were modified in guideline with the individual’s recommendations. Between the 4th and 12th of March, the online main survey was distributed through social media ( Facebook, Instagram, Linkedin, personal and professional email, mostly shared through Portuguese and Spanish population. The survey (appendix 3) was composed of 20 questions and divided mainly into four sections. The first section had 3 control questions regarding the participant's knowledge and experience on membership programs in general and specifically on Amazon membership Prime. Following for a block that would randomly present only one of the 6 different stimuli to the participant. The section after the respondent being exposed to the stimuli was composed of gratitude, status, perceived value and purchase intention questions related to that specific type of membership. The survey finishes with demographic questions.
3.3.2 Measurement / Indicators
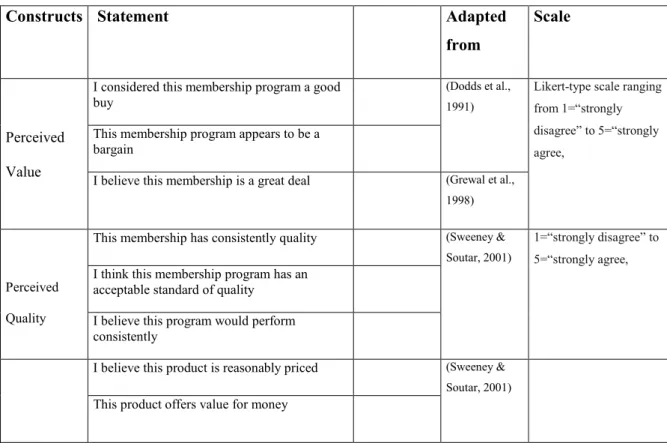
This chapter is going to be presented the key measurement and indicators that were used in order to analyze the constructs. These measurements are all adapted from or developed based on the research that is presented in the literature review. To measure respondents’ perceived value two statements adapted from (Dodds et al., 1991) and one statement adapted from (Grewal et al., 1998) were included in the questionnaire. However, as established in the
literature review, the perceived value is the ratio between perceived quality and perceived price, which must be studied separately. Therefore, the next construct is perceived quality that was analyzed with three statements adapted from (Sweeney & Soutar, 2001). Perceived price was also analyzed through three statements adapted from the authors Jillian and Geoffrey. The deeper and more comprehensive analysis of this study, being tested on a pre and post-purchase situation, was the main cause for it to be chosen as the most reliable to analyze respondents’ answers regarding the constructs. To measure soft benefits three constructs were identified from the article (Steinhoff & Palmatier, 2016): gratitude, status, and unfairness. However, as established in the literature review unfairness is not a reliable construct to study a price-driven membership program since is a product that all costumers can have access through the payout of a joining fee. That is to say, gratitude and status were analyzed in the survey through three statements each. All the above constructs were rated from respondents’ through a Likert-type scale ranging from 1=“strongly disagree” to 5=“strongly agree. Finally, to measure the respondents’ purchase intention it was included in the questionnaire four other statements from (Dodds et al., 1991), two rated through the agreement scale mentioned above and the other two through the Likert-type scale ranging from 1=very unlikely to 5=very likely. All the constructs' measurements are summarized in the table below.
Table 4- Constructs
Constructs Statement Adapted
from
Scale
Perceived Value
I considered this membership program a good buy
(Dodds et al., 1991)
Likert-type scale ranging from 1=“strongly disagree” to 5=“strongly agree,
This membership program appears to be a bargain
I believe this membership is a great deal (Grewal et al.,
1998)
Perceived Quality
This membership has consistently quality (Sweeney &
Soutar, 2001)
1=“strongly disagree” to 5=“strongly agree,
I think this membership program has an acceptable standard of quality
I believe this program would perform consistently
I believe this product is reasonably priced (Sweeney &
Soutar, 2001)
Perceived Price
This is a good product for the price 1=“strongly disagree” to
5=“strongly agree,
Buying this program would be economical
Gratitude
I feel gratefull to [Company]. (Steinhoff & Palmatier,
2016) 1=“strongly disagree” to 5=“strongly agree I feel thankful to [Company].
I feel appreciative to [Company].
Status
[Company] makes me feel privileged. (Steinhoff & Palmatier,
2016) 1=“strongly disagree” to 5=“strongly agree, : [Company] gives me a feeling of high status. .
Relative to the other customers, I experience better treatment at [Company].
Purchase Intention
The likelihood of purchasing this product is. (Dodds et al.,
1991)
Likert-type scale ranging from 1=very unlikely to 5=very likely
If I were going to buy this product, I would consider buying this model at the price indicated.
1=“strongly disagree” to 5=“strongly agree,
The probabilibly that I would consider buying this product is.
1=very unlikely to 5=very likely
My willingness to buy the product is. 1=very unlikely to
5=very likely
3.4 Data Analysis
Data was firstly analyzed through a preliminary stage, where raw data was prepared in order to avoid possible errors of cooperation’s between the variables (Aaker et al., 1995). The raw data collected from the survey was analyzed through SPSS to apply different techniques that allowed to test the hypothesis and reach further conclusions. Firstly, after a careful analysis of the variables it was identified that the Likert-type scale of agreement used in Qualtrics has the invert punctuation normally used in this scale from (1 – Strongly Disagree; 7 – Strongly Agreed). Therefore, the first stage was to transform the data in order to allow this data to be
presented in the correct scale analysis to avoid misleading interpretations when testing the hypothesis. Following a reliability analysis of Cronbach Alpha, applied to validate the
survey scale. Lastly, different statistical tests have been developed both non-parametric and parametric, such as Levene’s, Mann- Whitney, Kruskal–Wallis and Spearman Correlations and Linear and Multiple Regressions.
3.4.1 Reliability of Scales
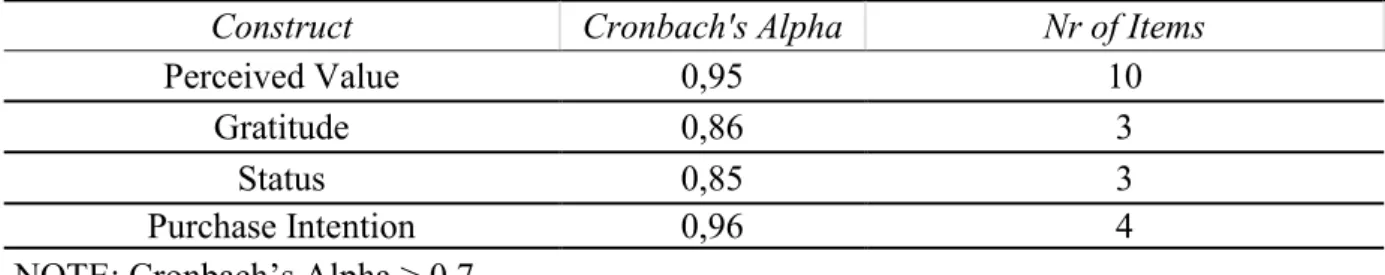
To guarantee reliability and the internal consistency of all the variables previously used it was conducted a Cronbach’s alpha. The results of the reliability test show that all variables have good or excellent reliability since the Cronbach’s Alpha recommends values above 0.7 and any value that exceeds 0.9 is considered excellent. Table 5 below shows Cronbach’s Alpha values > 0.7 for all the variables.
Table 5- Cronbach's Alpha Results
Construct Cronbach's Alpha Nr of Items
Perceived Value 0,95 10
Gratitude 0,86 3
Status 0,85 3
Purchase Intention 0,96 4
NOTE: Cronbach’s Alpha > 0.7
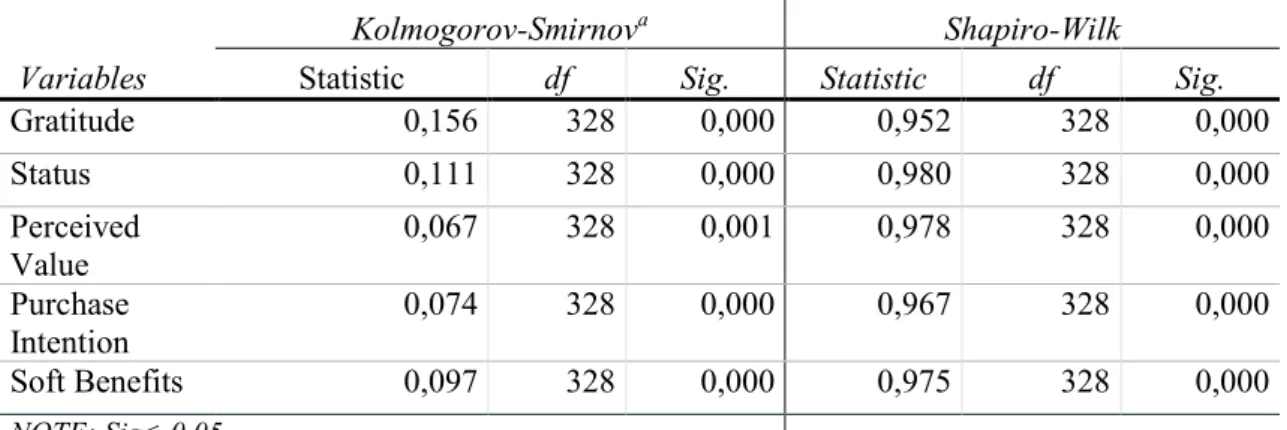
3.4.2 Normality Test
A Normality test was performed before the start of the statistical tests. The goal was to
understand the distribution of the variables, which would allow us to choose the most accurate tests to apply for this research. According to Kolmogorov-Smirnov and Shapiro-Walk, the results show that the variables are not normally distributed (Sig=0.000, <0.05) and therefore the data is considered non-parametric. However, accordingly, with the Central Limit Theorem, it has been proved by statisticians that if the sample size is larger enough (usually >30), it results in a sampling distribution for the mean that will approximate to a normal distribution (Saunders, 2009). Consequently, after confirming that all the group samples of each stimulus are wide enough (48 >), a normal distribution could be assumed when testing assumptions.
Table 6-Normality Test Results
Variables
Kolmogorov-Smirnova Shapiro-Wilk
Statistic df Sig. Statistic df Sig.
Gratitude 0,156 328 0,000 0,952 328 0,000 Status 0,111 328 0,000 0,980 328 0,000 Perceived Value 0,067 328 0,001 0,978 328 0,000 Purchase Intention 0,074 328 0,000 0,967 328 0,000 Soft Benefits 0,097 328 0,000 0,975 328 0,000 NOTE: Sig< 0.05
Table 7-Distribution of cases for incitement
Low Gratitude High Gratitude Low Status High Status High Price Low Price n 55 48 56 54 55 60 Missings 273 280 272 274 273 268
CHAPTER 4: RESULTS AND DISCUSSION 4.1 Results
4.1.1 Sample Characterization
Overall, the main survey has gathered 659 recorded responses, however, only 340 participants finished the survey and were considered valid responses, which means a 51,6% of response rate. From that 340 participants, 12 were considered not valid regarding their age, 11 were above the 54th years old and 1 was below the 18th years. Overall, the survey gathered 328 valid responses.
Regarding socio-demographic factors, the sample was composed mainly of the female public representing 78% of the overall sample, while the male public only represents 22%. Concerning their age, the participants' majority age was between 25 and 34 years old, representing 58% of the total sample, or 18 to 24 years old, 30,5%. That said, we can conclude that approximately 88,5% of the sample were millennials, which is aligned with the goal established in the sample target that most of the population should have an important role in the e-commerce trend. About their professional situation mostly were employed, 73%, or were students, 24%. The respondents’ level of education was particularly high, 48% with a master’s and 32% with a bachelor’s degree. Regarding the yearly income was moderate, 45% stated that their income was above €20K, and only 24,4% get paid less than €20K, 23,2% of participants preferred not to answer. The participants' knowledge about MPs was high, 50% are secure about and 25% are familiar with it, only 25% showed a lack of knowledge or uncertainty about MP it. 51% of the participants were already members of a MP and 49% were not, however, regarding the Amazon Prime membership only 19% of the sample was a member.
4.1.2 Descriptive Statistics
This section provides insights about participants' responses, through the analysis of frequencies, means, and standard deviations. Firstly, it is important to take into consideration that the Kolmogorov-Smirnov test shows that the data is non-parametric, however, following the central limit theorem it can be considered an approximately normal distribution (sample >30) and therefore it could be performed parametric tests since these are considered to be more powerful regarding numerical data (Saunders,2009). Consequently, this indicate that the Independent Samples T-Test (for two groups comparisons) and One-Way ANOVA (for three or more) should be applied if assumptions verify. However, Levene’s tests were performed in order to verify the homogeneity of the variances, and results show no equally of variances, failing this assumption. To overcome this, it was disregarded the central limit theorem and non-parametric
tests were applied, more specifically (1) Mann-Whitney U Test was the alternative to
Independent-Samples T-Test and (2) Kruskal-Wallis H Test for One-Way ANOVA. The assumptions were verified since data was assumed to be not normally distributed, sample was larger enough, the dependent variable was measured with an ordinal level with Likert Scale, Mann Whitney was applied to two groups while Kruskal-Wallis to three or more, the independence of observations since no participant was exposed to more than one stimuli, therefore, these tests could be properly implemented. Since the groups' distributions have different shapes, results will compare mean ranks (Laerd Statistics, 2015).
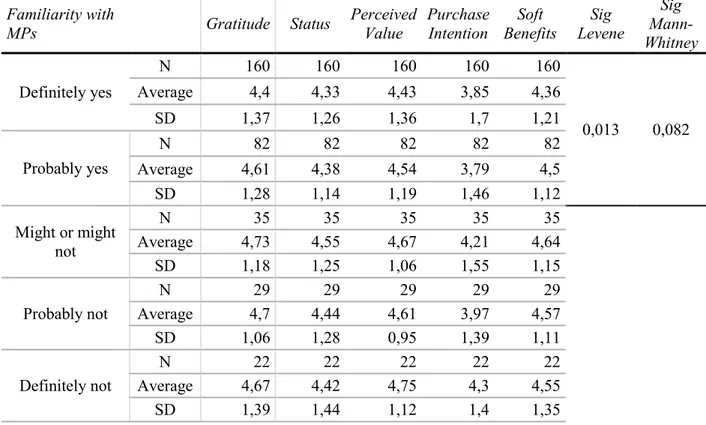
Membership Program Knowledge
Concerning the membership program knowledge: “Are you familiar with the term membership
program?” , Table 8 shows that the groups have significantly different samples between them
(i.e Definitely not (N=22) versus definitely yes (N=160)), therefore only groups with similar samples were tested: definitely yes (N=160) and probably yes(N=82); regarding gratitude, status and soft benefits the averages are similar with values 4.3 ≤ x ≤ 4.7, meaning that overall participants somewhat agree with these feelings, however, it is notable that fewer the knowledge higher the averages on these variables, which also happens with PV. Regarding PI the groups representing a lack of knowledge regarding MPs ( probably not and definitely not) are also the ones with higher averages, 3.97 (SD=1.39); 4.3 (SD=1.4), while groups expressing a higher knowledge about the MPs concept presented an average of 3.79 (SD=1.46 ); 3.85 (SD=1.7), probably yes and definitely yes. Lastly, the Mann Whitney test was performed and the result show there is no statistically significant difference between the groups (Sig= 0.082, >0.05).
Table 8- Membership Programs Knowledge Measures and Statistic Tests Familiarity with MPs Gratitude Status Perceived Value Purchase Intention Soft Benefits Sig Levene Sig Mann-Whitney Definitely yes N 160 160 160 160 160 0,013 0,082 Average 4,4 4,33 4,43 3,85 4,36 SD 1,37 1,26 1,36 1,7 1,21 Probably yes N 82 82 82 82 82 Average 4,61 4,38 4,54 3,79 4,5 SD 1,28 1,14 1,19 1,46 1,12 Might or might not N 35 35 35 35 35 Average 4,73 4,55 4,67 4,21 4,64 SD 1,18 1,25 1,06 1,55 1,15 Probably not N 29 29 29 29 29 Average 4,7 4,44 4,61 3,97 4,57 SD 1,06 1,28 0,95 1,39 1,11 Definitely not N 22 22 22 22 22 Average 4,67 4,42 4,75 4,3 4,55 SD 1,39 1,44 1,12 1,4 1,35
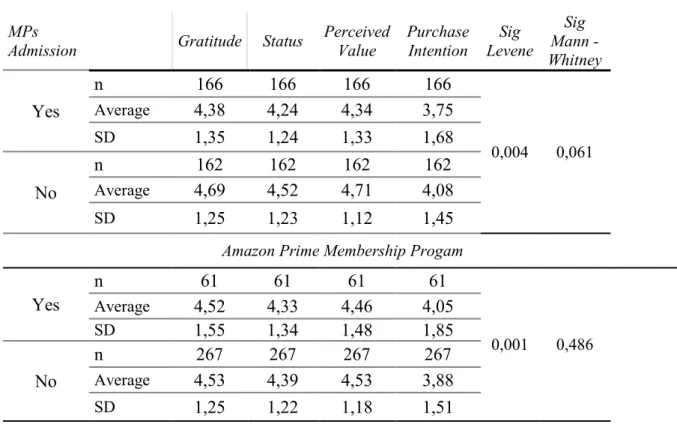
Membership programs admission versus Amazon Prime admission
Regarding membership programs participation: “Are you part of any membership program?”, the averages in terms of gratitude, status, and soft benefits, reached higher values for non-members than non-members, as like as the intention to purchase on non-non-members 4.08 (SD=1.45) was higher than on members 3.75 ( SD= 1.68). Concerning the Mann-Whitney Test (Sig=0.061, >0.05), results show that there is no statistical difference for the distributions of the PI variable between the two groups. On the other side, the participants' admission of Amazon Prime MP -
“Are you part of Amazon Prime membership program?” – behave opposite, purchase intention
has a higher average on members 4.05 (SD=1.85) than non-members 3.88 (SD=1.51). Furthermore, the Mann – Whitney test result show also that there is no statistically significant difference for the distributions of the PI variable between the two groups (Sig=0.061, >0.05).
Table 9 - MPs and Amazon Prime MP Admission
MPs
Admission Gratitude Status
Perceived Value Purchase Intention Sig Levene Sig Mann - Whitney Yes n 166 166 166 166 0,004 0,061 Average 4,38 4,24 4,34 3,75 SD 1,35 1,24 1,33 1,68 No n 162 162 162 162 Average 4,69 4,52 4,71 4,08 SD 1,25 1,23 1,12 1,45
Amazon Prime Membership Progam Yes n 61 61 61 61 0,001 0,486 Average 4,52 4,33 4,46 4,05 SD 1,55 1,34 1,48 1,85 No n 267 267 267 267 Average 4,53 4,39 4,53 3,88 SD 1,25 1,22 1,18 1,51 Gender
When it comes to analyzing Gender relationship with the independent variables, female participants show a higher average on gratitude, status, and soft benefits, correspondently 4.55 (SD=1.3) ;4.38 (SD=1.24); 4.47( SD= 1.18) than male. Also, on PV we can notice this trend 4,57 (SD= 1,2) versus a male average of 4.34 (SD=1.37). Additionally, the female group shows a higher purchase intention average of 3.98 (SD=1.54) versus male 3.69 (SD=1.69). Lastly, the Mann – Whitney Test shows a (Sig=0.142, >0.05), meaning that there is no statistically significant between the two groups.
Table 10- Gender
Gender Gratitude Status Perceived Value Purchase Intention Benefits Soft Levene Sig Sig Mann - Whitney Male N 73 73 73 73 73 0,001 0,142 Average 4,48 4,36 4,34 3,69 4,42 SD 1,32 1,24 1,37 1,69 1,18 Female N 255 255 255 255 255 Average 4,55 4,38 4,57 3,98 4,47 SD 1,3 1,24 1,2 1,54 1,18
Age Group
Regarding the age group, the most representative groups were between 18 and 34 years old, representing 88,5% of the total sample, having a higher weight on the following tests. Firstly, we can conclude that the average of gratitude, status, and soft benefits have similar values on younger ages as 18-24 and 25-34 years old with values 4.4 ≤x≤ 4.57, versus lower values for older groups ages with 4.07 ≤x≤ 4.3. Regarding the PV averages, it can be noticed that all groups have similar values. Concerning, the Kruskal-Wallis test shows that there is no statistical difference between the groups either( Sig=0.818, >0.05).
Table 11- Age
Age Gratitude Status Perceived Value Purchase Intention Soft Benefits Sig Kruskal-Wallis 18 – 24 years old n 100 100 100 100 100 0,818 Average 4,57 4,4 4,6 3,88 4,49 SD 1,3 1,2 1,16 1,45 1,15 25-34 years old n 191 191 191 191 191 Average 4,6 4,43 4,51 3,99 4,51 SD 1,29 1,25 1,27 1,64 1,18 35-44 years old n 16 16 16 16 16 Average 4,04 4,1 4,5 3,94 4,07 SD 1,41 1,48 1,12 1,67 1,39 45- 54years old n 9 9 9 9 9 Average 4,3 4,07 4,57 3,58 4,19 SD 1,07 0,78 1,35 1,15 0,91 Education Level
Analyzing the measures of Education Level is notable that the samples of each group are significantly different, therefore it was decided to analyze and compare only groups with similar samples leaving apart less than a high school and doctorate groups. From the measures we can conclude that a lower level of education, less than a high school diploma or high school degree, have higher feelings of soft benefits ( 4.38≤x≤5.13) than higher levels of education as
bachelors’ and masters’ degree ( 4.19≤x≤4.16). Finally, the Kruskal-Wallis test shows that
Table 12- Education level
Age Gratitude Stat
us Perceived Value Purchase Intention Soft Benefits Sig Levene Sig Kruskal-Wallis High school or equivalent n 39 39 39 39 39 Average 4,86 4,63 4,83 4,38 4,75 SD 1,26 1,28 1,17 1,43 1,2 Some college, no degree n 17 17 17 17 17 0,024 0,069 Average 5,12 4,69 5,03 4,38 4,9 SD 1,14 1 1,19 1,51 0,85 Bachelor’s degree n 105 105 105 105 105 Average 4,37 4,19 4,34 3,69 4,28 SD 1,25 1,2 1,13 1,44 1,15 Master’s degree n 158 158 158 158 158 Average 4,46 4,38 4,48 3,83 4,42 SD 1,36 1,26 1,31 1,67 1,21
4.1.3 Results from the Hypothesis Test
Through this section, the proposed hypothesis will be tested to reach conclusions that will allow answering the research questions. The non-parametric test of Spearman Correlations was performed to measure the degrees of correlations since most of the variables are measured on
an ordinal scale. To test the hypothesis, regarding time consuming and complexity for
non-parametric tests for linear regressions and relying on Saunders belief that non-parametric tests are considered to be more powerful regarding numerical data (Saunders,2009), a Linear and Multiple Linear Regressions were performed. Linear regressions established on one dependent and independent variable; Multiple Linear Regressions performed on a DV using more than one IV. The normal distribution of data was assumed this time regarding the central limit theorem, as explained before, independence of observations verified, there is homoscedastic across data (scatterplots), and are approximately symmetric (Appendix 8), and there are no multicollinearity effects since the variables included have a moderate correlation.
Spearman Correlations
In order to evaluate the relationships of the different ordinal variables studied in this research, a Spearman correlation was tested with the main goal of understanding the strength and direction (positive, null or negative) between the variables. Results from the Spearman correlation test show that overall the correlation between the variables is positive between 0.532≤x≤0.916, meaning that all variables are correlated and have a positive direction on purchase intention. One can conclude that status and gratitude overall have a positive and