EUROPEAN ORGANIZATION FOR NUCLEAR RESEARCH (CERN)
CERN-PH-EP/2012-348 2013/06/07
CMS-SUS-12-010
Search for supersymmetry in pp collisions at
√
s
=
7 TeV in
events with a single lepton, jets, and missing transverse
momentum
The CMS Collaboration
∗Abstract
Results are reported from a search for new physics processes in events containing a single isolated high-transverse-momentum lepton (electron or muon), energetic jets, and large missing transverse momentum. The analysis is based on a 4.98 fb−1 sam-ple of proton-proton collisions at a center-of-mass energy of 7 TeV, obtained with the CMS detector at the LHC. Three separate background estimation methods, each rely-ing primarily on control samples in the data, are applied to a range of signal regions, providing complementary approaches for estimating the background yields. The ob-served yields are consistent with the predicted standard model backgrounds. The results are interpreted in terms of limits on the parameter space for the constrained minimal supersymmetric extension of the standard model, as well as on cross sec-tions for simplified models, which provide a generic description of the production and decay of new particles in specific, topology based final states.
Submitted to the European Physical Journal C
c
2013 CERN for the benefit of the CMS Collaboration. CC-BY-3.0 license
∗See Appendix A for the list of collaboration members
1
1
Introduction
This paper reports results from an updated and improved search for new physics processes in proton-proton collisions at a center-of-mass energy of 7 TeV, focusing on the signature with a single isolated lepton (electron or muon), multiple energetic jets, and large missing momentum transverse to the beam direction (E/ ). The data sample was collected by the Compact MuonT
Solenoid (CMS) experiment during 2011 at the Large Hadron Collider (LHC) and corresponds to an integrated luminosity of 4.98 fb−1, roughly one hundred times larger than the sample used for our previous search [1].
The lepton + jets + E/ signature is prominent in models based on supersymmetry (SUSY) [2–T
7]. In R-parity-conserving models [8], SUSY particles are produced in pairs, and their decay chains end with the lightest supersymmetric particle (LSP). In some scenarios, the LSP is a neutralino (χe
0), a heavy, electrically neutral, weakly interacting particle with the properties of
a dark-matter candidate [9]. The presence of two such LSPs in each SUSY event typically leads to a large missing transverse momentum, depending on the details of the SUSY mass spectrum. The isolated lepton indicates a weak decay of a heavy particle, such as a W boson or a chargino (χe
±). Multiple jets can be produced in complex decay chains of SUSY particles. This signature
arises in many SUSY models, including the constrained minimal supersymmetric extension of the standard model (CMSSM) [10, 11], and in simplified models [12–15], which are based on simplified mass spectra and decays of new particles. Both of these frameworks are used to interpret the results. Searches in this or similar channels have been reported by CMS [1, 16] and ATLAS [17–19].
Searches for SUSY particles are complicated by the presence of standard model (SM) back-grounds that can share many of the features of signal events. In the single-lepton final state, backgrounds arise primarily from the production of tt and W+jets events, with smaller contri-butions from Z+jets, single-top quark production, and QCD multijet events. In the event topol-ogy studied here, a large observed value of E/ in a standard model event is usually genuine,T
resulting from the production of one or more high-momentum neutrinos. A smaller contri-bution to events in the high-E/ tail in this search can arise from the mismeasurement of jetsT
in high cross section processes such as QCD multijet events. To determine the contributions from these backgrounds, we use methods that are primarily based on control samples in data, sometimes in conjunction with specific information from simulated event samples or from ad-ditional measurements that provide constraints on the background processes.
Three complementary methods are used to analyze the data, providing valuable cross-checks and probing different signal regions. The Lepton Spectrum (LS) method was used in the CMS single-lepton [1] and opposite-sign dilepton [20] SUSY searches performed using the 2010 data sample. It uses the observed lepton transverse momentum (pT) spectrum and other control
samples to predict the E/ distribution associated with the dominant SM backgrounds. ThisT
method is sensitive to SUSY models in which the E/ distribution is decoupled from the leptonT
pT spectrum, as is the case when two undetected LSPs produce a large missing transverse
mo-mentum. The Lepton-Projection Variable (LP) method uses the LPvariable, which was developed
for the CMS measurement of the W polarization in W+jets events [21]. This variable, described in Section 6, is correlated with the helicity angle of the lepton in the W-boson rest frame. Both the LPand the LS methods take advantage of well-understood properties of the W polarization
in tt and W+jets events for the background determination. The methods are complementary in that they rely on significantly different approaches to determining the backgrounds, based on different kinematic variables and different signal regions. The ANN method uses an artificial neural network discriminant built from several kinematic quantities. The ANN discriminant is
then used in conjunction with E/ to define signal and sideband regions, from which the back-T
ground yield is determined. A key variable in the ANN is MT, an approximate invariant mass
of the system comprising the lepton and the E/ , computed with the momentum componentsT
transverse to the beam direction. Background events usually have MT < M(W), where M(W)
is the W boson mass, because the observed E/ is associated with the neutrino from WT → `¯ν
decay.
This paper is organized as follows. Sections 2 and 3 describe the CMS detector and the event samples. The event preselection requirements that are common to all methods are discussed in Section 4. Sections 5, 6, and 7 describe the LS, LP, and ANN methods, respectively, for
obtain-ing SM background estimates from control samples in data. The observed yields in data are compared with the background estimate obtained for each method. Systematic uncertainties are described in Section 8. Finally, the results, interpretation, and conclusions of the analysis are presented in Sections 9 and 10.
2
The CMS detector
The CMS detector, described in detail in Ref. [22], is a multipurpose apparatus designed to study high-pT physics processes in proton-proton collisions, as well as a broad range of
phe-nomena in heavy-ion collisions. The central element of CMS is a 3.8 T superconducting solenoid, 13 m in length and 6 m in diameter. Within the magnet are (in order of increasing distance from the beam pipe) high-precision silicon pixel and silicon strip detectors for charged particle tracking; a lead-tungstate crystal electromagnetic calorimeter for measurements of photons, electrons, and the electromagnetic component of jets; and a hadron calorimeter, constructed from scintillating tiles and brass absorbers, for jet energy measurements. Beyond the magnet is the muon system, comprising drift tube, cathode strip, and resistive-plate detectors interleaved with steel absorbers. Most of the detector systems are divided into subsystems that cover the central (barrel) and forward (endcap) regions. The first level of the CMS trigger consists of cus-tom hardware processors that use information from the calorimeter and the muon system to select up to 100 kHz of the most interesting events. These events are then analyzed in the High Level Trigger (HLT) processor farm, which uses information from all CMS detector systems to reduce the event rate to about 300 Hz.
In describing the angular distribution of particles and the acceptance of the detector, we fre-quently make use of the pseudorapidity, η = −ln[tan(θ/2)], where the polar angle θ of the particle’s momentum vector is measured with respect to the z axis of the CMS coordinate sys-tem. The z axis points along the direction of the counterclockwise-moving proton beam; the azimuthal angle φ is measured in a plane perpendicular to this axis. The separation between two momentum vectors in η-φ space is characterized by the quantity∆R = p(∆η)2+ (∆φ)2,
which is approximately invariant under Lorentz boosts along the z axis.
3
Data and simulated event samples
The data samples used in the analysis were selected using triggers based on E/ , lepton pT T, and
the transverse momenta (pjT) of the observed jets j. The overall level of jet activity was mea-sured with the quantity HTtrigger = ∑jpTj, the scalar sum of jet transverse momenta satisfying pTj > 40 GeV. The missing transverse momentum E/Ttrigger was computed in the trigger
us-ing particle-flow algorithms [23, 24]. To maintain an acceptable trigger rate, the thresholds on E/Ttrigger, lepton pT, and HTtrigger, were raised as the LHC luminosity increased over the course of
3
the data collection period. The highest thresholds applied in the muon trigger selection were E/Ttrigger > 50 GeV, muon pT > 15 GeV, and HTtrigger> 300 GeV. For electron triggers, the
high-est thresholds applied were E/Ttrigger > 50 GeV, electron pT > 15 GeV and HTtrigger > 250 GeV;
a loose electron isolation requirement was also applied to help control the rate. The offline analysis requirements for both muon and electron events are more restrictive than those used in the trigger.
The analysis procedures are designed using simulated event samples. Except for certain scans of the SUSY parameter space discussed later, the detector simulation is performed using the GEANT4 package [25]. A variety of Monte Carlo (MC) event generators are used to model the backgrounds. The QCD multijet samples are generated with the PYTHIA 6.4.22 [26] MC gen-erator with tune Z2 [27]. The dominant background, tt, is studied with a sample generated using MADGRAPH5.1.1.0 [28]. The W+jets and Z+jets processes are also simulated with MAD -GRAPH. Single-top (s-channel, t-channel, and tW) production is simulated withPOWHEG[29]. To model the effect of multiple pp interactions per beam crossing (pileup), simulated events are generated with a nominal distribution of multiple vertices, then reweighted to match the distribution of the number of collision vertices per bunch crossing as measured in data.
Event samples for SUSY benchmark models are generated withPYTHIA. As example CMSSM scenarios, we use LM3 and LM6, which are among the standard benchmarks [30] used in CMS. The CMSSM benchmarks are described by the universal scalar mass parameter m0, the
univer-sal gaugino mass parameter m1/2, the universal trilinear soft-SUSY-breaking parameter A0, the
ratio of the two Higgs-doublet vacuum expectation values tan β, and the sign of the Higgs mixing parameter µ. The LM3 (LM6) benchmark is described by m0 = 330 GeV (85 GeV),
m1/2 = 240 GeV (400 GeV), A0 = 0 GeV (0 GeV), tan β = 20 (10), and µ > 0(0). For LM3, the
masses of the gluino and squarks are very similar (≈600 GeV), except for m(et) ≈440 GeV, while the mass of the LSP is m(χe
0
1) = 94 GeV. The LM6 spectrum is heavier, with m(eg) ≈ 930 GeV, m(eq) ≈ 800 GeV, m(et) ≈ 650 GeV, and m(χe
0
1) ≈ 160 GeV. The next-to-leading-order (NLO)
cross sections for these models are approximately 4.8 pb (LM3), and 0.4 pb (LM6).
The ANN method uses the LM0 model [30] to train the neural network. Because of its large cross section (54.9 pb at NLO), LM0 has already been excluded [1], but its kinematic distribu-tions still provide a reasonably generic description of SUSY behavior with respect to the vari-ables used in the neural network. The parameters for LM0 are m0=200 GeV, m1/2 =160 GeV,
A0 = −400 GeV, tan β=10, and µ>0.
The results are interpreted in two ways: (i) as constraints on CMSSM parameter space and (ii) as constraints on cross sections for event topologies described in the framework of simplified models. In both cases, a large number of simulated event samples are required to scan over the relevant space of model parameters. For this reason, the scans are performed with the CMS fast simulation package [31], which reduces the time associated with the detector simulation. Both the LS and LP background determination methods rely on knowledge of the W-boson
polarization in W+jets and in tt events. The polarization effects are well modeled in simu-lated event samples, which are used in conjunction with control samples in data. The angular distribution of the (positively) charged lepton in the W+rest frame can be written as:
dN d cos θ`∗ = f+1 3 8(1+cos θ ∗ `)2+ f−1 3 8(1−cos θ ∗ `)2+ f0 3 4sin 2 θ`∗, (1) where f+1, f−1, and f0denote the polarization fractions associated with the W-boson helicities
+1, −1, and 0, respectively. The angle θ`∗ is the polar angle of the charged lepton in the W+ rest frame, measured with respect to a z axis that is aligned with the momentum direction of
the W+ in the top-quark rest frame. The polarization fractions thus determine the angular distribution of the lepton in the W rest frame and, together with the Lorentz boosts, control the pT distributions of the lepton and the neutrino in the laboratory frame.
The W polarization fractions in top-quark decays have been calculated [32] with QCD cor-rections to next-to-next-to-leading order (NNLO), and the polarization is predominantly lon-gitudinal. For t→ bW+ these fractions are f0 = 0.687±0.005, f−1 = 0.311±0.005, and
f+1 = 0.0017±0.0001. These precise calculations reduce the uncertainties associated with
the W polarization in tt events to a low level. The theoretical values are consistent with mea-surements from ATLAS [33], which obtained f0 = 0.67±0.03±0.06, f−1 = 0.32±0.02±0.03,
and f+1 =0.01±0.01±0.04, expressed for the W+polarizations.
The W polarization in W+jets events exhibits a more complex behavior than that in tt produc-tion. Both CMS [21] and ATLAS [34] have reported measurements of these effects, which are consistent withALPGEN[35] and MADGRAPH[28] simulations predicting that the W+and W− bosons are both predominantly left-handed in W+jets events at high pT. An NLO QCD
calcu-lation [36] has demonstrated that the predicted polarization fractions are stable with respect to QCD corrections. As discussed in later sections, this detailed knowledge of the W-boson polar-ization provides key information for measuring the SM backgrounds using control samples in data.
4
Event preselection
Table 1 summarizes the main variables and requirements used in the event preselection, which is designed to be simple and robust. Except where noted, a common set of preselection require-ments is used by each of the three analysis methods. Events are required to have at least one good reconstructed primary vertex, at least three jets (LP method and ANN method) or four
jets (LS method), and exactly one isolated muon or exactly one isolated electron. These basic requirements select an event sample that is dominated by genuine, single-lepton events from SM processes.
The primary vertex must satisfy a set of quality requirements, including |zPV| < 24 cm and ρPV < 2 cm, where zPV and ρPV are the longitudinal and transverse distances of the primary
vertex with respect to the nominal interaction point in the CMS detector.
Jets are reconstructed offline using the anti-kTclustering algorithm [37] with a distance
param-eter of 0.5. The particle four-vectors reconstructed by the CMS particle-flow algorithm [23, 24], are used as inputs to the jet clustering algorithm. The particle-flow algorithm combines in-formation from all CMS sub-detectors to provide a complete list of long-lived particles in the event. Corrections based on simulation are applied to the jet energies to establish a uniform response across the detector and a first approximation to the absolute energy scale [38]. Addi-tional jet energy corrections are applied to the data using measurements of energy balance in dijet and photon + jet control samples in data. These additional corrections take into account residual differences between the jet energy scale in data and simulation. The effect of pileup was significant during much of the data-taking period. Extra energy clustered into jets due to pileup is taken into account with an event-by-event correction to the jet momentum four-vectors. Jet candidates are required to satisfy quality criteria that suppress noise and spurious energy deposits in the calorimeters. The performance of jet reconstruction and the corrections are described in Ref. [38]. In this analysis, reconstructed jets are required to satisfy pT>40 GeV
and |η| < 2.4. The E/ vector is defined as the negative of the vector sum of the transverseT
5
Table 1: Main preselection requirements. The term lepton designates either an electron or a muon. Definitions of the quantities and further details are given in the text.
Quantity Requirement
Primary vertex position ρPV<2 cm,|zPV| <24 cm
Jet pTthreshold >40 GeV
Jet η range |η| <2.4
Number of jets ≥3 (LP and ANN methods),
≥4 (LS method) Lepton pT threshold >20 GeV
Muon η range |η| <2.1 Muon isolation (relative) <0.10
Electron η range |η| <1.442, 1.56< |η| <2.4 Electron isolation (relative) <0.07 (barrel)
<0.06 (endcaps) Lepton pT thresh. for veto >15 GeV
In the muon channel, the preselection requires a single muon candidate [39] satisfying pT(µ) > 20 GeV and|η| < 2.1. Several requirements are imposed on the elements that form the muon candidate. The reconstructed track must satisfy quality criteria related to the number of hits in the pixel, strip, and muon detectors, and it must have an impact parameter d0in the transverse
plane with respect to the beam spot satisfying|d0| <0.02 cm and an impact parameter dzwith
respect to the primary vertex along the z direction satisfying|dz| <1.0 cm.
To suppress background in which the muon originates from a semileptonic decay of a hadron containing a bottom or charm quark, we require that the muon candidate be spatially isolated from other energy in the event. A cone of size ∆R = 0.3 is constructed around the initial muon momentum direction in η-φ space. The muon combined isolation variable, Icomb = ∑∆R<0.3(ET+pT), is defined as the sum of the transverse energy ET (as measured in the
elec-tromagnetic and hadron calorimeters) and the transverse momentum pT (as measured in the
silicon tracker) of all reconstructed objects within this cone, excluding the muon. This quan-tity is used to compute the combined isolation relative to the muon transverse momentum, Irelcomb = Icomb/pT(µ), which is required to satisfy Irelcomb <0.1.
Electron candidates [40] are reconstructed by matching energy clusters in the ECAL with tracks in the silicon tracking system. Candidates must satisfy pT > 20 GeV and |η| < 2.4, excluding the barrel-endcap transition region (1.442< |η| < 1.56). Quality and photon-conversion rejec-tion requirements are also imposed. The relative isolarejec-tion variable, defined in a manner similar to that in the muon channel, must satisfy Irelcomb < 0.07 in the barrel region and Irelcomb < 0.06 in the endcaps. The requirements on d0and dz are the same as those used in the muon channel.
The preselection requirements have a large effect on the sample composition. The lepton isola-tion requirement is critical for the rejecisola-tion of QCD multijet processes, which have very large cross sections but are reduced to a low level by the isolation and the other preselection require-ments. While many lepton candidates are produced in the semileptonic decays of hadrons containing b or c quarks, from π and K decays in flight, and from misidentification of hadrons, the vast majority of these candidates are either within or near hadronic jets. The background from W+jets events (primarily from W → eν or W → µν, but also W → τν) is initially also very large. This contribution is heavily suppressed by the three- or four-jet requirement. De-pending on the particular signal region, either tt or W+jets production emerges as the largest contribution to the background in the sample of events with moderate to large E/ .T
Events with a second isolated-lepton candidate satisfying the criteria listed in Table 1 are ve-toed. This requirement not only suppresses SM background, but also minimizes the statistical overlap between the event sample used in this search and those used in multilepton searches. However, tt events with dileptons can still be present, and this contribution must be deter-mined, particularly because the presence of two neutrinos in the decay chains can result in large values of E/ . The background involving WT → τνdecays, both from tt events and from
direct W production, must also be determined. To help suppress the dilepton background, the requirements on the veto leptons are somewhat looser than those on the signal lepton. For both muons and electrons, the pTthreshold is pT >15 GeV, the isolation requirement is Irelcomb <0.15,
and the impact parameter requirement is|d0| <0.1 cm (the dzrequirement is kept the same as for the signal lepton). In addition, some of the quality requirements for both the muon and electron are loosened.
Further event selection requirements are used in the individual background estimation meth-ods described in Sections 5, 6, and 7. The methmeth-ods use the quantity HT, which is defined as the
scalar sum of the transverse momenta of particle-flow jets j with pjT>40 GeV and|ηj| <2.4,
HT =
∑
jpTj. (2)
The three background determination methods presented in the following three sections use different approaches to estimating the SM backgrounds using control samples in data. In Sec-tion 9, we compare the results of the different methods and make some observaSec-tions about their features.
5
Lepton Spectrum method
5.1 Overview of the Lepton Spectrum method
This section describes the Lepton Spectrum (LS) method, which is named for the technique used to determine the dominant background source: genuine, single-lepton processes. Such processes account for about 75% of the total SM background in the signal regions and arise primarily from tt, single-top, and W+jets events. Their contribution to the E/ distribution isT
estimated by exploiting the fact that, when the lepton is produced in W-boson decay, the E/T
distribution is fundamentally related to the lepton pT spectrum, unlike the E/ for many SUSYT
models. A more detailed description of the Lepton Spectrum method is given in the refer-ences [1, 41].
Non-single-lepton backgrounds are also determined using control samples in the data. Such events arise mainly from (i) tt dilepton events, in which zero, one, or both of the leptons is a τ and (ii) tt and W+jets events with a single τ → (µ, e)decay. Background from QCD mul-tijet events is expected from simulation to be very small. However, the uncertainties in such simulations are difficult to quantify, because the QCD multijet background in the phase space relevant to this analysis arises from extreme tails of processes with very large cross sections. We therefore use control samples in data to measure the QCD multijet background. Simulated event samples are used for the determination of the Z+jets contribution, which is estimated with sufficient precision to be below one event for most of the signal regions.
The signal regions are defined with three thresholds in HT(HT ≥500 GeV, HT ≥750 GeV, and
HT ≥ 1000 GeV) and four bins in E/ (250T ≤ E/T < 350 GeV, 350 ≤ E/T < 450 GeV, 450 ≤ E/T <
5.2 Estimation of single-lepton backgrounds 7 0 100 200 300 400 500 600 700 0 100 200 300 400 500 600 700 10–5 10–4 10–3 10–2 10–1 1 CMS Simulation √s = 7 TeV PT (µ ) [GeV]
Events / bin (arbit. units)
tt and W+jets Ɇ [GeV]T 0 100 200 300 400 500 600 700 0 100 200 300 400 500 600 700 10–5 10–4 10–3 10–2 10–1 1 CMS Simulation SUSY LM6 √s = 7 TeV PT (µ ) [GeV]
Events / bin (arbit. units)
Ɇ [GeV]T
Figure 1: Distributions of muon pT vs. E/ in the µ channel for simulated tt and W+jets eventsT
(left) and for the LM6 SUSY benchmark model (right).
5.2 Estimation of single-lepton backgrounds
The physical foundation of the Lepton Spectrum method is that, when the lepton and neutrino are produced together in two-body W decay (either in tt or in W+jets events), the lepton pT
spectrum is directly related to the E/ spectrum. The lepton and the neutrino share a commonT
Lorentz boost from the W rest frame to the laboratory frame. As a consequence, the lepton spec-trum reflects the pTdistribution of the W, regardless of whether the lepton was produced in a
top-quark decay or in a W+jets event. With suitable corrections, discussed below, the lepton pT
spectrum can therefore be used to predict the E/ spectrum for SM single-lepton backgrounds.T
The E/ distribution in many SUSY models is dominated by the presence of two LSPs. In con-T
trast to the SM backgrounds, the E/ and lepton pT Tdistributions in SUSY processes are therefore
nearly decoupled. The E/ distribution for such models extends to far higher values than theT
lepton spectrum. Figure 1 shows the relationship between the lepton-pT and E/ distributionsT
in the laboratory frame for two simulated event samples: (i) the predicted SM mixture of tt and W+jets events and (ii) the SUSY LM6 benchmark model. When taken from data, the upper-left region in Fig. 1 (left) provides the key control sample of high-pT leptons from SM processes.
This region typically has very little contamination from SUSY events, which populate the high-E/ region but have relatively low lepton pT Tvalues.
The lepton pT spectrum is measured with a muon control sample defined by the preselection
criteria and the HT requirements. Unlike the signal region, no E/ requirement is applied, be-T
cause even a modest one (E/T > 25 GeV) would bias the high end of the lepton pT spectrum,
which is critical for making the background prediction. Only muon events are used as a con-trol sample, because the QCD multijet background is significant in the low-E/ region of theT
electron sample. The number of events that are common to both the control sample and the signal region is small. For example, the overlap as measured in simulated tt events is 3.6% for HT ≥ 750 GeV, E/T ≥ 250 GeV, and pT ≥ 250 GeV. Because no E/ requirement is placed onT
the muon control sample, a small amount of QCD background remains and must be measured and subtracted. The scaling from the muon to the electron samples is obtained by fitting their ratio in the data over the range 60≤ E/T ≤250 GeV, with systematic uncertainties evaluated by
varying the fit range. The resulting correction factor is N(e)/N(µ) =0.88±0.03±0.03, where the uncertainties are statistical and systematic, respectively.
To use the lepton spectrum to predict the E/ spectrum in single-lepton SM background pro-T
cesses, three main issues must be understood: (i) the effect of the W-boson polarization in both tt and W+jets events, (ii) the effect of the applied lepton pT threshold, and (iii) the difference
between the experimental resolutions on the measurements of lepton pT and E/ .T
The status of theoretical and experimental knowledge of W-boson polarization in tt and in W+jets events is discussed in Section 3. The helicity zero polarization state results in a forward-backward symmetric angular distribution of the lepton and the neutrino in the W rest frame (with respect to the W momentum direction), leading to identical lepton and neutrino spectra in the laboratory frame. In contrast, the helicity±1 states result in angular asymmetries that lead to somewhat different lepton and neutrino pTspectra in the laboratory frame. These effects are
taken into account by applying correction factors obtained from simulation to the measured lepton spectrum, with uncertainties as described in Section 8.
The second key issue in the Lepton Spectrum method is the effect of the threshold (pT >
20 GeV) applied to the leptons in both the signal and control samples. Because of the anti-correlation between the lepton pTand the E/ arising from non-zero W-boson helicity states, theT
threshold requirement removes SM background events in the high-E/ signal region but not theT
events in the control sample with high-pT muons that are used to predict the high tail of the
E/ spectrum. For the tt background, this effect partially compensates for the bias from the WT
polarization. For W+jets events, in contrast, the polarization effects for W+and W− approxi-mately cancel, but the lepton pTthreshold shifts the predicted yield upward. Correction factors
from simulation are used to account for these effects (as well as for polarization effects), which are well defined and understood.
Finally, the resolution on the reconstructed E/ is poorer than that for the lepton pT T, so the E/T
spectrum is somewhat broadened with respect to the prediction from the lepton spectrum. We measure E/ resolution functions in the data using QCD multijet events obtained with a set ofT
single-jet triggers spanning the range from ET ≥ 30 GeV to ET ≥ 370 GeV. These resolution
functions, or templates, quantify the E/ resolution as a function of the number of jets and theT
HT of the event. These templates are used to smear the measured lepton momenta. Because
the templates are taken from data, they include not only the intrinsic detector resolutions, but also acceptance effects. The overall effect of the smearing is modest, changing the background prediction by 5–15%, depending on the E/ threshold applied.T
The raw background predictions for the single-lepton background are corrected to account for the effects described above, as well as for the small contamination of the single-lepton control sample arising from dilepton and single-τ events with high-pTleptons. These backgrounds are
measured separately, as described below. The overall correction factor is defined such that the lepton prediction in a given signal region in simulation matches the yield from single-lepton processes.
The predicted single-lepton background yield varies from about 150 events for the signal region with 250 ≤ E/T < 350 GeV and HT ≥ 500 GeV to about 3 events for the region with E/T ≥
550 GeV and HT ≥ 1000 GeV. These predictions, as well as the expectations from simulation,
are presented in Tables 2, 3, and 4 and discussed in more detail in Section 5.4.
5.3 Estimation of non-single-lepton backgrounds
The non-single-lepton backgrounds include dilepton events in several categories, events with W→τνfollowed by τ → `decays (in either tt or W+jets events), and QCD multijet processes. These subdominant backgrounds are estimated using control samples in data, in conjunction
5.3 Estimation of non-single-lepton backgrounds 9
Table 2: Event yields for the Lepton Spectrum method for HT ≥ 500 GeV. The upper part of
the table gives the background predictions that are based on simulated (MC) event samples and the yield for the SUSY signal points LM3 and LM6. The lower part gives the backgrounds predicted using control samples in the data (data-driven prediction). The actual yield observed in data is given at the bottom, with the separate muon and electron yields given in parentheses (Nµ, Ne) after the total yield. The uncertainties on the background predictions are statistical
and systematic. The MC yields are not used in setting limits and are included only for reference. The uncertainties on the MC yields are statistical only.
E/ range [GeV]T [250, 350) [350, 450) [450, 550) ≥550 MC yields 1` 146.7±2.1 34.8±1.1 8.5±0.6 2.9±0.3 Dilepton 19.9±0.5 3.8±0.2 0.7±0.1 0.3±0.1 1 τ 30.6±0.9 7.9±0.5 2.1±0.3 0.8±0.2 Z+jets 1.3±0.8 <0.1 <0.1 <0.1 Total (MC) 198.6±2.5 46.5±1.2 11.3±0.6 4.0±0.4 SUSY LM3 (MC) 266.3±3.7 91.0±2.2 23.3±1.1 9.9±0.7 SUSY LM6 (MC) 23.4±0.3 20.0±0.3 13.4±0.2 10.8±0.2 Data-driven prediction 1` 109±13±18 32.0±7.5±5.8 3.9±2.7±1.2 3.1±2.3±1.0 Dilepton 15.8±1.9±1.8 3.0±0.9±0.5 0.5±0.3±0.2 0.1±0.2±0.2 1 τ 33.0±1.8±1.7 8.9±1.0±0.5 2.1±0.5±0.2 1.1±0.3±0.2 QCD 0.0±1.0±1.2 0.0±1.0±1.2 0.0±1.0±1.2 0.0±1.0±1.2 Z+jets (MC) 1.3±0.8±1.3 <0.1 <0.1 <0.1 Total (predicted) 159±14±18 44.0±7.7±6.0 6.6±2.9±1.7 4.3±2.6±1.6 Data (observed) 163 (84, 79) 46 (21, 25) 9 (8, 1) 2 (1, 1)
Table 3: Event yields for the Lepton Spectrum method for HT ≥ 750 GeV. Further details are
given in the Table 2 caption.
E/ range [GeV]T [250, 350) [350, 450) [450, 550) ≥550 MC yield 1` 47.3±1.2 14.9±0.7 5.4±0.4 2.7±0.3 Dilepton 8.2±0.4 2.3±0.2 0.6±0.1 0.3±0.1 1 τ 9.2±0.5 3.0±0.3 1.2±0.2 0.7±0.2 Z+jets 0.7±0.6 <0.1 <0.1 <0.1 Total (MC) 65.4±1.5 20.2±0.8 7.2±0.5 3.6±0.4 SUSY LM3 (MC) 114.6±2.5 47.1±1.6 16.1±0.9 8.6±0.7 SUSY LM6 (MC) 14.9±0.3 13.8±0.2 10.3±0.2 9.8±0.2 Data-driven prediction 1` 41.7±8.7±5.4 11.7±5.0±1.9 2.6±2.3±0.6 3.1±2.4±0.8 Dilepton 5.9±1.1±0.7 1.3±0.5±0.2 0.5±0.2±0.1 0.1±0.1±0.3 1 τ 9.6±0.9±0.6 3.1±0.6±0.3 1.1±0.3±0.2 0.8±0.2±0.1 QCD 0.0±0.2±0.4 0.0±0.2±0.4 0.0±0.2±0.4 0.0±0.2±0.4 Z+jets (MC) 0.7±0.6±0.7 <0.1 <0.1 <0.1 Total (predicted) 57.9±8.9±5.6 16.2±5.0±2.0 4.2±2.4±0.8 4.0±2.4±1.0 Data (observed) 48 (27, 21) 16 (7, 9) 5 (4, 1) 2 (1, 1)
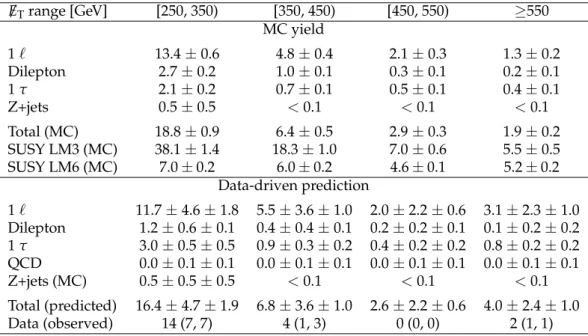
Table 4: Event yields for the Lepton Spectrum method for HT > 1000 GeV. Further details are
given in the Table 2 caption. ET / range [GeV] [250, 350) [350, 450) [450, 550) ≥550 MC yield 1` 13.4±0.6 4.8±0.4 2.1±0.3 1.3±0.2 Dilepton 2.7±0.2 1.0±0.1 0.3±0.1 0.2±0.1 1 τ 2.1±0.2 0.7±0.1 0.5±0.1 0.4±0.1 Z+jets 0.5±0.5 <0.1 <0.1 <0.1 Total (MC) 18.8±0.9 6.4±0.5 2.9±0.3 1.9±0.2 SUSY LM3 (MC) 38.1±1.4 18.3±1.0 7.0±0.6 5.5±0.5 SUSY LM6 (MC) 7.0±0.2 6.0±0.2 4.6±0.1 5.2±0.2 Data-driven prediction 1` 11.7±4.6±1.8 5.5±3.6±1.0 2.0±2.2±0.6 3.1±2.3±1.0 Dilepton 1.2±0.6±0.1 0.4±0.4±0.1 0.2±0.2±0.1 0.1±0.2±0.2 1 τ 3.0±0.5±0.5 0.9±0.3±0.2 0.4±0.2±0.2 0.8±0.2±0.2 QCD 0.0±0.1±0.1 0.0±0.1±0.1 0.0±0.1±0.1 0.0±0.1±0.1 Z+jets (MC) 0.5±0.5±0.5 <0.1 <0.1 <0.1 Total (predicted) 16.4±4.7±1.9 6.8±3.6±1.0 2.6±2.2±0.6 4.0±2.4±1.0 Data (observed) 14 (7, 7) 4 (1, 3) 0 (0, 0) 2 (1, 1)
with information from simulation. The contribution from Drell-Yan and Z+jets is very small and is estimated directly from simulation.
Dilepton background events (including the τ as one of the leptons) contain at least two neutri-nos, so these events can be important in the tails of the E/ distributions. These backgrounds areT
divided into the following categories: (i) 2`events with one lost or ignored lepton (` = e, µ), (ii)` +τevents with τ→hadrons, and (iii)` +τevents with τ →lepton. A lost lepton is one that is either not reconstructed or is out of the detector acceptance. An ignored lepton is one that is reconstructed but fails either the lepton-identification requirements (including isolation) or the pTthreshold requirement.
To estimate the background from dilepton events with lost or ignored leptons, we compute the ratio of the combined yield of dilepton events in the ee, eµ, and µµ channels in data to the corresponding combined yield in simulated event samples. This ratio, which is 0.91±0.07 for HT ≥ 500 GeV, 0.93±0.15 for HT ≥ 750 GeV, and 0.87±0.37 for HT ≥ 1000 GeV, is used
to rescale the E/ distribution of dilepton events that appear in the signal region in simulation.T
(Events within 20 GeV of the nominal Z mass are excluded in the e+e− and µ+µ− channels.) This approach is used because the dilepton control sample in data is small, and using it to obtain the shapes of E/ distributions would result in large statistical uncertainties. For all ET /T
bins above 250 GeV, the predicted yield from this background contribution is less than 6 events, and for all E/ bins above 350 GeV, the yield is at or below 1 event. The ET / distribution associatedT
with the reconstructed dilepton events in data is well described by the simulation.
Dilepton events can also involve τ decays, either τ →hadrons or τ → `. The E/ distributionsT in the dilepton events in data, when suitably modified to reflect the presence of a leptonic or hadronic τ decay, provide an accurate description of the shape of the E/ distribution of theseT
backgrounds. Thus, to estimate the shape from the τ →hadrons background, we effectively replace a lepton in a reconstructed dilepton event with a hadronic τ jet. Both hadronic and leptonic τ response functions are used, providing a probability distribution for a τ to produce a jet or a lepton with a given fraction pT(jet)/pT(τ)or pT(`)/pT(τ). These response functions,
5.3 Estimation of non-single-lepton backgrounds 11 [GeV] T E 100 200 300 400 500 600 700 Events/ 50 GeV -2 10 -1 10 1 10 2 10
Prediction from data MC truth, scaled = 7 TeV s -1 CMS 4.98 fb 750 GeV ≥ T background, H l → l 2 [GeV] T E 100 200 300 400 500 600 700 Events/ 50 GeV -2 10 -1 10 1 10 2 10
Prediction from data MC truth, scaled = 7 TeV s -1 CMS 4.98 fb 750 GeV ≥ T background, H l → τ 1
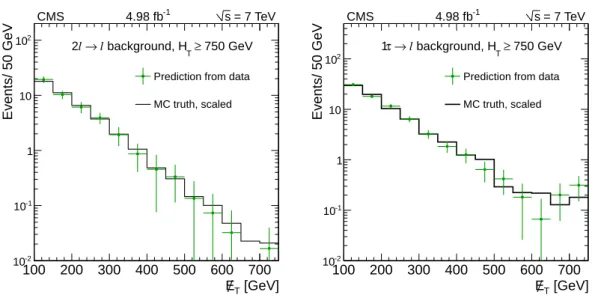
Figure 2: Predictions for dilepton and τ → `backgrounds after requiring HT ≥ 750 GeV:
con-trol samples in data (green points with error bars) vs. MC predictions (black solid histogram) for (left) dilepton background and (right) τ → ` background. The MC prediction has been scaled to the integral of the data prediction.
obtained from simulation, are computed in bins of pT(τ). This procedure can change the to-tal number of jets above threshold in the event, as well as other properties such as HT and
E/ , which are recalculated. Simulated event samples are used to determine, for each of theseT
processes i, the ratio ri = Nfeedi /Ncontrolof the number of events observed in the single-lepton
channel to the number of events in the control sample, as a function of E/ . This procedure ef-T
fectively normalizes all such contributions to the control samples in data. For all E/ bins aboveT
250 GeV, the number of dilepton events with a τ → hadrons decay is predicted to be about 7 events or less and is much smaller in the higher E/ bins. The number of dilepton events withT
a τ → `decay is predicted to be less than 3 events for all E/ bins above 250 GeV and is muchT
smaller in the higher E/ bins.T
Estimates for the τ → `single-lepton backgrounds from tt and W+jets processes are based on a procedure similar to that used for the dilepton backgrounds, but in this case the single-lepton sample itself is used as the control sample. The E/ distribution obtained by applying theT
τ → `response function to the data is rescaled by a ratio from simulation that gives the yield of τ→ `background events divided by the yield of events in the single-lepton control sample, as a function of E/ . The number of background events from the single τT → ` contribution
falls from 33 for HT ≥ 500 GeV and 250 ≤ E/T < 350 GeV to 1.1 event for HT ≥ 500 GeV and
E/T ≥550 GeV.
The background predictions in data are shown in Fig. 2, where the expectation based on sim-ulation is shown for comparison. The total predicted dilepton plus single τ → `background yield ranges from about 50 events for HT ≥500 GeV and 250≤ E/T <350 GeV to about 1 event
for HT ≥1 TeV and E/T≥550 GeV. All of these predictions, as well as the expecations from
sim-ulation, are presented in Tables 2, 3, and 4, which are discussed in more detail in Section 5.4. Background from QCD multijet events is suppressed to a level well below 1 event in nearly all signal regions, as shown in Tables 2, 3, and 4. The QCD multijet background is determined by first defining a control sample with small missing transverse momentum (E/T < 50 GeV) and
select a sample with little contamination from other SM processes such as tt and W+jets pro-cesses. Using this control sample, we measure the shape of the distribution in the combined relative isolation variable, Irelcomb (see Section 4). The shape of this distribution has very little correlation to E/ or to the lepton impact parameter (dT 0), and so can be applied in the high-E/T
signal regions. For each signal region in the data, we determine the background at low values of Irelcombby first scaling the measured QCD multijet background shape in the relative isolation variable to the high-Irelcombsideband of the signal region. The shape is then used to extrapolate the yield to the low- Icomb
rel signal region. In the high-E/ signal regions, some non-QCD SMT
background can be present at high Icomb
rel , where the QCD background shape is normalized. We
therefore subtract the estimated background from tt, W+jets, and Z+jets from this region. These yields are taken from simulation, with systematic uncertainties determined from a comparison with a control region in the data.
5.4 Results from the Lepton Spectrum method
Tables 2, 3, and 4 compare the background yields predicted from the control samples in data with the yields obtained directly from simulation for HT ≥ 500 GeV, HT ≥ 750 GeV, and
HT ≥ 1000 GeV, respectively. We observe that the single-lepton background is the dominant
contribution in all regions. The various sources of uncertainties associated with these back-ground determinations are discussed in Section 9. Finally, the yields observed in the signal regions in the data, which are listed at the bottom of each table, are consistent with the total background predictions based on the control samples. Thus, we observe no evidence for any excess of events in the data above the SM contributions.
Figure 3 shows the E/ distributions in data for the combined muon and electron channels,T
with all of the selection requirements, except that on E/ itself. The distributions are shownT
for HT ≥ 500 GeV, HT ≥ 750 GeV, and HT ≥ 1000 GeV, on both linear and logarithmic scales.
The predicted E/ distribution (green-bar histogram) is a sum over three sources: single-leptonT
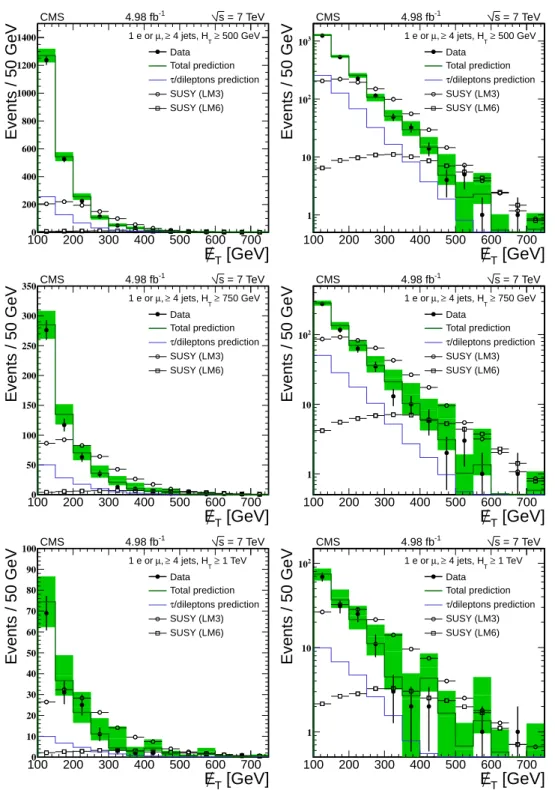
backgrounds (from tt, top, and W+jets events), dilepton background from tt, and single-τevents (from both tt and W+jets processes). The vertical span of the green bar corresponds to the statistical uncertainty on the background prediction. (The systematic uncertainties are computed in wider bins used for setting the limits and are given in Tables 2, 3, and 4.) In each signal region, the blue histogram shows the contribution from the dilepton and single-τ backgrounds only. It is evident that the single-lepton background is dominant in all cases. The E/ distributions for the SUSY benchmark models LM3 and LM6 are overlaid (not summed) forT
comparison. Systematic uncertainties and the interpretation are presented in Section 9.
6
Lepton Projection method
6.1 Overview of the Lepton Projection method
The Lepton-Projection (LP) method uses the difference between SM and SUSY processes in the correlation of the lepton transverse momentum and the missing transverse momentum. As previously discussed, in the SM processes the E/ corresponds to the neutrino in the decay ofT
the W boson, either in W+jets or in tt events. The kinematics of W decays are dictated by the V−A nature of the W coupling to leptons and the helicity of the W boson, as discussed in Section 3. Since W bosons that are produced with high transverse momentum in W+jets events exhibit a sizable left-handed polarization, there is a significant asymmetry in the pT spectra of
the neutrino and charged lepton. A smaller asymmetry is expected in W bosons from t quark (¯t antiquark) decays, which yield W bosons which are predominantly longitudinally polarized
6.1 Overview of the Lepton Projection method 13 [GeV] T E 100 200 300 400 500 600 700 Events / 50 GeV 0 200 400 600 800 1000 1200 1400 ≥ 500 GeV T 4 jets, H ≥ , µ 1 e or = 7 TeV s -1 CMS 4.98 fb Data Total prediction /dileptons prediction τ SUSY (LM3) SUSY (LM6) [GeV] T E 100 200 300 400 500 600 700 Events / 50 GeV 1 10 2 10 3 10 1 e or µ, ≥ 4 jets, HT≥ 500 GeV = 7 TeV s -1 CMS 4.98 fb Data Total prediction /dileptons prediction τ SUSY (LM3) SUSY (LM6) [GeV] T E 100 200 300 400 500 600 700 Events / 50 GeV 0 50 100 150 200 250 300 350 750 GeV ≥ T 4 jets, H ≥ , µ 1 e or = 7 TeV s -1 CMS 4.98 fb Data Total prediction /dileptons prediction τ SUSY (LM3) SUSY (LM6) [GeV] T E 100 200 300 400 500 600 700 Events / 50 GeV 1 10 2 10 750 GeV ≥ T 4 jets, H ≥ , µ 1 e or = 7 TeV s -1 CMS 4.98 fb Data Total prediction /dileptons prediction τ SUSY (LM3) SUSY (LM6) [GeV] T E 100 200 300 400 500 600 700 Events / 50 GeV 0 10 20 30 40 50 60 70 80 90 100 1 TeV ≥ T 4 jets, H ≥ , µ 1 e or = 7 TeV s -1 CMS 4.98 fb Data Total prediction /dileptons prediction τ SUSY (LM3) SUSY (LM6) [GeV] T E 100 200 300 400 500 600 700 Events / 50 GeV 1 10 2 10 1 e or µ, ≥ 4 jets, HT≥ 1 TeV = 7 TeV s -1 CMS 4.98 fb Data Total prediction /dileptons prediction τ SUSY (LM3) SUSY (LM6)
Figure 3: Lepton Spectrum method: observed E/ distributions in data (filled points with er-T
ror bars) compared with predicted E/ distributions (green bars) in the combined electron andT
muon channels, on linear (left) and logarithmic (right) scales. Three different HTthresholds are
applied: HT ≥ 500 GeV (upper row), HT ≥ 750 GeV (middle row), and HT ≥ 1000 GeV (lower
with smaller left-handed (right-handed) components for W+(W−).
We have measured the fraction of the helicity states of the W boson using an angular analysis of leptonic W decays [21]. Since the total momentum of the W boson in these decays, and therefore its center-of-mass frame, cannot be accurately determined because the momentum of the neutrino along the beam axis cannot be measured, an observable that depends only on transverse quantities is used. A variable that is highly correlated with the cosine of the polar angle in the center-of-mass frame of the W boson is the “lepton projection variable”:
LP=
~pT(`) · ~pT(W)
|~pT(W)|2
, (3)
where~pT(`) is the transverse momentum of the charged lepton and~pT(W)is the transverse
momentum of the W boson. The latter quantity is obtained from the vector sum of the electron transverse momentum and the missing transverse momentum in the event.
Since SUSY decay chains result in large values of E/ , and often result in relatively low valuesT
of the lepton momentum as well, the LP distribution for SUSY events tends to peak near zero,
whereas W+jets and tt yield a broad range of LP values. This behavior is illustrated in Fig. 4,
which compares the LPdistribution from both SM processes and from two representative SUSY
benchmark points (LM3 and LM6).
P L -0.5 0 0.5 1 1.5 Events / 0.05 0 2 4 6 8 10 12 14 16 18 20 Muons >500 GeV T H >450 GeV T lep S Total SM W t t Z QCD LM6 LM3 CMS Simulation 4.98 fb4.98 fb-1-1 ss = 7 TeV = 7 TeV
P L -0.5 0 0.5 1 1.5 Events / 0.05 0 0.05 0.1 0.15 0.2 0.25 0.3 Muons >500 GeV T H >450 GeV T lep S Total MC LM6 LM3 CMS Simulation s = 7 TeV
Figure 4: Distribution of LP in SUSY and standard model processes from simulation. Left: all
distributions are normalized to the integrated luminosity. The different contributions from SM processes are shown, whereas for SUSY two benchmark points, LM3 and LM6, are displayed. Right: the same distributions normalized to unity. The SM distribution is the sum of all the individual SM processes shown in the left pane. The quantity SlepT = pT(`) +E/ is discussed inT
the text.
In the LPmethod, two regions in LPare defined: the region with LP <0.15 is used as the signal
region; the region with LP > 0.3 is used as the control region, i.e., a sample that is depleted
in the signal expected and is instead dominated by SM processes. These regions are selected using simulated event samples of W+jets, Z+jets, and tt, that are collectively referred to as electroweak (EWK) processes in what follows, as well as with simulated SUSY events with SUSY particle masses near the region currently under exploration.
6.2 Background estimation in theLPmethod 15
6.2 Background estimation in the LP method
The key ingredient of the analysis is the estimate of the number of events in the signal region from the SM processes. We define a translation factor,
RCS=
NMC(LP <0.15)
NMC(LP >0.3)
, (4)
which is the ratio of the number of events in the signal and control regions for the EWK pro-cesses. The translation factor is obtained from MC simulation of the EWK processes, and the uncertainties on this factor are included in the systematic uncertainty of the background esti-mate. In the case of muons, where the background from QCD multijets is negligible, the total number of events predicted from SM processes in the signal region, NSMpred(LP < 0.15), can
be determined directly from the number of events observed in the data in the control region, Ndata(LP >0.3):
NSMpred(LP<0.15) =RCS·Ndata(LP >0.3). (5)
In the case of the electrons, the presence of events from QCD multijet processes necessitates an independent evaluation of this background prior to the application of the translation factor for EWK processes.
The number of events estimated with this method is then compared to the number of events observed in the data in the signal region, Ndata(LP < 0.15), for indications of an excess of
events over the SM expectation. The analysis is performed in different regions of the event mass scale. To characterize the latter without affecting the correlation of the charged lepton and the neutrino in SM events, the scalar sum of the lepton transverse momentum and the missing transverse momentum, SlepT , is used: SlepT = pT(`) +E/ . For W decays, ST lepT ≈ pT(W)
at large values of pT(W).
In order to make the search optimization less dependent on the unknown energy scale of a new physics signal, the analysis is performed in disjoint ranges of SlepT and the results in these ranges are combined. In addition, the selection is also binned in a second dimension, the HT
variable, defined in Eq. (2).
As indicated in Table 1, the event selection used in this analysis is slightly different from the corresponding one in the LS analysis. To increase the sensitivity to SUSY decays, this analysis requires three or more jets. While this results in a significant increase in W+jets events, the additional SM background is mostly concentrated in the control region in LP.
The event yields in the muon and electron channels, as predicted from simulation, are shown in Table 5. As discussed previously, the dominant backgrounds to the lepton plus jets and E/T
signature arise from the production and decay of W+jets and tt. The production of single W bosons in association with jets, and with large transverse momenta, is in general the larger of the two, especially at lower jet multiplicities. The majority of the tt background arises from semi-leptonic tt decays, with fully leptonic tt decays in which a lepton is either ignored or not reconstructed contributing about 20% of the total tt background.
A source of background, which is not listed in Table 5, stems from QCD multijet events in which a jet is misreconstructed as a lepton. The simulation indicates that the magnitude of this background is small in the control region and negligible in the signal region. Nevertheless, since the uncertainties in simulating these backgrounds can be significant, we use control data samples to estimate the background in the muon and electron channels.
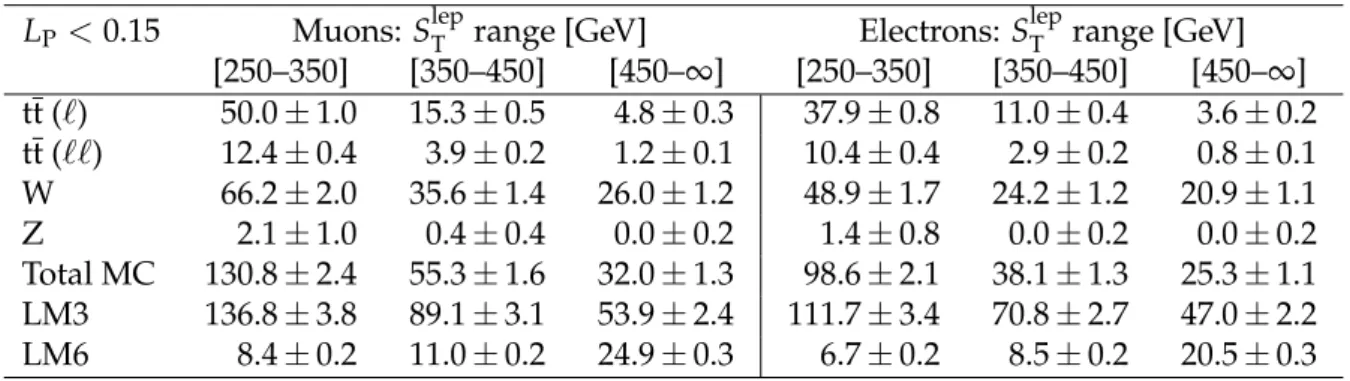
Table 5: Expected event yields in the signal region (LP < 0.15) from simulation. These yields
are for HT>500 GeV. These MC values are only listed for illustration purposes.
LP <0.15 Muons: SlepT range [GeV] Electrons: SlepT range [GeV]
[250–350] [350–450] [450–∞] [250–350] [350–450] [450–∞] tt (`) 50.0±1.0 15.3±0.5 4.8±0.3 37.9±0.8 11.0±0.4 3.6±0.2 tt (``) 12.4±0.4 3.9±0.2 1.2±0.1 10.4±0.4 2.9±0.2 0.8±0.1 W 66.2±2.0 35.6±1.4 26.0±1.2 48.9±1.7 24.2±1.2 20.9±1.1 Z 2.1±1.0 0.4±0.4 0.0±0.2 1.4±0.8 0.0±0.2 0.0±0.2 Total MC 130.8±2.4 55.3±1.6 32.0±1.3 98.6±2.1 38.1±1.3 25.3±1.1 LM3 136.8±3.8 89.1±3.1 53.9±2.4 111.7±3.4 70.8±2.7 47.0±2.2 LM6 8.4±0.2 11.0±0.2 24.9±0.3 6.7±0.2 8.5±0.2 20.5±0.3
To estimate the background from QCD multijets in the muon final state, we use the relative combined isolation, Icombrel , of the muon. Multijet events are expected to populate the region at high values of Icombrel , whereas muons from SUSY decays are isolated and thus have low values of Icombrel . We employ an additional control data sample, which is specially selected to be enriched in QCD multijets, to determine the ratio of multijet events at low values of the relative isolation. Using this ratio and the number of multijet events expected in the control region of the sample passing the preselection requirements, we estimate the background from multijet events in the signal region to be always smaller than 1% of the EWK backgrounds. This level of background is negligible and is thus ignored in what follows.
The main sources of electrons in QCD multijet events are misidentified jets and photon con-versions. This background is expected to be more substantial than the corresponding one in the muon sample, and its estimate exhibits a large dependence on the details of the simulation. For this reason, we estimate this background from control samples in data. The method relies on the inversion of one or more of the electron identification requirements in order to obtain a sample of anti-selected events, which is dominated by jets misidentified as electrons. We find that the inversion of the requirements on the spatial matching of the calorimeter cluster and the charged-particle track in pseudorapidity and azimuth leaves the relative fraction of the dif-ferent background sources in QCD multijets unchanged. Moreover, to increase the number of events in this control sample, the requirements on d0 and dz are removed, while the isolation
requirement is loosened. These changes to the event selection have a negligible effect on the LPdistribution in the data. In the simulated event samples, it is found that the LP distribution
from the control sample events provides a good description of the corresponding distribution from QCD background passing all selection requirements.
The LP distribution obtained with this control sample is used as a template to fit, along with
the LP distribution from EWK processes, the LP distribution in the data. In this fit, the EWK
template is taken from simulation. This approach, which provides a template obtained from data for the QCD contamination, was applied in the measurement of the polarization of high-pT W bosons [21]. The fit is performed in the control region (LP > 0.3), where the possible
presence of signal is highly suppressed. The numbers of QCD and EWK events obtained by the fit are used to estimate the total SM contamination in the signal region (LP < 0.15). The
method for estimating the number of SM events expected in the signal region is applied in each range of SlepT and HT.
dif-6.3 Results of theLPmethod 17
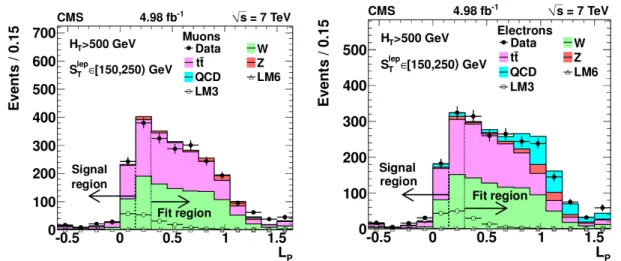
Figure 5: Fit results on data for 150 < SlepT < 250 GeV, in the muon (left) and electron (right) search samples. The fit is performed in the control region (LP > 0.3) and the result is
extrapo-lated into the signal region (LP <0.15).
ferent control samples, where both the fit and signal regions have a negligible expected SUSY yield. The first sample is defined as all events satisfying the preselection requirements but con-fined to low values of SlepT : 150 < SlepT < 250 GeV. The method described above is employed to predict the number of events expected in the signal region for both muons and electrons. This prediction is found to be fully consistent with the number of events observed in the data in signal region. The results of the fits and the yields of QCD and EWK events in the region of low SlepT (< 250 GeV) are displayed in Fig. 5 for the electron and muon samples. As can be seen in Fig. 5, the QCD contamination in the signal region, LP <0.15, is negligible, as expected,
since low values of LPfavor events with low-pTleptons and high E/ . The second sample, usedT
only for events with muons, is collected with a separate trigger without any requirements on HT or E/ . The muon transverse momentum threshold is raised to pT T(µ) > 35 GeV, while the HT threshold is lowered from 500 GeV to 200 GeV and the jet multiplicity requirement is
re-versed, to be fewer than three jets. Given these requirements on HTand on the jet multiplicity,
this control sample is dominated by SM processes. It is found that the estimated background agrees well with the number of events seen in the signal region LP <0.15.
6.3 Results of theLP method
The LP distributions in three ranges of SlepT , are displayed in Fig. 6 for muons (top) and
elec-trons (bottom). Tables 6 and 7 list the numbers of events observed and the number of events expected from all SM processes as presented above, in the signal region, for the muon and electron channels, respectively. The predictions, along with the numbers of events observed in each range of SlepT and HT, are also displayed graphically in Fig. 7 for muons and in Fig. 8 for
electrons. The uncertainties quoted in Table 7 correspond to the statistical uncertainty of the fit, while the predictions displayed in Fig. 8 include the total statistical and systematic uncertainty. All estimates of the total contribution expected from SM processes in the various bins in (SlepT ,HT)
are consistent with the numbers of events observed in the data, with no visible excess from a potential SUSY signal. The result is interpreted as a limit in SUSY parameter space in the con-text of the CMSSM in Section 9.
P L -0.5 0 0.5 1 1.5 Events / 0.15 0 50 100 150 200 250 Data W t t Z QCD LM6 LM3 Muons CMS -1 4.98 fb s = 7 TeV >500 GeV T H [250,350) GeV ∈ T lep S P L -0.5 0 0.5 1 1.5 Events / 0.15 0 10 20 30 40 50 60 70 80 Data W t t Z QCD LM6 LM3 Muons CMS -1 4.98 fb s = 7 TeV >500 GeV T H [350,450) GeV ∈ T lep S P L -0.5 0 0.5 1 1.5 Events / 0.15 0 5 10 15 20 25 30 35 40 45 50 Data W t t Z QCD LM6 LM3 Muons CMS -1 4.98 fb s = 7 TeV >500 GeV T H >450 GeV T lep S P L -0.5 0 0.5 1 1.5 Events / 0.15 0 20 40 60 80 100 120 140 160 180 Data W t t Z QCD LM6 LM3 Electrons CMS 4.98 fb-1 s = 7 TeV >500 GeV T H [250,350) GeV ∈ T lep S P L -0.5 0 0.5 1 1.5 Events / 0.15 0 10 20 30 40 50 60 Data W t t Z QCD LM6 LM3 Electrons CMS 4.98 fb-1 s = 7 TeV >500 GeV T H [350,450) GeV ∈ T lep S P L -0.5 0 0.5 1 1.5 Events / 0.15 0 5 10 15 20 25 30 35 40 Data W t t Z QCD LM6 LM3 Electrons CMS 4.98 fb-1 s = 7 TeV >500 GeV T H >450 GeV T lep S
Figure 6: Data and fit results for the predictions for the LPdistribution, for events in the search
sample, in different STlepregions. Top plots for the muon channel; bottom plots for the electron channel. Left: 250<SlepT <350 GeV, center: 350<SlepT <450 GeV, and right: STlep>450 GeV.
Table 6: Event yields in data and MC simulation for the muon sample. The results in the columns labelled “Total MC” are listed for reference only. The corresponding uncertainties statistical only.
SlepT range Total MC Data Total MC SM estimate Data [GeV] Control region (LP >0.3) Signal region (LP<0.15)
500<HT <750 GeV [150–250) 1465±11 1297 261±3.2 261±7 ±24 258 [250–350) 452±5.2 383 99.3±2.1 84.1±4.2±7.3 78 [350–450) 154±3.1 128 40.2±1.4 33.3±3.0±2.6 23 ≥450 59.2±1.8 50 18.6±1.0 15.7±2.2±2.0 16 750< HT <1000 GeV [150–250) 280±4.1 218 52.4±1.6 40.8±2.9±3.5 46 [250–350) 91.9±2.1 88 22.3±0.9 21.3±2.3±2.2 22 [350–450) 34.6±1.3 25 10.3±0.6 7.5±1.5±1.0 8 ≥450 26.7±1.4 18 8.8±0.6 5.9±1.4±0.7 7 1000 GeV<HT [150–250) 92.3±2.5 76 20.5±1.0 16.9±1.9±1.7 15 [250–350) 32.9±1.3 31 8.7±0.8 8.2±1.5±1.0 8 [350–450) 10.9±0.7 7 4.6±0.4 2.9±1.1± 0.6 1 ≥450 11.9±0.8 12 4.6±0.5 4.6±1.4±0.7 2
19 [GeV] lep T S 200 300 400 500 Events 0 50 100 150 200 250 300 = 7 TeV s -1 4.98 fb CMS Muons (500,750) GeV ∈ T H SM estimate Data LM3 LM6 [GeV] lep T S 200 300 400 500 Events 0 10 20 30 40 50 60 70 80 = 7 TeV s -1 4.98 fb CMS Muons (750,1000) GeV ∈ T H SM estimate Data LM3 LM6 [GeV] lep T S 200 300 400 500 Events 0 5 10 15 20 25 30 35 40 45 = 7 TeV s -1 4.98 fb CMS Muons >1000 GeV T H SM estimate Data LM3 LM6
Figure 7: Comparison of the number of events observed in the data and the expectations from the background estimation methods for the muon channel, in the different SlepT bins. Left: 500 < HT < 750 GeV; Center: 750 < HT < 1000 GeV; Right: HT > 1000 GeV. The error bars
indicate the statistical uncertainty of the data only, while the green band indicates the total statistical and systematic uncertainty on the background estimate.
Table 7: Event yields in data and predictions of the numbers of EWK and QCD events for the electron sample in bins of HT. The sum of predicted EWK events and predicted QCD events in
the control region is constrained to be equal to the total number of data events. The background estimate used in comparing to the yields in the data is the result of the procedure described earlier and is listed in the row labeled “SM estimate”. The uncertainties for the QCD and EWK background estimates are statistical only. The uncertainties shown for the SM estimate are first the statistical uncertainty from the control region fit and second all other systematic uncertainties.
SlepT range [GeV] QCD EWK Data QCD EWK SM estimate Data
Control region (LP>0.3) Signal region (LP<0.15)
500<HT<750 GeV [150–250) 184±33 1122±45 1306 9.1±1.6 170±7 179±7±18 204 [250–350) 66±15 334±22 400 2.1±0.5 63.3±4.1 65.3±4.3±5.9 71 [350–450) 26.6±7.6 93±11 120 0.3±0.1 19.2±2.3 19.4±2.4±2.9 29 ≥450 17.1±5.1 33.9±6.6 51 0.2±0.0 9.0±1.8 9.2±1.9±1.7 11 750<HT<1000 GeV [150–250) 39±15 210±20 249 1.9±0.7 35.1±3.3 37.0±3.5±4.8 37 [250–350) 5.8±5.5 59.2±9.1 65 0.2±0.2 11.0±1.7 11.2±2.0±1.8 13 [350–450) 0.0±0.0 26.0±5.1 26 0 6.3±1.2 6.3±1.2±1.5 5 ≥450 8.7±3.4 22.3±5.0 31 0.1±0.0 6.7±1.5 6.8±1.6±1.5 5 1000 GeV<HT [150–250) 14.9±7.7 62±10 77 0.7±0.4 11.7±1.9 12.5±2.2±2.4 9 [250–350) 10.4±4.3 20.6±5.4 31 0.3±0.1 4.5±1.2 4.8±1.5±1.1 8 [350–450) 0.5±1.7 11.5±3.7 12 0.0±0. 2.6±0.8 2.6±1.2±0.9 1 ≥450 4.4±2.5 6.6±2.9 11 0.0±0.0 2.5±1.1 2.6±1.3±0.9 1
7
The Artificial Neural Network method
7.1 Overview of the method
The Artificial Neural Network (ANN) method uses a multi-variate analysis to combine sev-eral event characteristics, other than E/ , into a single variable that distinguishes signal fromT
[GeV] lep T S 200 300 400 500 Events 0 50 100 150 200 250 = 7 TeV s -1 4.98 fb CMS Electrons (500,750) GeV ∈ T H SM estimate Data LM3 LM6 [GeV] lep T S 200 300 400 500 Events 0 10 20 30 40 50 60 = 7 TeV s -1 4.98 fb CMS Electrons (750,1000) GeV ∈ T H SM estimate Data LM3 LM6 [GeV] lep T S 200 300 400 500 Events 0 5 10 15 20 25 = 7 TeV s -1 4.98 fb CMS Electrons >1000 GeV T H SM estimate Data LM3 LM6
Figure 8: Comparison of the number of events observed in the data and the expectations from the background estimation methods for the electron channel, in the different SlepT bins. Left: 500 < HT < 750 GeV; Center: 750 < HT < 1000 GeV; Right: HT > 1000 GeV. The error bars
indicate the statistical uncertainty of the data only, while the green band indicates the total statistical and systematic uncertainty on the background estimate.
plane of the ANN output (zANN) and E/ , and the sidebands in this plane provide an estimateT
of the residual background.
Four input variables drive the ANN. The first two are njets, the number of jets with pT >40 GeV,
and HT, the scalar sum of the pT of each jet with pT > 40 GeV. The SUSY signal typically has
heavy particles decaying via complex cascades, and as such, is likely to produce more jets and larger HT than SM backgrounds. The third variable is∆φ(j1, j2), the angle between the two
leading pT jets in the transverse plane, which makes use of the greater likelihood that the two
highest pTjets are produced back-to-back in SM than in SUSY events. The final variable is MT,
the transverse mass of the lepton and E/ system. In tt and W+jets events, the lepton and ET /T
generally arise from the decay of a W boson, and as a result, MTpeaks near the W boson mass,
with larger values arising only when there are additional neutrinos from τ or semileptonic decays. By contrast, in SUSY events, MTtends to be greater than the W mass because of E/ dueT
to undetected LSPs.
Figure 9 shows the distributions of these variables for simulated SM and SUSY events. The most powerful input variable is MT; njetsand HTalso have considerable discriminating power.
The∆φ(j1, j2)variable is weaker, but it still improves the sensitivity of the search. Lepton pTalso
discriminates between the SM and SUSY, but it is not included in the ANN because its strong correlation with E/ in the SM would spoil the background estimate. Additional variables eitherT
do little to improve sensitivity or introduce a correlation between zANN and E/ . The inputT
variables have similar distributions in the muon and electron channels, so we choose to train the ANN on the two channels combined, and use the same ANN for both. In general, the SM simulation describes the data adequately apart from a possible small structure near 130 GeV in the MTdistribution. Reweighting the simulation to match the MTdistribution in data does not
affect the results of the analysis.
The ANN infrastructure uses standard ROOT utilities [42]. During training, weights are de-termined that minimize the root-mean-square deviation of background events from zero and signal events from unity. For the SUSY parameter space under study, our sensitivity depends only mildly on the details of the signal sample that trains the ANN. Specifically, for LM points 0 through 13 [30], the sensitivity is comparable (less than 30% variation) whether the ANN is trained on LM0, LM6 or LM9, even though these three training samples have rather different
7.1 Overview of the method 21 Number of events 1 10 2 10 3 10 Data W tt t Z QCD LM3 LM6 Number of jets 3 4 5 6 7 8 9 10 Data/MC 0.50 1 1.5 CMS 4.98 fb–1 √s = 7 TeV
Number of events / 100 GeV
1 10 2 10 3 10 Data W tt t Z QCD LM3 LM6 [GeV] T H 500 1000 1500 2000 2500 Data/MC0.50 1 1.5 CMS 4.98 fb–1 √s = 7 TeV
Number of events / 0.2 rad
100 200 300 400 500 600 700 Data W tt t Z QCD LM3 LM6 ) [rad] 2 ,j 1 (j φ ∆ 0 0.5 1 1.5 2 2.5 3 Data/MC 0.50 1 1.5 CMS 4.98 fb–1 √s = 7 TeV
Number of events / 25 GeV
1 10 2 10 3 10 Data W tt t Z QCD LM3 LM6 [GeV] T M 100 200 300 400 500 600 Data/MC 0.50 1 1.5 CMS 4.98 fb–1 √s = 7 TeV
Figure 9: The distributions of njets, HT, ∆φ, and MT for data (solid circles), simulated SM
(stacked shaded histograms), LM3 (open circles), and LM6 (open triangles) events after pre-selection. The small plot beneath each distribution shows the ratio of data to simulated SM yields. The muon and electron channels are combined.