ORIGINAL ARTICLE
Neurodegeneration in systemic lupus
erythematosus: layer by layer retinal study using
optical coherence tomography
Arnaldo Dias‑Santos
1,2,3,11*, Joana Tavares Ferreira
1,2,3, Sofia Pinheiro
4, João Paulo Cunha
1,3, Marta Alves
5,6,
Ana L. Papoila
3,5,6, Maria Francisca Moraes‑Fontes
3,7,8and Rui Proença
9,10Abstract
Background: Systemic lupus erythematosus (SLE) is a chronic, autoimmune and multisystemic disease. Recent studies with functional and structural magnetic resonance imaging and cognitive tests report an unexpectedly high frequency of central nervous system involvement, even in patients with asymptomatic SLE. The purpose of this study was to identify early signs of retinal neurodegeneration by comparing the thickness of the peripapillary retinal nerve fiber layer (pRNFL) and all macular layers between patients with SLE without ophthalmologic manifestations and healthy controls. The effect of disease duration and systemic comorbidities was also studied.
Methods: Cross‑sectional study, in which all participants underwent a complete ophthalmologic evaluation includ‑ ing retinal segmentation analysis with spectral domain‑optical coherence tomography. Patients with SLE also received a detailed autoimmune disease specialist evaluation to assess the disease activity state and systemic involvement. For pRNFL thickness, the global and six peripapillary sectors were determined. Each macular layer thickness was deter‑ mined in the nine Early Treatment Diabetic Retinopathy Study (ETDRS) subfields. A multiple linear regression analysis was performed to control for the effect of potential demographic, ophthalmic and systemic confounders. A second multivariable analysis, including patients with SLE only, was performed to assess the effect of disease‑specific vari‑ ables on the outcome measures.
Results: Sixty‑eight eyes of 68 patients with SLE and 50 eyes of 50 healthy controls were considered. The pRNFL was significantly thinner in the SLE group globally (p = 0.026) and in the temporal superior (p = 0.007) and temporal (p = 0.037) sectors. In patients with SLE, chronic medication for hypercholesterolemia, hypertension and anticoagu‑ lants were associated with a significant thinning of the pRNFL. Patients with SLE presented significant thinning in the photoreceptor layer in five ETDRS areas (p < 0.05). Shorter disease duration was associated with greater photoreceptor thinning in all ETDRS subfields. Neuropsychiatric SLE, higher disease activity and cardiovascular risk factors were asso‑ ciated with a thinner photoreceptor layer. No differences were observed in overall retinal thickness or the remaining macular layers.
Conclusion: Patients with SLE present early signs of retinal neurodegeneration, as evidenced by a reduction in the photoreceptor layer and pRNFL. These signs are more pronounced in patients with higher cardiovascular risk burden or neuropsychiatric involvement.
© The Author(s) 2020. This article is licensed under a Creative Commons Attribution 4.0 International License, which permits use, sharing, adaptation, distribution and reproduction in any medium or format, as long as you give appropriate credit to the original author(s) and the source, provide a link to the Creative Commons licence, and indicate if changes were made. The images or other third party material in this article are included in the article’s Creative Commons licence, unless indicated otherwise in a credit line to the material. If material is not included in the article’s Creative Commons licence and your intended use is not permitted by statutory regulation or exceeds the permitted use, you will need to obtain permission directly from the copyright holder. To view a copy of this licence, visit http://creat iveco mmons .org/licen ses/by/4.0/. The Creative Commons Public Domain Dedication waiver (http://creat iveco mmons .org/publi cdoma in/ zero/1.0/) applies to the data made available in this article, unless otherwise stated in a credit line to the data.
Open Access
*Correspondence: [email protected]
11 Serviço de Oftalmologia, Hospital de Santo António dos Capuchos,
Alameda de Santo António dos Capuchos, 1169‑050 Lisbon, Portugal Full list of author information is available at the end of the article
Background
Systemic lupus erythematosus (SLE) is a chronic auto-immune disease that can affect multiple organ systems. Involvement of the central nervous system (CNS) occurs in 12% to 95% of patients with SLE [1]. A large number of manifestations ranging from distinct neurologic disor-ders such as stroke, aseptic meningitis and Guillain-Barré syndrome to more subtle dysfunctions such as head-ache, mood disorders and cognitive dysfunction have been included by the American College of Rheumatol-ogy under the designation of neuropsychiatric systemic lupus erythematosus (NP-SLE) [2]. Overall, it is associ-ated with a significant increase in morbidity and mortal-ity [3]. However, the absence of NP-SLE biomarkers and a lack of specificity for neuropsychiatric events that are common in the general population render the diagnosis a challenge. Moreover, the frequency of some sort of neu-rologic impairment in SLE is unexpectedly high, even in asymptomatic patients without NP-SLE criteria [4]. Of note, patients with non-NP-SLE perform worse in cogni-tive tests and present a significantly higher rate of struc-tural and functional abnormalities in magnetic resonance imaging when compared to healthy controls [5]. Addi-tionally, the brains of recently diagnosed patients with SLE, without neurologic symptoms, present abnormally high blood flow and glucose consumption (hypermetab-olism) in the white matter. This phenomenon was more prominent in patients with poor systemic disease control [6]. This finding suggests that neurologic involvement with CNS inflammation and subsequent neurodegen-eration may be present early in the course of the disease before the development of NP-SLE.
Spectral domain optical coherence tomography (SD-OCT) is a safe and objective method that permits high-resolution cross-sectional images of the retina. In the last few years, this technique has evolved, allowing precise qualitative and quantitative evaluation of all retinal layers with high repeatability and reproducibility [7]. This evo-lution expanded its applications beyond ophthalmic dis-eases, and SD-OCT is now a well-established biomarker of neurodegenerative disorders such as multiple sclerosis [8], Alzheimer’s disease [9] and Parkinson’s disease [10]. The role of OCT as a biomarker of SLE-associated neu-rodegeneration has been addressed only in a few studies, which have yielded inconsistent results. However, these were pilot studies with small sample sizes, which only evaluated total retinal thickness or focused on some reti-nal layers [11–13].
This study aimed to compare the thickness of all macu-lar layers as well as the peripapilmacu-lary retinal nerve fiber layer (pRNFL) thickness between patients with SLE with-out ophthalmologic manifestations and a healthy control group. The relationship between retinal thickness and demographic characteristics, as well as disease duration, hydroxychloroquine intake and cumulative dosage and systemic comorbidities such as neuropsychiatric SLE, lupus nephritis and antiphospholipid syndrome was also studied.
Methods Patients
This was a cross-sectional study performed at the Oph-thalmology Department and at the Autoimmune Disease Units of the Central Lisbon Hospital University Center between August 2017 and August 2018. Consecutive patients with SLE were screened for inclusion/exclusion criteria. All patients fulfilled the 1997 revised American College of Rheumatology criteria for the diagnosis of SLE [14] and were aged between 18 and 80 years old.
A sex-matched control group with an age range between 18 and 80 years old was randomly recruited from the General Ophthalmology Department. Auto-immune diseases were ruled out in this group based on patient-reported past medical history and on general practitioner medical records.
The exclusion criteria for both study groups were a spherical equivalent > 5 diopters, axial length > 25 mm or keratic astigmatism > 3 diopters, diabetes mellitus, pregnancy, signs or previous history of optic neuropa-thy, retinopathy or choroidopathy (namely, lupus-related, age-related macular degeneration, vascular occlusion, macular dystrophy, hydroxychloroquine retinopathy, glaucoma, ocular hypertension or neurodegenerative dis-eases such as Alzheimer’s or Parkinson’s disease), ocular tumor, previous episodes of intraocular inflammation, history of intraocular or refractive surgery and substan-tial media opacities that compromised fundus imaging.
This study was approved by the Institutional Ethics Committee. All participants gave their written informed consent, and the principles of the Declaration of Helsinki were followed.
Study procedures
A complete ophthalmologic evaluation was performed on all patients, where demographic, background medi-cal history, full ophthalmologimedi-cal examination with best Keywords: Neurodegeneration, Peripapillary retinal nerve fiber layer, Photoreceptors, Spectral domain optical
corrected visual acuity (BCVA) testing, slit-lamp biomi-croscopy, dilated fundus examination, Goldmann appla-nation tonometry, optic biometry (using Lenstar LS 900®, Haag Streit AG, Koeniz, Switzerland) and SD-OCT were performed. Blood pressure was measured before SD-OCT. Patients with SLE currently or previously treated with hydroxychloroquine also underwent fundus autoflu-orescence imaging and 10-2 macular automated thresh-old visual field testing (using Octopus 900®, Haag Streit AG, Koeniz, Switzerland) to exclude retinal toxicity, in accordance with the American Academy of Ophthalmol-ogy guidelines [15]. An evaluation by an autoimmune disease specialist was also performed in all patients with SLE, which included a complete physical examination and laboratory tests required to access systemic disease activity, which was scored using the Systemic Lupus Ery-thematosus Disease Activity Index (SLEDAI) [16]. One eye per patient was randomly selected for the study.
Spectral‑domain optical coherence tomography imaging and layer segmentation
Peripapillary and macular tomographic scans were obtained with SD-OCT (Spectralis® Heidelberg, software version 6.0 Heidelberg, Germany) in all participants after pupillary dilation. Only good quality scans, with a signal strength better than 20 (40 = maximum), with completely
focused images, without artifacts or blank areas were considered in the analysis.
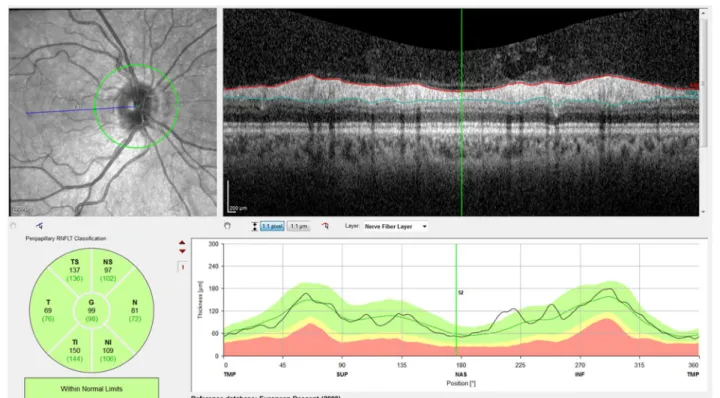
The pRNFL measurements employed a 12° circular scan centered on the optic nerve head, which corre-sponds to a retinal diameter of approximately 3.46 mm in an eye with typical axial length and corneal curva-ture. pRNFL thickness was determined globally (G) and for the six peripapillary sectors (TS—temporal superior, T—temporal, TI—temporal inferior, NI—nasal inferior, N—nasal, and NS—nasal superior) by the instrument’s built-in software, which automatically segments the internal limiting membrane (ILM) and the posterior bor-der of the retinal nerve fiber layer (RNFL) (Fig. 1).
For macular measurements, a fast macular thickness OCT protocol was used, which consists of horizontal raster scans obtained in a 20 × 20° (5.8 mm × 5.8 mm) square centered on the fovea (25 high-resolution scans with nine frames per B-scan). Images were analyzed using Spectralis automatic segmentation software to cal-culate individual retinal layer thickness values, namely, overall retinal thickness (RT), RNFL, ganglion cell layer (GCL), inner plexiform layer (IPL), inner nuclear layer (INL), outer plexiform layer (OPL), outer nuclear layer (ONL), photoreceptor layer (PRL) and retinal pigment epithelium (RPE). An Early Treatment Diabetic Retin-opathy Study (ETDRS) plot was automatically projected onto the retina by Spectralis OCT software [17]. This plot
consists of three concentric rings centered on the fovea, with 1-, 3- and 6-mm diameters. Two intersecting lines divide the two outer ETDRS rings into quadrants, gener-ating nine sectors: C, S3, T3, I3, N3, S6, T6, I6 and N6 (Fig. 2). Mean thickness values for all retinal layers were recorded for the nine ETDRS sectors.
Enhanced depth imaging scans were also obtained using the fast macular thickness OCT protocol to meas-ure choroidal thickness (CT), according to a previously described method [18]. CT was measured manually, sub-foveally and at 1000 µm superior, temporal, inferior and nasal to the fovea.
All OCT examinations were performed between 2:00 PM and 4:00 PM by an ophthalmologist (J.T.F.) and were assessed by another ophthalmologist (A.D.S.), both masked to the patients’ diagnosis. Image quality, centra-tion and segmentacentra-tion were checked and corrected if necessary.
Statistical analysis
The characteristics of study participants were described using the mean (standard deviation: SD) or the median (interquartile range: P25–P75) for continuous variables and frequencies (percentages) for categorical variables.
Univariable and multivariable linear regression mod-els were used to identify the variables that may explain the variability of macular retinal layers and pRNFL thick-nesses. The effect of potential confounders such as age, sex, spherical equivalent, BCVA, axial length, choroi-dal thickness, intraocular pressure (IOP), mean arterial
pressure (MAP), body mass index (BMI) and systemic medication was taken into account in this analysis. The selection of variables for the multivariable analysis was performed using the backward elimination method.
An analysis only for the SLE group was also performed to study the effect on retinal thickness of disease dura-tion, hydroxychloroquine intake and cumulative dosage and systemic comorbidities such as neuropsychiatric SLE, lupus nephritis and antiphospholipid syndrome, among others, using the same regression models.
The normality assumption of the residuals was verified with the Shapiro–Wilk goodness-of-fit test. A level of sig-nificance of α = 0.05 was considered. Data were analyzed using the Statistical Package for the Social Sciences for Windows, version 22.0 (IBM Corp. Released 2013. IBM SPSS Statistics for Windows, Version 22.0; IBM Corp, Armonk, NY).
Results
Patient demographics and clinical characteristics
A total of 68 eyes of 68 patients with SLE (58 women and 10 men) and 50 eyes of 50 healthy controls (43 women and 7 men) were enrolled in this study. The clinical and demographic characteristics of the patients and controls are summarized in Table 1. The pharmacological history is summarized in Additional file 1.
Analysis of the peripapillary retinal nerve fiber layer
Univariable analysis revealed a statistically significant difference in pRNFL thickness in the TS and T sectors, which was lower in the SLE group (Additional file 2).
In multivariable linear regression models (Table 2), after adjusting for sex, age, BCVA, IOP, spherical equiv-alent, axial length, BMI, MAP, and systemic medica-tion, there was a statistically significant difference in pRNFL thickness for the global (p = 0.026), temporal superior (p = 0.007) and temporal sectors (p = 0.037), which was lower in the SLE group. Age was negatively associated with pRNFL in some sectors (G p < 0.001; TI p = 0.013; NS p = 0.013; N p = 0.025). Axial length was also negatively associated with pRNFL thickness in the G (p = 0.013) and NI (p = 0.007) sectors.
The results of the multivariable regression analy-sis considering the SLE group alone are summarized in Table 3. Notably, chronic medication with antihyperten-sive drugs, namely, calcium channel blockers or angi-otensin-converting enzyme inhibitors, was associated with a thinner pRNFL in some sectors (G p = 0.009; TI p = 0.017; N p = 0.023; NS p = 0.006). Chronic medica-tion with anticoagulants was negatively associated with pRNFL thickness in the G (p = 0.022), TI (p = 0.007), NI (p = 0.020) and NS (p = 0.037) sectors. Chronic medi-cation with statins was also negatively associated with Fig. 2 Representative Spectralis Heidelberg SD‑OCT scans of the
pRNFL thickness in two sectors: TI (p = 0.021) and NI (p = 0.020). Age and axial length also remained in the model in some pRNFL sectors.
Analysis of macular retinal layers thickness
The mean retinal layers thickness in the healthy control and SLE groups, as well as in the subgroup of patients with NP-SLE, is depicted in Fig. 3.
In the multivariable analysis, after considering age, sex, BCVA, IOP, spherical equivalent, axial length, BMI, MAP and systemic medication, there were no statistically sig-nificant differences in overall RT or in most locations for the remaining retinal layers. The only exception was the photoreceptor (PR) layer.
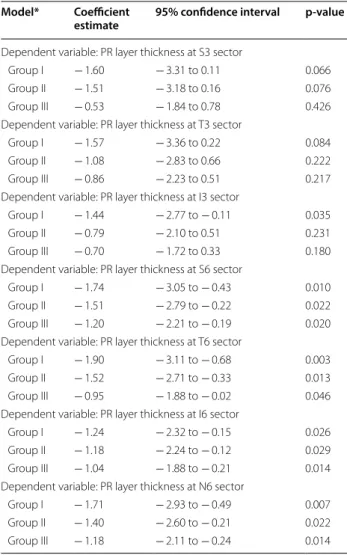
The results in the PR layer were more consistent and were thinner in the SLE group. Multivariable regression analysis was also performed by dividing the SLE group according to disease duration: group I (< 5 years, n = 16), group II (5–10 years, n = 17) and group III (> 10 years, n = 35). After classifying the SLE group according to this parameter, we observed a reduction in PR layer thickness when compared with the healthy control group that was
attenuated with increasing disease duration (Table 4). This pattern of PR thinning occurs in all macular sectors.
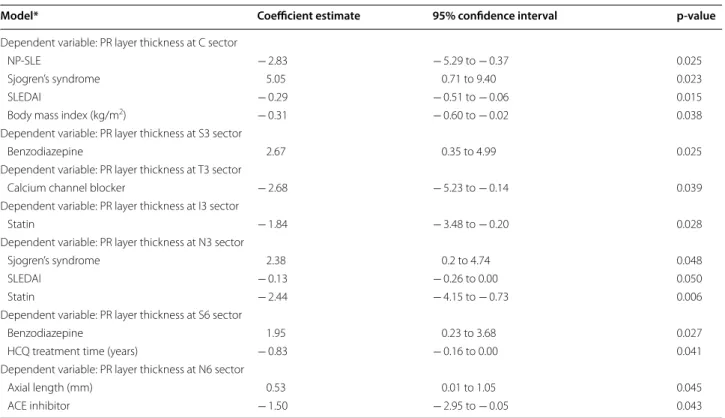
A multivariable regression analysis for the PR layer was also performed, considering the SLE group alone (Table 5). A higher SLEDAI score was associated with a reduction in PR layer thickness in the C (p = 0.015) and N3 (p = 0.050) sectors. NP-SLE diagnosis was associated with thinning of the PR layer in the C sector (p = 0.025). Chronic medication for hypertension (calcium chan-nel blockers and angiotensin-converting enzyme inhibi-tors) was associated with a thinner PR layer in the T3 (p = 0.039) and N6 (p = 0.043) sectors. Chronic medi-cation with statins was also negatively associated with PR layer thickness in two sectors: I3 (p = 0.028) and N3 (p = 0.006). Finally, secondary Sjogren’s syndrome was associated with a thicker PR layer in the C (p = 0.015) and N3 (p = 0.048) sectors.
Discussion
In this study, we found evidence of retinal neurodegener-ation in patients with SLE. Using SD-OCT, we compared pRNFL and macular layers thickness between patients
Table 1 Demographic and clinical characteristics of the patients by group
The results are expressed as the mean (SD) or median (P25–P75) for continuous variables or as n (%) for categorical variables
BCVA best corrected visual acuity, HCQ hydroxychloroquine, IOP intraocular pressure, logMAR logarithm of the minimum angle of resolution, MAP mean arterial
pressure, NA not applicable, NP-SLE neuropsychiatric systemic lupus erythematosus, SLE systemic lupus erythematosus, SLEDAI Systemic Lupus Erythematosus Disease Activity Index
*Chi‑square test; remaining p‑values were obtained by the Mann–Whitney test
Variables SLE group (n = 68) Control group (n = 50) p‑value
Age, years 45.50 (12.67) 52.76 (14.45) 0.003
Female sex, n (%) 58 (85.3) 43 (86) 0.914*
Body mass index, kg/m2 24.64 (3.91) 25.79 (3.73) 0.070
BCVA, logMAR 0.010 (0.051) 0.005 (0.020) 0.890
IOP‑Goldmann, mm Hg 13.60 (2.88) 13.76 (2.55) 0.738
Spherical equivalent, D − 0.25 (− 1.0 to 0.25) 0.13 (− 0.63 to 1.0) 0.048
Axial length, mm 23.56 (1.00) 22.89 (0.96) < 0.001
MAP, mm Hg 88.71 (11.06) 91.92 (13.11) 0.114
SLE duration, years 11.0 (6.25–19.0) NA
SLEDAI 2 (0–4) NA
HCQ
Daily dose, mg 329 (96) NA
Cumulative dose, g 778 (228.1–1606.0) NA
Therapy duration, years 5.30 (1.81–11.83) NA
Daily dose/weight, mg/kg 5.02 (1.61) NA Cumulative dose/weight, g/kg 10.76 (3.16–25.47) NA NP‑SLE, n (%) 19 (27.9) NA Central NP‑SLE, n (%) 16 (23.5) NA Peripheral NP‑SLE, n (%) 3 (4.4) NA Lupus nephritis, n (%) 18 (26.5) NA Antiphospholipid syndrome, n (%) 21 (30.9) NA Sjogren’s syndrome, n (%) 5 (7.4) NA
with SLE without ophthalmologic manifestations and healthy controls. A significant decrease in the pRNFL as well as in the macular photoreceptor layer was observed in patients with SLE.
It is believed that patients with SLE have chronic low-grade CNS inflammation beginning early in the course of the disease [19]. This inflammatory process pro-foundly impacts the continuous crosstalk held between the CNS and the immune system, resulting in the emer-gence of symptoms such as depression, anxiety disorders or psychosis [20]. Its pathophysiology is complex and multifactorial, involving immune complex depositions, autoantibody-mediated neuronal cell damage, inflamma-tory and thrombotic microangiopathy, intrathecal syn-thesis of proinflammatory cytokines and disruption of the blood–brain barrier [4]. This inflammatory microen-vironment ultimately leads to mitochondrial damage and disturbance of neuron-glia metabolic coupling, resulting in a marked reduction in synaptic activity and neuronal death, which are the hallmarks of neurodegeneration [1,
4]. Indeed, the cerebrospinal fluid of patients with SLE
presents increased levels of neurofilament (a neuronal degradation product), Tau (an axonal degeneration prod-uct) and astroglial fibrillary acidic protein (a marker of neuronal damage and gliosis) compared to that of healthy controls [21, 22].
Peripapillary RNFL thinning, specifically involving the temporal sectors, is a proven biomarker of neurodegen-eration in several diseases, such as Alzheimer’s disease [9], Parkinson’s disease [10] or multiple sclerosis [8]. In this study, we documented a significant reduction in the pRNFL in the global, temporal superior and temporal
Table 2 Results of multivariable regression models— dependent variable: pRNFL thickness
*Reference category: control group. Age: for each 10‑year increase. p‑values were obtained by linear regression models
G global, N nasal, NI nasal inferior, NS nasal superior, pRNFL peripapillary retinal
nerve fiber layer, SLE systemic lupus erythematosus, T temporal, TI temporal inferior, TS temporal superior
Model Coefficient
estimate 95% confidence interval p‑value
Dependent variable: pRNFL thickness G
SLE group* − 3.87 − 7.27 to − 0.48 0.026 Male sex − 4.93 − 9.39 to − 0.46 0.031 Age (years) − 2.60 − 3.87 to − 1.32 < 0.001 Axial length (mm) − 2.23 − 3.97 to − 0.49 0.013 Benzodiazepines 7.37 1.70 to 13.04 0.011 Dependent variable: pRNFL thickness TS
SLE group* − 7.94 − 13.64 to − 2.38 0.007 Dependent variable: pRNFL thickness T
SLE group* − 4.14 − 8.03 to − 0.25 0.037 Dependent variable: pRNFL thickness TI
SLE group* − 3.95 − 11.17 to 3.28 0.282 Age (years) − 3.28 − 5.86 to − 0.69 0.013 Dependent variable: pRNFL thickness NI
SLE group* 6.39 − 2.59 to 15.36 0.161 Axial length (mm) − 5.91 − 10.21 to − 1.61 0.007 Dependent variable: pRNFL thickness N
SLE group* − 2.42 − 6.94 to 2.10 0.291 Age (years) − 1.86 − 3.47 to − 0.24 0.025 Dependent variable: pRNFL thickness NS
SLE group* − 7.04 − 14.53 to 0.46 0.065 Age (years) − 3.40 − 6.08 to − 0.72 0.013
Table 3 Results of multivariable regression models for the SLE group—dependent variable: pRNFL thickness
Age: for each 10‑year increase. Corticosteroid is expressed as the daily dose of prednisone equivalent. p‑values were obtained by linear regression models
ACE angiotensin‑converting enzyme, G global, IOP intraocular pressure, N nasal, NI nasal inferior, NS nasal superior, pRNFL peripapillary retinal nerve fiber layer, SLE systemic lupus erythematosus, T temporal, TI temporal inferior, TS temporal
superior
Model Coefficient
estimate 95% confidence interval p‑value
Dependent variable: pRNFL thickness G
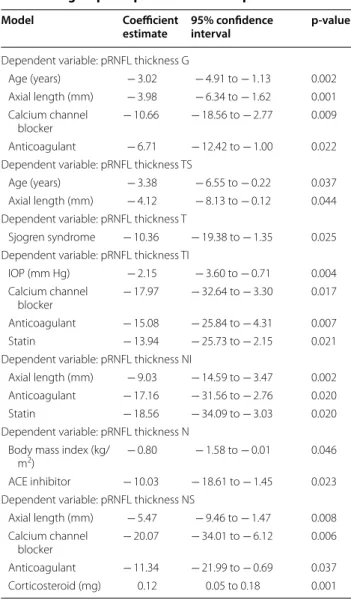
Age (years) − 3.02 − 4.91 to − 1.13 0.002 Axial length (mm) − 3.98 − 6.34 to − 1.62 0.001 Calcium channel
blocker − 10.66 − 18.56 to − 2.77 0.009 Anticoagulant − 6.71 − 12.42 to − 1.00 0.022 Dependent variable: pRNFL thickness TS
Age (years) − 3.38 − 6.55 to − 0.22 0.037 Axial length (mm) − 4.12 − 8.13 to − 0.12 0.044 Dependent variable: pRNFL thickness T
Sjogren syndrome − 10.36 − 19.38 to − 1.35 0.025 Dependent variable: pRNFL thickness TI
IOP (mm Hg) − 2.15 − 3.60 to − 0.71 0.004 Calcium channel
blocker − 17.97 − 32.64 to − 3.30 0.017 Anticoagulant − 15.08 − 25.84 to − 4.31 0.007 Statin − 13.94 − 25.73 to − 2.15 0.021 Dependent variable: pRNFL thickness NI
Axial length (mm) − 9.03 − 14.59 to − 3.47 0.002 Anticoagulant − 17.16 − 31.56 to − 2.76 0.020 Statin − 18.56 − 34.09 to − 3.03 0.020 Dependent variable: pRNFL thickness N
Body mass index (kg/
m2) − 0.80 − 1.58 to − 0.01 0.046
ACE inhibitor − 10.03 − 18.61 to − 1.45 0.023 Dependent variable: pRNFL thickness NS
Axial length (mm) − 5.47 − 9.46 to − 1.47 0.008 Calcium channel
blocker − 20.07 − 34.01 to − 6.12 0.006 Anticoagulant − 11.34 − 21.99 to − 0.69 0.037 Corticosteroid (mg) 0.12 0.05 to 0.18 0.001
sectors in patients with SLE compared to healthy con-trols. This thinning was independent of sex, age, BCVA, IOP, spherical equivalent, axial length, BMI, MAP and systemic medication. Age and axial length were also negatively associated with pRNFL thickness in some sec-tors. A multivariable analysis in the SLE group revealed that patients under chronic medication with anticoagu-lants, statins, angiotensin-converting enzyme inhibitors (ACEIs) and calcium channel blockers (CCBs) had thin-ner pRNFLs. Previous studies of pRNFL in SLE are scarce and had inconsistent results. Shulman et al. found a trend towards lower pRNFL thickness in SLE, without statisti-cal significance. However, their sample was small, includ-ing only 21 patients with SLE and 11 healthy controls [12]. On the other hand, Liu et al. [11], in a study with 31 patients with SLE and 16 healthy controls, reported significant thinning in the global, temporal superior and nasal pRNFL. Additionally, they described a posi-tive correlation between pRNFL thickness in the tempo-ral superior and tempotempo-ral inferior sectors and cognitive
test scores. However, none of the abovementioned stud-ies included a multivariable analysis; thus, the results for pRNFL thickness were not corrected for the effects of confounding factors such as age or axial length.
Macular layers analysis revealed a significant reduc-tion in PR layer thickness in patients with SLE com-pared to healthy controls. Photoreceptors are the
most energy-demanding neurons in the CNS [23].
Their metabolic demands are fulfilled by the choroi-dal circulation, particularly the choriocapillaris. Lupus choroidopathy has been extensively described and is characterized by choroidal vasculitis, as well as com-plement and immunoglobulin deposition in choroi-dal vessels, resulting in long-term choroichoroi-dal ischemia [24]. Changes in choroidal circulation have also been described even in asymptomatic patients [25–27]. Vas-culopathy of the choriocapillary layer may thus result in chronic ischemia of the outer retinal layers, particu-larly the PR, increasing reactive oxygen species produc-tion. This adverse environment reduces mitochondrial Fig. 3 Graphs displaying individual retinal layer thickness in the nine ETDRS areas for the SLE group, the control group and the neuropsychiatric SLE
biogenesis, generating an energy crisis that causes the PR degeneration observed in patients with SLE [1]. Specific autoantibodies targeting photoreceptors are
another proposed mechanism [28]. Destruction of
the PR cell layer has been documented histologically in mouse models of SLE, along with thickening of the wall of the choroidal arterioles and occlusion of the choriocapillaries [29]. Ocular histopathologic reports on patients with lupus are rare in the literature. Cao et al. reported a case with diffuse loss of PR without significant signs of tissue inflammation. Additionally, the optic nerves presented loss of axons and thickened septae, with slight macrophage infiltration and micro-glial accumulation [28]. Thinning of the PR cell layer as
an early sign of retinal neurodegeneration has already been described in other entities, such as diabetes mel-litus and metabolic syndrome, in which microvascular disease assumes a central role in the pathogenesis [30,
31].
Considering patients with SLE only, the multivariable analysis of PR layer thickness revealed that patients with NP-SLE diagnosis had thinner values for the central sec-tor. A higher disease activity index was also negatively associated with PR layer thickness in the central and N3 subfields. Patients with secondary Sjogren’s syndrome presented a thicker PR layer in the central and N3 sec-tors; however, this result must be interpreted with cau-tion since there were only five patients with Sjogren’s syndrome. A thinner PR layer in some sectors of patients under chronic medication with antihypertensives (ACEIs and CCBs) and statins is also worth noting. This analysis suggests that patients with clinical neurological involve-ment as well as those with poor systemic disease control are more prone to PR degeneration. Similar to the pRNFL analysis, patients on chronic medication for hyperten-sion or hypercholesterolemia are more susceptible to PR degeneration, suggesting a deleterious role of cardio-vascular risk factors. A negative association between PR layer thickness and HCQ treatment time was observed in the S6 sector. However, the absence of significant associa-tions in other ETDRS locaassocia-tions or with cumulative HCQ dosage, as well as the absence of characteristic visual field defects and fundus autofluorescence abnormalities, are arguments against the existence of HCQ macular toxicity.
Another interesting finding in this investigation was the pattern of PR layer thinning throughout the course of the disease. PR layer thinning is more marked in those patients with shorter disease duration (up to 5 years), followed by those with intermediate dura-tion and then those with longer disease duradura-tion (more than 10 years). This pattern, which was observed in all ETDRS areas, may be interpreted as a result of retinal remodeling. Remodeling is a process in which the loss of cones and/or rods results in neural retina deaffer-entation, which in turn results in a series of changes to retinal organization [32]. Retinal remodeling has been described following retinal detachment [33], age-related macular degeneration [34] or any other situ-ation where photoreceptors are lost, especially cones [32]. Regardless of the initiating event, the subsequent retinal changes lead to revisions in neuronal morphol-ogy and organization through neuritogenesis and cell migration, reorganization of synaptic connectivity and intracellular molecular processes [32]. This process of retinal plasticity may thus explain the partial recov-ery in PR layer thickness observed with longer disease duration.
Table 4 Results of multivariable regression models for PR layer thickness
*Reference category: healthy control group. p‑values were obtained by linear regression models
PR photoreceptor, Group I up to 5 years of disease duration, Group II 5–10 years, Group III more than 10 years
Model* Coefficient
estimate 95% confidence interval p‑value
Dependent variable: PR layer thickness at S3 sector
Group I − 1.60 − 3.31 to 0.11 0.066 Group II − 1.51 − 3.18 to 0.16 0.076 Group III − 0.53 − 1.84 to 0.78 0.426 Dependent variable: PR layer thickness at T3 sector
Group I − 1.57 − 3.36 to 0.22 0.084 Group II − 1.08 − 2.83 to 0.66 0.222 Group III − 0.86 − 2.23 to 0.51 0.217 Dependent variable: PR layer thickness at I3 sector
Group I − 1.44 − 2.77 to − 0.11 0.035 Group II − 0.79 − 2.10 to 0.51 0.231 Group III − 0.70 − 1.72 to 0.33 0.180 Dependent variable: PR layer thickness at S6 sector
Group I − 1.74 − 3.05 to − 0.43 0.010 Group II − 1.51 − 2.79 to − 0.22 0.022 Group III − 1.20 − 2.21 to − 0.19 0.020 Dependent variable: PR layer thickness at T6 sector
Group I − 1.90 − 3.11 to − 0.68 0.003 Group II − 1.52 − 2.71 to − 0.33 0.013 Group III − 0.95 − 1.88 to − 0.02 0.046 Dependent variable: PR layer thickness at I6 sector
Group I − 1.24 − 2.32 to − 0.15 0.026 Group II − 1.18 − 2.24 to − 0.12 0.029 Group III − 1.04 − 1.88 to − 0.21 0.014 Dependent variable: PR layer thickness at N6 sector
Group I − 1.71 − 2.93 to − 0.49 0.007 Group II − 1.40 − 2.60 to − 0.21 0.022 Group III − 1.18 − 2.11 to − 0.24 0.014
Some studies evaluated subclinical retinal changes in other autoimmune systemic disorders using SD-OCT. A study in patients with rheumatoid arthritis revealed no significant changes in pRNFL or total foveal thickness compared to healthy controls [35]. On the other hand, patients with primary Sjogren’s syndrome present a sig-nificant reduction in pRNFL as well as in macular GCL compared to healthy controls [36]. Patients with Behçet’s disease also present significant thinning in the pRNFL [37]. Patients with neuro-Behçet present not only a reduction in pRNFL but also a reduction in total macu-lar thickness compared to healthy controls [38]. Patients with Susac syndrome present a reduction in pRNFL, par-ticularly in the nasal quadrant. These patients also pre-sent an abnormal foveal contour with a reduction in the thickness of the inner macular layers [39–41].
This study has some limitations. The first is the size of the sample. Despite being the study with the larg-est sample in this field, the sample size may have lim-ited the ability to find differences in some subsets of patients, such as those with NP-SLE. However, sig-nificant thinning in the PR layer was observed in this subgroup in the central ETDRS subfield. Second, our
assessment of disease duration is based on the time of the diagnosis, which, in some cases, may underesti-mate the real time of disease. Finally, retinal segmen-tation was performed by automatic software, which is susceptible to some mistakes. Regarding the pRNFL, decreased scan quality, tilted disc, older age and thin-ner pRNFL tend to underestimate automatic pRNFL thickness measurement. However, this inaccuracy can be significantly reduced by postsegmentation inspec-tion and refinement by a trained operator [42, 43]. Regarding individual macular layer thickness measure-ments, Spectralis segmentation software has proven high repeatability and reproducibility for all layers in all nine ETDRS areas [7, 44]. Nevertheless, its accu-racy may be significantly affected by image quality or marked anatomical distortion [7, 45]. In our study, we only included participants without retinal or optic nerve pathology in whom good quality scans could be obtained. Additionally, detailed inspection and man-ual refinement by an ophthalmologist masked to the patients’ diagnosis was performed whenever segmenta-tion was deemed inaccurate.
Table 5 Results of multivariable regression models for PR layer thickness in the SLE group
No multiple model was achieved for the T6 and I6 sectors. p‑values were obtained by linear regression models
ACE angiotensin‑converting enzyme, HCQ hydroxychloroquine, NP-SLE neuropsychiatric systemic lupus erythematosus, PR photoreceptor, SLEDAI Systemic Lupus
Erythematosus Disease Activity Index
Model* Coefficient estimate 95% confidence interval p‑value
Dependent variable: PR layer thickness at C sector
NP‑SLE − 2.83 − 5.29 to − 0.37 0.025
Sjogren’s syndrome 5.05 0.71 to 9.40 0.023
SLEDAI − 0.29 − 0.51 to − 0.06 0.015
Body mass index (kg/m2) − 0.31 − 0.60 to − 0.02 0.038
Dependent variable: PR layer thickness at S3 sector
Benzodiazepine 2.67 0.35 to 4.99 0.025
Dependent variable: PR layer thickness at T3 sector
Calcium channel blocker − 2.68 − 5.23 to − 0.14 0.039
Dependent variable: PR layer thickness at I3 sector
Statin − 1.84 − 3.48 to − 0.20 0.028
Dependent variable: PR layer thickness at N3 sector
Sjogren’s syndrome 2.38 0.2 to 4.74 0.048
SLEDAI − 0.13 − 0.26 to 0.00 0.050
Statin − 2.44 − 4.15 to − 0.73 0.006
Dependent variable: PR layer thickness at S6 sector
Benzodiazepine 1.95 0.23 to 3.68 0.027
HCQ treatment time (years) − 0.83 − 0.16 to 0.00 0.041
Dependent variable: PR layer thickness at N6 sector
Axial length (mm) 0.53 0.01 to 1.05 0.045
Conclusions
In conclusion, this study, which was the first to per-form a complete SD-OCT segmentation analysis of all retinal layers in patients with SLE, revealed thinning of the pRNFL and PR layer in these patients compared to healthy controls. Based on the existing literature, these changes might constitute an early sign of retinal neurode-generation, probably occurring as a result of an apoptotic process in the context of a chronic low-grade inflamma-tory microenvironment. Further research in this area should try to explore a possible relationship between the findings of this study and changes in structural and func-tional CNS imaging.
Supplementary information
Supplementary information accompanies this paper at https ://doi. org/10.1186/s4094 2‑020‑00219 ‑y.
Additional file 1: Table S1. Pharmacological history of the patients by
group.
Additional file 2: Table S2. Peripapillary retinal nerve fiber layer thickness
(µm) in all seven sectors by group.
Acknowledgements
Not applicable.
Authors’ contributions
ADS: conception and design, acquisition, analysis and interpretation of data, draft of the article; JTF, MFMF: conception and design, acquisition and interpretation of data; SP: acquisition and analysis of the data; JPC: conception and design, interpretation of data; MA, ALP, RP: conception and design and interpretation of data. All authors read and approved the final manuscript.
Funding
A grant for this study was given by José de Mello Saúde—Hospital CUF Descobertas.
Availability of data and materials
The datasets used and/or analyzed during the current study are available from the corresponding author on reasonable request.
Ethics approval and consent to participate
The study was performed in accordance with the Declaration of Helsinki and approved by the institution’s review board. Each patient signed the informed consent form.
Consent for publication
Not applicable.
Competing interests
The authors declare that they have no competing interests.
Author details
1 Department of Ophthalmology, Centro Hospitalar Universitário de Lisboa
Central, Lisbon, Portugal. 2 Department of Ophthalmology, Hospital CUF
Descobertas, Lisbon, Portugal. 3 NOVA Medical School, Universidade NOVA de
Lisboa, Lisbon, Portugal. 4 Autoimmune Disease Unit, Unidade de Doenças
Auto‑imunes/Serviço Medicina 3, Hospital de Santo António dos Capuchos, Centro Hospitalar Universitário de Lisboa Central, Lisbon, Portugal. 5 Epide‑
miology and Statistics Unit, Research Center, Centro Hospitalar Universitário de Lisboa Central, Lisbon, Portugal. 6 CEAUL (Center of Statistics and its
Applications), Lisbon University, Lisbon, Portugal. 7 Autoimmune Disease Unit,
Unidade de Doenças Auto‑imunes/Serviço de Medicina 7.2, Hospital Curry
Cabral, Centro Hospitalar Universitário de Lisboa Central, Lisbon, Portugal.
8 Instituto Gulbenkian de Ciência, Oeiras, Portugal. 9 Department of Oph‑
thalmology, Centro Hospitalar Universitário de Coimbra, Coimbra, Portugal.
10 Faculty of Medicine, University of Coimbra, Coimbra, Portugal. 11 Serviço de
Oftalmologia, Hospital de Santo António dos Capuchos, Alameda de Santo António dos Capuchos, 1169‑050 Lisbon, Portugal.
Received: 2 November 2019 Accepted: 15 April 2020
References
1. Sankowski R, Mader S, Valdés‑Ferrer SI. Systemic inflammation and the brain: novel roles of genetic, molecular, and environmental cues as drivers of neurodegeneration. Front Cell Neurosci. 2015;9:28. https ://doi. org/10.3389/fncel .2015.00028 .
2. Liang MH, Corzillius M, Bae SC, Lew RA, Fortin PR, Gordon C, et al. The American College of Rheumatology nomenclature and case definitions for neuropsychiatric lupus syndromes. Arthritis Rheum. 1999;42:599–608. 3. Unterman A, Nolte JES, Boaz M, Abady M, Shoenfeld Y, Zandman‑Godd‑
ard G. Neuropsychiatric syndromes in systemic lupus erythematosus: a meta‑analysis. Semin Arthritis Rheum. 2011;41:1–11.
4. Dias‑Santos A, Proença RP, Tavares Ferreira J, Pinheiro S, Cunha JP, Proença R, et al. The role of ophthalmic imaging in central nervous system degeneration in systemic lupus erythematosus. Autoimmun Rev. 2018;17:617–24.
5. Zhu CM, Ma Y, Xie L, Huang JZ, Sun ZB, Duan SX, et al. Spatial working memory impairment in patients with non‑neuropsychiatric systemic lupus erythematosus: a blood‑oxygen‑level dependent functional mag‑ netic resonance imaging study. J Rheumatol. 2017;44:201–8.
6. Jeltsch‑David H, Muller S. Autoimmunity, neuroinflammation, patho‑ gen load: a decisive crosstalk in neuropsychiatric SLE. J Autoimmun. 2016;74:13–26.
7. Ctori I, Huntjens B. Repeatability of foveal measurements using spectralis optical coherence tomography segmentation software. PLoS ONE. 2015;10:e0129005.
8. Toledo J, Sepulcre J, Salinas‑Alaman A, García‑Layana A, Murie‑Fernandez M, Bejarano B, et al. Retinal nerve fiber layer atrophy is associated with physical and cognitive disability in multiple sclerosis. Mult Scler. 2008;14:906–12.
9. Cunha JP, Proença R, Dias‑Santos A, Almeida R, Águas H, Alves M, et al. OCT in Alzheimer’s disease: thinning of the RNFL and superior hemiret‑ ina. Graefe’s Arch Clin Exp Ophthalmol. 2017;255:1827–35.
10. Inzelberg R, Ramirez JA, Nisipeanu P, Ophir A. Retinal nerve fiber layer thinning in Parkinson disease. Vis Res. 2004;44:2793–7.
11. Liu GY, Utset TO, Bernard JT. Retinal nerve fiber layer and macular thin‑ ning in systemic lupus erythematosus: an optical coherence tomography study comparing SLE and neuropsychiatric SLE. Lupus. 2015;24:1169–76. 12. Shulman S, Shorer R, Wollman J, Dotan G, Paran D. Retinal nerve fiber
layer thickness and neuropsychiatric manifestations in systemic lupus erythematosus. Lupus. 2017;26:1420–5.
13. Conigliaro P, Triggianese P, Draghessi G, Canofari C, Aloe G, Chimenti MS, et al. Evidence for the detection of subclinical retinal involvement in systemic lupus erythematosus and Sjögren syndrome: a potential association with therapies. Int Arch Allergy Immunol. 2018;177:45–56. 14. Hochberg MC. Updating the American College of Rheumatology revised
criteria for the classification of systemic lupus erythematosus. Arthritis Rheum. 1997;40:1725.
15. Marmor MF, Kellner U, Lai TYY, Melles RB, Mieler WF, Lum F. Recommenda‑ tions on screening for chloroquine and hydroxychloroquine retinopathy (2016 Revision). Ophthalmology. 2016;123:1386–94.
16. Bombardier C, Gladman DD, Urowitz MB, Caron D, Chang CH, Austin A, et al. Derivation of the sledai. A disease activity index for lupus patients. Arthritis Rheum. 1992;35:630–40.
17. Early Treatment Diabetic Retinopathy Study Research Group. Photocoag‑ ulation for diabetic macular edema: early treatment diabetic retinopathy study report number 1. Arch Ophthalmol. 1985;103:1796–806. 18. Spaide RF, Koizumi H, Pozonni MC. Enhanced depth imaging
spectral‑domain optical coherence tomography. Am J Ophthalmol. 2008;146:496–500.
•fast, convenient online submission
•
thorough peer review by experienced researchers in your field
• rapid publication on acceptance
• support for research data, including large and complex data types
•
gold Open Access which fosters wider collaboration and increased citations maximum visibility for your research: over 100M website views per year
•
At BMC, research is always in progress. Learn more biomedcentral.com/submissions
Ready to submit your research? Choose BMC and benefit from:
19. Ramage AE, Fox PT, Brey RL, Narayana S, Cykowski MD, Naqibud‑ din M, et al. Neuroimaging evidence of white matter inflammation in newly diagnosed systemic lupus erythematosus. Arthritis Rheum. 2011;63:3048–57.
20. Kayser MS, Dalmau J. The emerging link between autoimmune disor‑ ders and neuropsychiatric disease. J Neuropsychiatry Clin Neurosci. 2011;23:90–7.
21. Trysberg E, Höglund K, Svenungsson E, Blennow K, Tarkowski A. Decreased levels of soluble amyloid beta‑protein precursor and beta‑ amyloid protein in cerebrospinal fluid of patients with systemic lupus erythematosus. Arthritis Res Ther. 2004;6:R129–36.
22. Trysberg E, Nylen K, Rosengren LE, Tarkowski A. Neuronal and astrocytic damage in systemic lupus erythematosus patients with central nervous system involvement. Arthritis Rheum. 2003;48:2881–7.
23. Ames A. Energy requirements of CNS cells as related to their function and to their vulnerability to ischemia: a commentary based on studies on retina. Can J Physiol Pharmacol. 1992;70:S158–64.
24. Nag T, Wadhwa S. Vascular changes of the retina and choroid in systemic lupus erythematosus: pathology and pathogenesis. Curr Neurovasc Res. 2006;3:159–68.
25. Gharbiya M, Pecci G, Baglio V, Gargiulo A, Allievi F, Balacco‑Gabrieli C. Indocyanine green angiographic findings for patients with systemic lupus erythematosus nephropathy. Retina. 2006;26:159–64. 26. Altinkaynak H, Duru N, Uysal BS, Erten Ş, Kürkcüoğlu PZ, Yüksel N, et al.
Choroidal thickness in patients with systemic lupus erythematosus ana‑ lyzed by spectral‑domain optical coherence tomography. Ocul Immunol Inflamm. 2015. https ://doi.org/10.3109/09273 948.2015.10067 90. 27. Baglio V, Gharbiya M, Balacco‑Gabrieli C, Mascaro T, Gangemi C, di Franco
M, et al. Choroidopathy in patients with systemic lupus erythematosus with or without nephropathy. J Nephrol. 2011;24:522–9.
28. Cao X, Bishop RJ, Forooghian F, Cho Y, Fariss RN, Chan C‑C. Autoimmune retinopathy in systemic lupus erythematosus: histopathologic features. Open Ophthalmol J. 2009;3:20–5.
29. Nakamura A, Yokoyama T, Kodera S, Zhang D, Hirose S. Ocular fundus lesions in systemic lupus erythematosus model mice. J Jpn Ophthalmol Soc. 1998;102:8–14.
30. Tavares Ferreira J, Alves M, Dias‑Santos A, Costa L, Santos BO, Cunha JP, et al. Retinal neurodegeneration in diabetic patients without diabetic retinopathy. Investig Ophthalmol Vis Sci. 2016;57:6455–60.
31. Karaca C, Karaca Z. Beyond hyperglycemia, evidence for retinal neu‑ rodegeneration in metabolic syndrome. Investig Ophthalmol Vis Sci. 2018;59:1360–7.
32. Jones BW, Pfeiffer RL, Ferrell WD, Watt CB, Marmor M, Marc RE. Retinal remodeling in human retinitis pigmentosa. Exp Eye Res. 2016;150:149–65. 33. Lewis GP, Linberg KA, Fisher SK. Neurite outgrowth from bipolar and hori‑
zontal cells after experimental retinal detachment. Investig Ophthalmol Vis Sci. 1998;39:424–34.
34. Sullivan R, Penfold P, Pow DV. Neuronal migration and glial remodeling in degenerating retinas of aged rats and in nonneovascular AMD. Investig Ophthalmol Vis Sci. 2003;44:856–65.
35. Tetikoglu M, Temizturk F, Sagdik HM, Aktas S, Ozcura F, Ozkan Y, et al. Evaluation of the choroid, fovea, and retinal nerve fiber layer in patients with rheumatoid arthritis. Ocul Immunol Inflamm. 2017;25:210–4. 36. Yang JM, Sung MS, Ji YS, Heo H, Park SW. Analysis of clinical factors
associated with retinal morphological changes in patients with primary sjögren’s syndrome. PLoS ONE. 2016;11:e0157995.
37. Oray M, Onal S, Bayraktar S, Izgi B, Tugal‑Tutkun I. Nonglaucomatous local‑ ized retinal nerve fiber layer defects in Behçet uveitis. Am J Ophthalmol. 2015;159:475–481.e1.
38. Ucar D, Uygunoglu U, Dikkaya F, Yıldırım Y, Yuksel‑Elgin C, Saip S, et al. Retinal nerve fiber layer structure abnormalities in patients with Neuro‑ Behcet’s disease. Graefe’s Arch Clin Exp Ophthalmol. 2015;253:1181–5. 39. Brandt AU, Zimmermann H, Kaufhold F, Promesberger J, Schippling S, Finis D, et al. Patterns of retinal damage facilitate differential diagnosis between Susac syndrome and MS. PLoS ONE. 2012;7:e38741. 40. Bernard JT, Romero R, Agrawal K, Jager R, Rezania K. Optical coherence
tomography in Susac’s syndrome. Mult Scler Relat Disord. 2014;3:110–6. 41. Ringelstein M, Albrecht P, Kleffner I, Bühn B, Harmel J, Müller AK, et al.
Retinal pathology in Susac syndrome detected by spectral‑domain opti‑ cal coherence tomography. Neurology. 2015;85:610–8.
42. Mansberger SL, Menda SA, Fortune BA, Gardiner SK, Demirel S. Auto‑ mated segmentation errors when using optical coherence tomography to measure retinal nerve fiber layer thickness in glaucoma. Am J Ophthal‑ mol. 2017;174:1–8.
43. Ye C, Yu M, Leung CKS. Impact of segmentation errors and retinal blood vessels on retinal nerve fibre layer measurements using spectral‑domain optical coherence tomography. Acta Ophthalmol. 2016;94:e211–9. 44. Çetinkaya E, Duman R, Duman R, Sabaner MC. Repeatability and repro‑
ducibility of automatic segmentation of retinal layers in healthy subjects using Spectralis optical coherence tomography. Arq Bras Oftalmol. 2017;80:378–81.
45. Balasubramanian M, Bowd C, Vizzeri G, Weinreb RN, Zangwill LM. Effect of image quality on tissue thickness measurements obtained with spectral domain‑optical coherence tomography. Opt Express. 2009;17:4019.
Publisher’s Note
Springer Nature remains neutral with regard to jurisdictional claims in pub‑ lished maps and institutional affiliations.