MERGERS AND ACQUISITIONS:
THE CASE OF COMCAST AND TIME WARNER CABLE
Victor Chia Chissamba
Advisor: Peter Tsvetkov
Dissertation submitted in partial fulfilment of requirements for the degree of MSc in
Business Administration, at Universidade Católica Portuguesa
III
ABSTRACT
Comcast and Time Warner Cable (TWC) merger has been a daily headline in the US business press since the merger announcement in last February 13th of 2014. Meanwhile many questions are raised about the transaction, either in terms of legal issues or in terms related to the strategy fit and financial accretive. These questions are motivated due to the size of both companies in industry where they operate, that leads to witness the largest merger in such industry and the emergence of a potential monopoly. Nevertheless, the constant increasing of the competition in communication, entertainment and media sector and technology, forces the companies to act strategically in order for them not to be behind the market trends as well as the US economy growth. In the meantime, the most common strategy found by companies to take advantage from the opportunities and threats that come from those factors is the merger approach.
This dissertation stresses the value created through the combination of both Comcast and Time Warner Cable using the firm valuation tools and regards M&A concepts. Thus, with regards to those tools and the companies’ information, the conclusions indicated an unevaluated TWC’s closing share price before the merger announcement. Additionally, the acquisition of TWC creates 6% of synergies for TWC shareholders and 3% of synergies for Comcast shareholders at a SVAR of 2%. In turn, an offer at 6% premium over TWC’s market capitalization (February 12th) will be proposed with 100% in stock-for-stock.
v
Acknowledgement
The author owes a very great debt of thanks to: Advisor Peter Tsvetkov, for the continued monitoring and valuable subsidies he has provided as well as his willingness of being available to discuss any point related to this work; Universidade Católica de Angola for the opportunity to take this master; the unconditional support of his family; the energy given by friends and finally God as the main source of all inspirations that make this work possible.
vii
Table of Contents
1. INTRODUCTION ... 1
2. LITERATURE REVIEW ... 3
2.1. Valuation Methods ... 3
2.1.1. Discounted Cash Flow approach ... 4
2.1.1.1. Estimation of Discount Rates ... 4
2.1.1.1.1. Estimating the Cost of Capital ... 5
2.1.1.1.1.1. Cost of Equity (Re) ... 5
2.1.1.1.1.1.1. Risk-Free Rate (Rf) ... 6
2.1.1.1.1.1.2. Beta (β) ... 6
2.1.1.1.1.1.3. Market risk Premium (Rm-Rf) ... 7
2.1.1.1.1.2. Cost of Debt (Rd)... 7
2.1.1.2. Free Cash Flow to the Firm Model ... 8
2.1.1.2.1. Expected Growth Rate and Terminal Value ... 8
2.1.1.3. Adjusted Present Value (APV) ... 9
2.1.1.3. Relative Valuation (Multiples) ... 10
2.2. M&A related issues... 11
2.2.1. Acquisition Categories ... 11
2.2.3. Synergies ... 12
2.2.4. Methods of Payment ... 13
2.2.5. Return on M&A Transaction ... 13
2.3. Conclusion ... 14
3. Industry and Company Analysis... 15
3.1. Overview of the US Entertainment, Media and Communications Sector ... 15
3.2. Comcast Corporation... 16
3.2.1. Comcast Cable ... 16
3.2.2. NBC-Universal ... 18
3.2.3. Revenues ... 19
3.2.4. Costs and Expenses ... 21
3.2.5. Capital Expenditure ... 21
3.2.6. Net Income ... 22
3.2.7. Free Cash Flow... 23
viii
3.3.1. Residential Services ... 24
3.3.2. Business Services ... 25
3.3.3. Revenues ... 26
3.3.4. Costs and Expenses ... 28
3.3.5. Capital Expenditure ... 28
3.3.6. Net Income ... 29
3.3.7. Free Cash Flow... 30
4. Performance of both companies in the stock market ... 31
5. Performance Forecast ... 32 5.1. DCF Valuation ... 32 5.1.1. Standalone Valuation ... 33 5.1.1.1. Comcast Corp ... 33 5.1.1.1.1. Revenues ... 33 5.1.1.1.2. Operating Expenses ... 35 5.1.1.1.3. Tax Rate ... 35
5.1.1.1.4. Depreciation and Amortization ... 35
5.1.1.1.5. Capital Expenditure ... 36
5.1.1.1.6. Net Working Capital ... 36
5.1.1.1.7. Financial Leverage and Cost of Capital ... 36
5.1.1.1.8. Sensitivity Analysis ... 38
5.1.1.1.9. Comparable Valuation ... 38
5.1.1.2. Time Warner Cable Inc ... 39
5.1.1.2.1. Revenues ... 40
5.1.1.2.2. Operating Expenses ... 41
5.1.1.2.3. Tax Rate ... 41
5.1.1.2.4. Depreciation and Amortization ... 41
5.1.1.2.5. Capital Expenditure ... 41
5.1.1.2.6. Net Working Capital ... 41
5.1.1.2.7. Financial Leverage and Cost of Capital ... 42
5.1.1.2.8. Sensitivity Analysis ... 42
5.1.1.2.9. Comparable Valuation ... 43
6. Valuation of the Merged Entity ... 44
ix
6.3. Valuation of the Merged Entity with Synergies ... 44
6.3.1. Operating synergies ... 44
6.3.3. Integration Costs ... 45
6.3.4. Value of Synergies ... 46
7. The Acquisition Process ... 47
7.1. Type of Acquisition ... 47
7.2. Premium offered and SVAR ... 47
7.3. Method of Payment ... 48
7.4. The deal proposal ... 49
7.5. Legal concern ... 49
8. Conclusions ... 50
9. Appendices ... 51
xi
LIST OF APPENDIXES
Appendix 1: Recent development in the Entertainment and Media Industry……….….………..51
Appendix 2: Comcast and TWC Market Area………...…….52
Appendix 3: Companies’ SWOT Analysis……….…53
Appendix 4: Ratings, Interest Coverage Ratios and Default Spread (US companies)……….……..54
Appendix 5: Unlevered beta by Industry in US……….……..….54
Appendix 6: Historical and Expected Comcast’s Balance Sheet……….……….55
Appendix 7: Historical and Comcast’s Income Statement………..…….…………55
Appendix 8: Comcast’s Valuation Data………..…..………….…57
Appendix 9: Comcast’s Base-case Valuation ………..…..………...58
Appendix 10: Comcast’s Bull Case Valuation………..………59
Appendix 11: Comcast’s Bear Case Valuation ………..……...………….60
Appendix 12: Historical and Expected TWC’s Balance Sheet………..…………..…….61
Appendix 13: Historical and Expected TWC’s Income Statement………..…..………..62
Appendix 14: TWC’ Valuation Data………...……….63
Appendix 15: TWC’s Base-Case Valuation………..………..64
Appendix 16: TWC’s Bull Case Valuation……….65
Appendix 17: TWC’S Bear Case Valuation………..…………66
Appendix 18: Historical and Expected Balance sheet of Merged Entity without Synergies………….…….67
Appendix 19: Historical and Income Statement sheet of Merged Entity without Synergies………….…..68
Appendix 20: Merged Entity value without synergy ………..……..…………..69
Appendix 21: Historical Income Statement of Merged Entity ………..……….70
xiii
LIST OF TABLES
Table1: Number of Customers by segment……….………34
Table2: Comcast’s weighted average beta……….……….37
Table3: Peer group multiple (US telecommunication, media and entertainment industry)……..………39
Table4: Price target using multiple………...39
Table 5: Selected Subscribers-statistics……….40
Table 6: Peer group multiple (Cable TV industry)……….……….43
Table7: Price target using multiple……….…………..43
Table8: Synergies by categories ……….………46
xv
LIST OF FIGURES
Figure 1: Breakdown of Cable Communications Customers in millions……….16
Figure 2:Multi-channel video providers………17
Figure 3: US Internet Market Share (2013)………...…….18
Figure 4: US Cable television Market Share……….18
Figure 5: Breakdown of Revenues by division in $b………..19
Figure 6: Breakdown of Costs and Expenses by division in $b………..21
Figure 7: Breakdown of Capital Expenditure by divisions in $ millions……….…..22
Figure 8: Net income ($ millions)……….22
Figure 9: Free cash flows ($ millions)………..23
Figure 10: Breakdown of Residential Subscribers (in thousands)………24
Figure 11: Breakdown of Business Services subscribers (in thousands)………....25
Figure 12: Breakdown of Revenues in $ millions………..27
Figure 13: Breakdown of costs and expenses in $ millions……….…..27
Figure 14: Breakdown of Capital Expenditure in $ millions………..…29
Figure 15: Net income in $millions………..………..29
Figure 16: Free cash flows in $millions………..………..30
Figure 17: Historical Share price (2013-2014)………..…...31
xvii
LIST OF ABBREVIATIONS
APV Adjusted Present Value
β Beta
βL Levered Beta
βU Unlevered Beta
CAGR Compound Annual Growth Rate CAPEX Capital expenditures
CAPM Capital Asset Pricing Model
D Debt
DCF Discount Cash Flow DOJ Department of Justice
E Equity
EBIT Earnings Before Interest and Taxes
EBITDA Earnings Before Interest, Taxes, Depreciation and Amortization
EV Enterprise Value
FCC Federal Communication Commission FCF Free Cash Flow
FCFF Free Cash Flow to the Firm
g Growth Rate
M&A Merger and Acquisition
NASDAQ National Association of Securities Dealers Automated Quotations NBC National Broadcasting Company
NOPLAT Net Operating Profit Less Adjusted Taxes NYSE New York Stock Exchange
P/E Price-to-Earnings Ratio P/Sales Price-to-Sales Ratio
Rd Cost of Debt
Re Cost of Equity
xviii Rm-Rf Market Risk Premium
ROE Return on Equity
ROIC Return on Invested Capital SVAR Shareholders Value at Risk
Tc Corporate Tax
TV Television
TWC Time Warner Cable
1
1. INTRODUCTION
This dissertation is guided under the M&A arena. Its aim is to examine the announced merger of Comcast and Time Warner Cable through a deep analysis of each firm on standalone basis and the output generated by the combination of both. However, to do so this work was split into several topics.
The first section is the literature review. This chapter analyses the methodology to be applied on valuation process taking into account the existing literature regarding the valuation approaches as well as the theories related to the M&A. Afterwards, will be given an overview about the industry, where the historical information about the performance of the two firms is reviewed. Based on this information the valuation of each firm will be performed in order to find the value of each other. Afterwards, the result of both companies on standalone basis are put together; hence will be assessed the value of combined firms with potential synergies and look to the value created for Comcast’s shareholders and TWC´s shareholders. Finally, the category of acquisition, method of payment and the proposal as well as some legal issues will be analysed.
3
2. LITERATURE REVIEW
There are several purposes of mergers and acquisitions. According to Wassertein (2001), regulatory and political reform, technological change, fluctuations in financial markets, the role of leadership, and the tension between scale and focus; are the main forces driving the merger process. Moreover, the general purposes of mergers and acquisitions are to generate value creation for the new built companies and to diversify their operational domains.
There are some controversies behind M&A, both in the academy and in the popular business press. Some argue that many deal ends up injuring the acquirer’s shareholders (Sirower and Sahni, 2006). The additional value that is generated by combining two firms that would not be available if these firms were operated independently is called synergy (Damodaran , 2005). Therefore, the values of the created synergy is evaluated through taking into consideration the stand alone value of the acquiring firm, value of target firm and compare these values with the value generated by the combined firm. The merger creates value for the shareholders if the value of the combined firm is higher than the value of the two firms separately.
Through this literature review we will strive to provide the relevant valuation tools in order to valuate both the acquirer firm and the target company and finally we will look at some issues related to the M&A transactions.
2.1. Valuation Methods
The profitability of M&A depends critically on our confidence in the methods and measures from which extract insights (Bruner, 2004). Meanwhile, there are several methods of valuation; the biggest challenge faced by analysts and managers is to choose the appropriate approach to do so. According to Luehrman (1997), the question of which valuation technique to use has always come down to a pragmatic comparison between several alternatives.
The key issue, related to the valuation methods is to estimate the value of the company. Nevertheless, how a company estimates value is a critical determinant of how it allocates resources (Luehrman, 1997). At the same time Luehrman argues that cash, timing and risk have been a function of fundamental factors in valuation.
According to Hitchner (2003), there are three lines to value any asset or business: the income approach, the market approach and the asset approach. We can find several methods related to each
4
approach. For instance, in income approach, we can use DCF method or a capitalized cash flow method. Under the market approach, we can use multiples derived from transactions both public and private. In asset approach, we must choose between valuing just each category of asset individually or as a collective group. Young, et al. (1999), considered that there are four main models: Dividend Model, Discount Cash Flow method, Economic Value Added and Dynamic ROE. In other words, these models consist in Cash-Flow approach, Return-Based approach and comparable (multiples). Therefore, when emerges a new business opportunity to invest on, the question underlying to the issue is to know which method makes sense. At the same logic, Luehrman (1997) argues that a simple option-pricing model could be regarded, whereas it handles simple contingencies better than standard DCF model.
Despite of numerous techniques available to value a company, the most used method around the world is the DCF model. According to Fernández (2013), the discount cash flow method is widely used because it is the only conceptually correct valuation method. On the other hand, Kaplan and Ruback (1996) found that the most reliable methods that estimate the value of the company were obtained by using the Discount Cash-Flow and the comparable methods together.
2.1.1. Discounted Cash Flow approach
The DCF approach has its foundation in the present value of future cash-flows generated by any asset. In discount cash flows model, we attempt to estimate the intrinsic value of an asset based on its fundamental value (Damodaran, 2012). According to Luehrman (1997), all discounted-cash-flows, require forecasting future cash-flow and then discounting them to their present value at a rate that reflects the respective risk.
The reliability of DCF valuation depends on the accuracy of the cash flow projections and risk measures, and on the realism of the assumptions used in computing an appropriate discount rate, including the historical measure of the risk premium (Ruback, 2004).
2.1.1.1. Estimation of Discount Rates
In order to have the cash-flows discounted to their present value, a plausible rate to do so is needed. Meanwhile this rate is called discount rate and is commonly called cost of capital, which is determined through using Capital Asset Pricing Model (CAPM) or the Average Cost of Capital (WACC). In fact, the discount rate must reflect the riskiness associated to those future cash-flows, (Luehrman, 1997).
5 2.1.1.1.1. Estimating the Cost of Capital
The DCF approach requires estimates of the cost of capital, the level of cash flow and investment (Young, et al., 1999). Furthermore, the cost of capital is regarded as an indispensable driver in DCF method, whereas it represents the opportunity cost that investors face for investing their money in a business instead of other with similar risk (Koller, et al., 2010). For a long time many business schools and researchers have argued that the value of a company also depends on its capital structure, which can differ from company to company. Meanwhile, when we are estimating the cost of capital it must reflect the Weighted Average Cost of Capital (WACC). Therefore, the value of the firm is obtained by discounting the FCF to the firm at the WACC, (Damodaran, 2012).
In fact, the WACC requires to be estimated from debt and equity by weighting the market-determined cost of debt and equity with the respective proportional claims of each. In addition, tax benefits of debt and the additional risk associated with debt are embedded in WACC (Damodaran, 2012).
(2.1)
Despite of the WACC being the most used discount rate, some controversial arguments have appeared. For instance, Luehrman (1997) argues that considering the weighted average cost of capital as a discount rate factor is obsolete due to its weak performance in valuation. In most common formulations, WACC addresses tax effect only very convincingly for simple capital structure (Luehrman, 1997).
2.1.1.1.1.1. Cost of Equity (Re)
According to Sharp (1964), the investor achieves a higher expected rate of return only by incurring additional risk through the time of price and the price of risk. At the same time, Sharp (1964) and Lintner (1965) through the CAPM, demonstrated that the return of an asset corresponds to the sum of risk-free rate and the risk-premium, which is positively related to firm and industry betas (Kaplan and Ruback, 1996).
The CAPM becomes an important vehicle, widely used in applications, such as evaluating the performance of managed portfolios and estimating the cost of capital, which is the focus of this
6
chapter. In the same reasoning, Kaplan and Ruback (1996), argue that Cash flows are discounted to the present values using a market-based rate which is generally based on the Capital Asset Pricing Model (CAPM).
(2.2)
We can conclude that the CAPM is lined by risk-free (Rf), risk premium (Rm) and beta (β). The beta will take two different terminologies, such as, levered beta (ΒL) for levered firm and unlevered beta
(βU) unlevered firm.
2.1.1.1.1.1.1. Risk-Free Rate (Rf)
Risk free rate acts as the reference point for an asset returns. In fact, as a risk free rate of return it should be used as a measurement instrument of return on an asset whose return is completely without uncertainty (Vaihekoski, 2009).
The debate behind the issue is regarding the choosing of the right risk free rate to be considered in CAPM. For instance, Kaplan and Ruback (1996), thought to use as an appropriate risk free the long term Treasury bond with almost 20 years of maturity. Besides, Fernández (2004) sustains that the correct Rf is the Yield of long-term government bond at
the time of calculating the cost of equity.
2.1.1.1.1.1.2. Beta (β)
Despite of others things, the cost of capital depend on the accuracy of the beta estimate (Kaplan and Peterson, 1998). In fact, the beta is the systematic risk of a security that represents the risk that the investment adds to a market portfolio and can be estimated through three approaches: One is using historical data on market prices for individual investments; the second is to estimate the betas from the fundamental characteristics of the investment; and the third is to use accounting data (Damodaran, 2012).
In the meantime, the conventional method to estimate this parameter through the first approach is a regression of returns on an investment against returns on a market index (Damodaran, 2012). For stocks that are less liquid, Pettit (1999), suggest that a beta could be estimated using an average of unlevered beta of a pure-play peers; and alternatively, a
7
beta could be built as the product of an industry portfolio correlation coefficient and a company-specific relative volatility coefficient. Furthermore, when there are no pure-play peers companies, a segment beta regression can be employed, (Pettit, 1999). Besides, Kaplan and Peterson (1998) found that the estimation of pure-play industry betas were upwardly biased, due to the lower full-information industry betas, comparing to the market-capitalization weighted pure-play beta. Meanwhile Kaplan and Peterson (1998) arguments, suggest that the noticeable betas for those firms who operate in more than one segment of business are weighted averagely on the unobservable beta of the individual operations.
Based on Hamada formula, Damodaran (2012) argues that if all firm’s risk is borne by the stockholders, and debt has a tax benefit to the firms, the levered beta for equity in the firm is:
(2.3) [ ]
2.1.1.1.1.1.3. Market risk Premium (Rm-Rf)
When investors decide to invest in some business or project, they require the risk premium associated with their investment with the same level of systematic risk as the stock market (Kaplan and Ruback, 1996).
Kaplan and Ruback (1996) argue that it is reasonable to take into consideration the arithmetic average historical risk premium calculated from the arithmetic average return spread of an index ( for example S&P 500) and long term treasury bonds.
2.1.1.1.1.2. Cost of Debt (Rd)
When a firm finances its project by borrowing funds, it incurs in costs of being financed. The rate at which the firm can borrow these funds, adjusted for any tax advantages of borrowing is the cost of debt (Damodaran, 2012). Additionally Damodaran argues that we can estimate the cost of debt by using the companies’ ratings and associated default spreads that are normally given by independent rating agencies. On the other hand, to estimate the after-tax cost of debt, we need to consider that interest expenses are tax deductible.
8
2.1.1.2. Free Cash Flow to the Firm Model
Free cash flow is a company’s true operating cash flows (Copeland, et al., 2000). At the same time, Damodaran (2012) argues that the free cash flow to the firm implies the sum of the cash flow to all rights holders in the firm. Meanwhile, to achieve the free cash flow to the firm, we need to estimate the cash flow earlier to each of these rights and discount the obtained cash flow at the weighted average cost of capital (Damodaran, 2012).
(2.5) ∑ [ ]
Behind the formula presented in (2.4), Damodaran (2012) contend that the value of free cash flows to the firm is estimated taking into consideration the following reasoning:
(2.6)
In fact, the value of cash flow embodies the total after-tax cash flow generated by the company that is available to both creditors and shareholders (Copeland, T. et al., 2000). Besides, Kaplan and Ruback (1996), argues that the projection of Cash flows is typically for the next five years and implies a terminal value (Young, et al., 1999).
2.1.1.2.1. Expected Growth Rate and Terminal Value
In order to avoid forecast in detail the company’s cash flow over an extended period, we use the terminal value (Copeland, et al., 2000). The terminal value is obtained by computing a terminal cash flow and assuming that cash flow would grow at a constant nominal rate at perpetuity, (Kaplan and Ruback, 1996). At the same time, the bulk of capital expenditures should follow the depreciation and amortization amount proportionally (Kaplan and Ruback, 1996).
Thus, when we are using the enterprise DCF model to estimate the terminal value, Copeland, T.et al, (2000) recommend the formula below.
9
Additionally, if we simply use the simple formula approach, the result will be the same by using the formula above.
(2.8)
According to Damodaran (2012), if a firm has a stable growth, a perpetual model can be used to estimate the terminal value.
Copeland, et al., (2000) argue that the recommended estimate is the expected long-term rate whereas few companies can be expected to grow faster than the economy. Moreover, to understand how the growth rate affects the value estimates, sensitivity analysis is required to be done (Copeland, et al., 2000).
2.1.1.3. Adjusted Present Value (APV)
Given some disadvantages behind the WACC metric, Myers (1974), suggested the Adjusted Presented Value (APV) as a better approach to evaluate investments opportunities. In fact, APV, beyond evaluating how much an asset is worth, it can also help to understand where the value comes from (Luehrman, 1997).
According to Luehrman (1997), APV consists of analysing financial manoeuvers in parts, and add their value to the corresponding business. Meanwhile, APV approach, values a firm as a sum of two pieces (Kaplan and Ruback, 1996). The first one is related to the firm as an unlevered, which is calculated by discounting the expected cash flows that would accrue to an unlevered firm at appropriate, unlevered cost of capital. The second piece is the value added by a firm’s choice of capital structure, which comes in the form of interest tax shield. Nonetheless, when APV technique is examined; we assume that the first benefit of borrowing is a tax benefit and the most relevant cost of borrowing is the added bankruptcy risk (Damodaran, 2012).
10 (2.10)
Notwithstanding, some limitations regarding the APV approach has been identified by different academics. For instance, Luehrman (1997) highlights two limitations that introduce consistent biases in analysis, such as: the income from stocks can be taxed in different ways when the investor records a personal tax return and the negligence of costs of financial distress and other interesting financial side effects as well.
Nevertheless, Luehrman (1997) says that APV is optionally transparent; hence; it is more informative; and believes that it will replace WACC as the DCF methodology of choice among generalists.
2.1.1.3. Relative Valuation (Multiples)
Valuation by multiples requires computing a specific comparable for a set of benchmark companies and then finding the implied value of the company (Lie and Lie, 2002). Indeed, the questions behind multiples are related on how to set the benchmark companies, which is the appropriate comparable and how can this be applied. Comparing a company´s multiples with those outside of the company can help us to stress-test the accuracy of DCF valuation (Goedhart et al., 2005).
Goedhart et al. (2005) recommend four principles that could help companies to apply multiples correctly: the use of peers with similar ROIC and growth projections, forward-looking multiples, enterprise-value multiples and the adjustment of enterprise-value multiples for non-operating items.
The P/E ratio is widely used as a multiple. Nonetheless, its a huge usage, P/E multiples have flaws of being systematically affected by capital structure and the inclusion of several non-operating items that are incorporated in earnings (Goedhart et al., 2005). For this reason, Goedhart et al., (2005) suggest to use enterprise value (EV) to EBITDA multiple adjusted for non-operating items. In the meantime, Foushee et al. (2012) have found that EV multiples
11
either EV/EBIT or EV/EBITDA are more preferable because they are not burdened with the alterations that affect the earnings ratios.
To transform multiples into valuation estimates, we need to multiply the relevant financial trend or underlying profits by the average multiple (Young, M. et al, 1999) assuming that these values are constant. In fact, the precision and bias of value estimate, as well as the relative performance of multiplies, differ by company size, company profitability, and the magnitude of intangible value in the company (Lie and Lie, 2002).
2.2. M&A related issues
As we mentioned at the beginning, the main idea behind M&A is to create shareholders value over and above that of the sum of the two companies. Mergers and acquisitions often create winners and losers at different levels of both the acquiring companies and the target companies. But still play a significant role in the survival and vitalization of corporations today; therefore to make it happen, we need a reasonable understanding of all the processes involved in that operation. According to Very and Schwiger (2001) this process embody a delineation of an acquisition strategy; identifying, selecting, and analysing acquisitions candidates; arranging contact with target firm managers and owners; valuing and pricing targets; structuring deals and integrating acquisitions. In fact this process represents a factor of strategic fit that has an impact on the outcome (Risberg, 2003). 2.2.1. Acquisition Categories
Damodaran (2012) says that an acquisition can be achieved in the form of a merger, a consolidation, a tender offer, an acquisition of assets and finally through management buyout. In the merger a target firm is absorbed by the acquiring entity. In a consolidation both the acquiring firm and target firm lose their old entities through creating a new firm through stockholders approval from both entities. In a tender offer the target firm continues as an individual entity as long as some stockholders walk away from the deal. In the acquisition of assets, the acquiring firm buys the target firm’s asset and at end the target firm is liquidated. In management buyout, a company is purchased by the management or outsider investors, commonly with tender offer. At end of the transaction the firm is, however, turned into a private business.
12
Moreover, in order to understand the merger economic function dependency, the purpose behind the transaction and the relation between the merging companies; Ross et al. (2003) indicate three types stated of acquisition: the vertical, horizontal and conglomerate acquisitions. In a vertical acquisition, the acquiring firm and target firm operate at different levels within an industry supply chain. Horizontal acquisition occurs when the companies operate in the same space as well as in the same industry. The conglomerate acquisition happens when two unrelated firms marry.
Furthermore, the mergers are generally friendly to the target firm while the tender offer tends to be characteristically hostile (Loughran & Vijh, 1997). Stahl and Voight, 2005 claim that for a high level of integration, the acculturation is crucial for M&A success. Finally Damodaran, 2012 argues that the acquisition procedure should be based on five elements: Specify the reasons for acquisitions select the target firm, value the target firm and lastly the method of payment.
2.2.3. Synergies
As stated in the beginning, synergy implies that the outcome resulting from the merger of two companies will be higher than the sum of outcome that would have been achieved separately. In fact, companies attempt to achieve those synergies through different ways, taking into consideration the strategic fit and financial engineering. Conferring Copeland et al. (2002) the worth of the acquiring firm and target firm depends on the type of synergy and who oversights it.
According to Bruner (2004) Synergies contain costs savings, revenue enhancement and financial synergies – Synergy matching principle (Sirower and Sahni, 2006). At the same time Damodaran (2005) summarises these synergies into two parts: Operating Synergy and Financial Synergy. Operating synergies enable firms to explore their operating income from existing asset through economies of scale (more cost efficiency and gainful), greater pricing power (higher margins and operating income), combination of different functional strengths and a higher growth in new or existing market (intensification in sale of products or services). In financial synergies the remuneration comes from either a combination of both higher cash flows and lower cost of capital or each one individually. The financial synergies can be reached through a combination of a firm with excess cash, or slack (higher value of
13
the new firm), increase the debt capacity (tax benefit and low cost of capital), ease of diversification and Tax benefits.
After having the synergies identified, the next step is to value them according to an appropriate method. Many books recommend the famous DCF as the appropriate approach. However, beforehand firms are valuated separately and after we estimate the value of the combined firm without synergy. Finally we introduce the effect of synergies into combined firm without synergy to determine the value of united entities with synergies. The value of synergy will be the difference between the value of the combined with synergy and the combined firm without synergy (Damodaran, 2005). Furthermore the value of synergy can be an effective concept if it is based in reality (Weston et al., 1990). 2.2.4. Methods of Payment
For the acquisition, a firm can use pure cash, pure stock, or mix (cash with stock) as a method of payment (Loughran and Vijih, 1997). Nevertheless our debate in this session is to understand when the acquisition is done by each model and its impact on shareholders’ value.
According to Burner (2004), when the payment is in cash, target shareholder return is slightly positive and in situations where the payment is in stock, acquirer shareholder return is significantly lower. Likewise in case of tender offers financed in cash, the returns to buyers are higher. However, when paid in stock the returns are lower. At the same time, Rappaport and Sirower (1999) contend that the trade-offs of cash versus stock is based on risk sharing. Nevertheless, in cash payment the shareholders of the acquiring firm bear all synergy risk, while in stock payment the risk is shared in the same dimension. Moreover Damodaran (2012) claim three factors to be taken into account before deciding cash or stock: the liquidity available, the perceived value of the stock and the tax factor. Additionally, Zenner el al. (2008) argues that acquirers tend to pay in cash instead of stock. On other hand, the target firm prefers payment in stock.
2.2.5. Return on M&A Transaction
Many academics and researchers argue that M&A often benefit the sellers and destroy the acquiring shareholders’ value. Therefore, when their market capitalization changes are combined, there is 1% value created at announcement (Sirower and Sahni, 2006).
14
Since the private equity can increase shareholder value rather than public companies due to its own characteristics, Shivdasani and Zak (2007) suggest a replication of the private equity model for public companies, but without ignoring the pressure of public equity market.
Loughran and Vijh(1997) contend that the disciplining of target managers may cause an effect to the shareholder returns from the acquisition. On the other hand, the returns of shareholders’ acquirer company depend on the expectations of the managers regarding the transactions (Sirower and Sahni, 2006). Besides, Eccles et al. (1999) state that the return for shareholders in M&A can depend on the systematic corporate governance processes created by companies.
The return of M&A depends roughly on the payment approach that is adopted. Loughran and Vijh (1997) found by evidence that the acquirer stock return is high when a tender offer is made and we use cash for payment. On the other hand, the acquirer stock return is low when a merger offer is made and stock is used for payment. Thus, tender offers yield higher wealth gains than mergers (Loughran and Viji, 1997). In order to set whether the deal is paid with cash or stock, Sirower and Sahni (2006) suggest a Shareholder Value at Risk (SVAR) calculation to judge the materiality of a deal.
(10)
In fact, the ratio SVAR will be used to assess the relative degree of synergy risk (Sirower and Sahni, 2006). When SVAR is too high it means that the risk is underestimated and acquiring shares can be overvalued; hence, the acquirer company will prefer use stock for payment. At the same time Sirower and Sahni (2006) recommend to design a “meet premium” line which reflects entirely possible combinations of synergies that would be good enough to justify the offer.
2.3. Conclusion
M&A have been driven by regulatory and political reforms, technological changes, fluctuations in financial markets, the role of leadership, and the tensions between scale and focus (Wassestein, 2001). Meanwhile, companies seek to take an advantage on these factors in order to create Shareholders value, but some studies shows that several M&A transactions ends up destroying
15
acquirer’s shareholders value and generate value for the target firm as well as for the economy (Sirower and Sahni, 2006).
In spite of some pitfalls and limitations that have been found in firm valuation techniques, in order to know how much firms worth in M&A transaction, we need to evaluate them by using such techniques. In meantime, Damodaram (2012) recommends that managers should spend a huge time on it considering the positive and wealthy results for the participating firm’s shareholders.
3. Industry and Company Analysis
The entertainment, media and communications sector face a greatest change in tech field, a product or service can move from concept to consumers in a little slight as six months or less. This situation brings high competitiveness in industry and force companies to consider in their strategies innovation and a reliable cost-effective supply chain in order to succeed or survive.
In this chapter we will exploit the US entertainment, media and communications sector and focus on the firms individually.
3.1. Overview of the US Entertainment, Media and Communications
Sector
The entertainment, media and communications sector or simply EMC, has witnessed the largest volume of deal in the US. According to the PWC report EMC sector deals value increased roughly amounting to $126.5 billion in 2013 to $222.7 billion. The increase on this sector was boosted with strength returning to broadcast advertising and continued growth in generate revenues. These deals have been motivated by several factors such as the constant technology changes, the US economy growth, the increasing competition, etc., in order to pursue the operations efficiency enhancements.
According to the US entertainment and media outlook (2014-1018) presented by PWC, it will be holding major changes on how people watch and subscribe to TV due to the increased number of new players, subscriptions being reduced, and new devices. Furthermore, the outlook highlights, the disruption caused by over-the-top (OTT) players which has becomes accessible and causes pay-TV fall continuously. This impetus is caused
16
by younger audiences subscribing to digital platforms rather than pay-TV which is leading to a growth in M&A. Despite of these insights, US is expected to be the world’s biggest market for TV subscriptions and license fees revenues by the end of 2018. On the other hand, eMarketer outlooks for this year, an increase of 41.9% on digital video segment and 3.3% on TV advertising segment. Moreover, yet according to eMarket, 90% of digital video customers will be using connected TVs by the end of 2018.
3.2. Comcast Corporation
Comcast Corporation is one of the largest mass media and Communications Company in the world measured by revenues and the biggest cable company and home internet service provider for 40 states in the US. It was founded in 1963 and has its headquarters in Philadelphia and Pennsylvania. Traded in NASDAQ, the company’s IPO occurred on June, 1972, with a market capitalization of $3,010,000. Before 2011 the company relied on the cable segment and programming segment but since the creation of NBC-Universal Holdings with General Eletric on January, 2011, Comcast starts providing a wide range of products and services through five segments (Cable communications, Cable Networks, Broadcast Television, Filmed Entertainment and Theme Parks segment) clustered into two categories of business: Comcast cable and NBC-Universal.
3.2.1. Comcast Cable
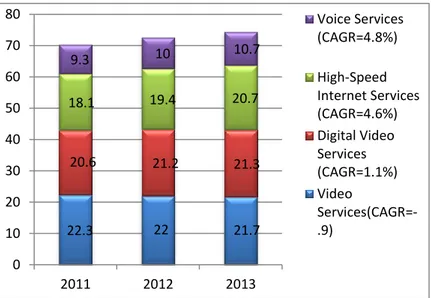
Comcast Cable business is the main source of revenues of the company. This business area is solely represented by Cable
communications segment that generate more than 60% of consolidate revenue as well as more than 80% of EBITDA per year. In 2013 Comcast registered an increase of
customers in cable
communications segment of 2.5% to 74.4 million customers. Meanwhile, these customers
22.3 22 21.7 20.6 21.2 21.3 18.1 19.4 20.7 9.3 10 10.7 0 10 20 30 40 50 60 70 80 2011 2012 2013 Voice Services (CAGR=4.8%) High-Speed Internet Services (CAGR=4.6%) Digital Video Services (CAGR=1.1%) Video Services(CAGR=-.9)
17
are distributed by video services, high-speed internet services and voice service. Video services
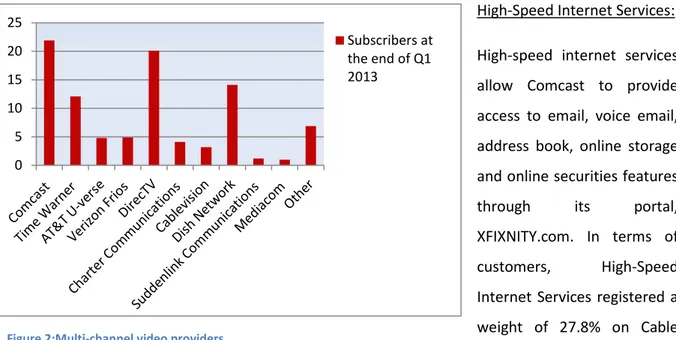
Comcast deliver a wide range of video services with access to hundreds of channels. Video services division and digital video services combined, representing more than half percent of the Cable segment customers (figure 1), though Video Services customers has decreased on average 1.4% in the previous three years. In Q1 of 2013, Comcast dominated this segment with 21.9 million customers (figure 2). The level of services was ranging from a limited basic service with an access between 20 and 40 channels of video programming to a full digital service with access to over 300 channels. Video services include programming provided by national and local broadcast networks by national and regional cable networks, as well as government and public access programming. On the other hand, digital video service includes access to over 40 music channels.
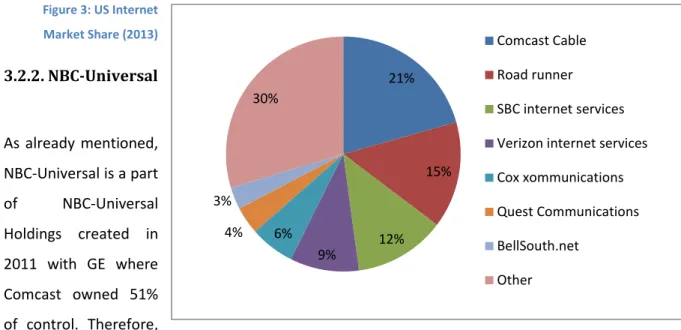
High-Speed Internet Services: High-speed internet services allow Comcast to provide access to email, voice email, address book, online storage and online securities features through its portal, XFIXNITY.com. In terms of customers, High-Speed Internet Services registered a weight of 27.8% on Cable Communications segment in 2013, which is slightly higher than the last two years; however, this growth is justified by a High-Speed Internet Services’ compound annual growth of 1.1% from 2011 to 2013 as well as a decrease in Video Services as referred in previous paragraph. High-Speed Internet segment represents 21% of the US internet market share (Figure 3).
Voice Services: Through voice services Comcast provides voice plans using an interconnected voice over internet protocol technology. Moreover, for customers with Comcast’s high-speed internet, voice services also include the ability to access and manage voicemail, text messaging and other account features through XFINITY.comcast.net or by using Comcast’s mobile apps for smartphones
0 5 10 15 20 25 Subscribers at the end of Q1 2013
18
and tablets. Voice services division customers had an increase of 7% to 10.7 million customers in 2013 and represented 14.4% over cable segment customers (figure1) at the same period of time. Business services: This division allows Comcast to offer cable services to small and medium-sized businesses. Business services include a website hosting service, that allows customers to share, coordinate and store documents online, hosted voice services using cloud network servers, a business directory listing, and the added capacity for multiple phone lines. On other hand, though business services Comcast also offer advanced voice services and Ethernet network services to medium-sized customers that connect multiple locations, as well as cellular backhaul services to mobile network operators to help them network bandwidth.
Figure 3: US Internet Market Share (2013) 3.2.2. NBC-Universal As already mentioned, NBC-Universal is a part of NBC-Universal Holdings created in 2011 with GE where Comcast owned 51% of control. Therefore,
in 2013 the company acquired the remaining 49% common equity interest in NBC-Universal Holdings. This line of business includes cable networks segment, broadcast television segment, filmed entertainment segment and theme parks segment. These segments generate more than 34% of Comcast consolidate
revenues and 19% of the EBITDA per year. For example in 2011; 2012 and 2013 represented 34%; 38% and 37% of Comcast consolidated revenue respectively.
Cable Networks segment: Consists essentially on 15
domestic cable television networks, 13 regional sports and news networks, more than 60
21% 15% 12% 9% 6% 4% 3% 30% Comcast Cable Road runner SBC internet services Verizon internet services Cox xommunications Quest Communications BellSouth.net Other 37% 20% 8% 8% 8% 7% 5% 3% 2% 2% Comcast Time Warner Verizon Cox Communications AT&T U-verse Charter
19
international cable networks, cable television production studio, and other related media proprieties. The number of subscribers in Network Comcast declined 0.45% to 1,099 million subscribers, but in 2013 this decrease was slightly compensated with introduction of children’s entertainment (Sprout) online platform attended by 57 million subscribers in 2013; which led an increase of 0.64% to 1,106 million customers in 2013 though Game Lifestyle (G4) has decreased 50% to 31 million subscribers in 2013. Furthermore Comcast detains 37% share of the US market cable networks segment (Figure 4).
Broadcast Television: Consists on NBC and Telemundo broadcast networks that are owned by local television stations, Comcast broadcast television production operations and other related digital media proprieties. Comcast own and operate 10 NBC affiliated domestic television stations that reaches nearly 31 million U.S. television households, which represents approximately 27% of U.S. television households. On the other hand Telemundo owned 14 domestic television and reach approximately 55% of U.S. Hispanic television households.
Filmed Entertainment: Consists of the operations of Universal Pictures, which produces, acquires, markets and distributes filmed entertainment and stage plays worldwide. Meanwhile this segment generates revenues from worldwide theatrical release of owned and acquired films, content licensing and home entertainment.
Theme Parks: Consists of the Universal theme parks in Orlando and Hollywood. This segment generates revenues from theme park attendance and per capita spending, management, as well as licensing and other fees. Per capita spending includes ticket price and in-park spending on food, beverage and merchandise.
3.2.3. Revenues
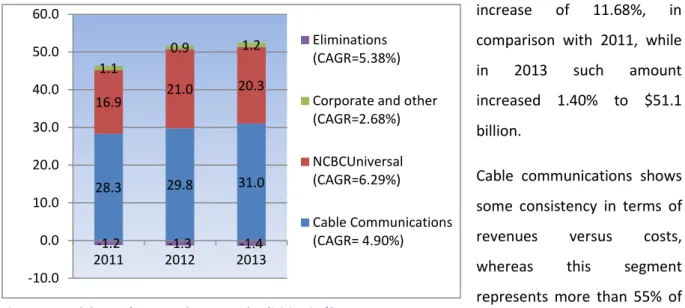
As already referred, Cable Communications segment is the biggest source of revenues for Comcast (Figure 5). In 2012 the segment registered an increase in revenue of 6.4% to $39.6 billion and an increase in its operating income before depreciation and amortization of 6.3% to $16.3 billion. In 2013 the revenue of
37.2 39.6 41.8 19.3 23.8 23.7 0.6 0.5 0.6 -1.2 -1.3 -1.4 -10.0 0.0 10.0 20.0 30.0 40.0 50.0 60.0 70.0 2011 2012 2013 Eliminations (CAGR=5.94%) Corporate and other (CAGR=2.45%) NCBCUniversal(CAGR =7.08%) Cable Communications (CAGR=3.97%)
20
cable communications segment rose 5.6% to $41.8 billion and its EBITDA increased by 5.6% to $41.8 billion. At the same time NCBCuniversal recorded an increase in revenue of 12.7% to $23.8 billion and the underlying EBITDA in this segmentgrew 9.0% to 4.1 billion.
In 2013 NCBCUniversal revenue decreased slightly 0.68% to $23.7 billion; by contrast the segment EBITDA increased 15.2% to $4.7 billion. Regarding Cable Communications segment growth, the revenues were driven by video division which had increase 2.5% and 2.9% in 2012 and 2013, respectively due the additional and higher levels of video service received by customers that implicated an increase of subscribers, as well as from rate adjustments; increase in High-Speed Internet revenue of 8.3% to $10,344 million in 2013 with an CAGR in three years of 5.7% (2011 to 2013) explained by a higher rates from customers receiving higher levels of services and rate adjustment; increase in Voice revenue of 1.5% and 2.8% in 2012 and 2013 respectively due a growth in number of residential customers receiving services through discounted bundled offerings; increase in business services of 31.3% and 26.4% in 2012 and 2013, respectively due to higher number of business customers receiving cable services and at end an decrease of 4.2% to $2,189 million in advertising , affected by the strength of advertising market and general economic conditions in 2013 .
NBC-Universal business has expanded through an increase in Cable Network Segment of 8.26% and 5.64% in 2012 and 2013 respectively, due to the upsurges in the contractual rates that Comcast charged under distribution agreements, higher prices and an increase in the volume of advertising units sold contributed to increases of 12.9% and 8.9% in 2012 and 2013 respectively and also increase in Content Licensing and other due to new licensing agreement celebrated in 2013; increase in Broadcast Television Segment of 37.8% in 2012 and a decrease of 13.17% in 2013 due to $1.2 billion of advertising recorded in 2012 associated with broadcasts of the 2012 Super Bowl and the 2012 London Olympics game as well as a decrease in Content Licensing due to the timing of licencing agreements; Increase in Filmed Entertainment of 21.70% and 5.68% in 2012 and 2013 respectively due to strong performance of Ted, Dr. Seuss’ The Lorax and Bourne Legacy in 2012 and due to the strong performance of Me 2 and Fast Furious 6 in 2013 as well as an increase in Content Licencing due to the international licensing of theatrical releases and from the licensing of Comcast theatrical releases to digital distributors in 2013 as well as because of the growth of the content licensing revenue due to a higher volume of owned and acquired films made available to releases and increase in the licensing of Comcast content to digital distributors in 2012; increase in Theme Parks segment of 11.26% and 7.19% in 2012 and 2013 respectively due to higher guest attendance and increase in per capita spending at Comcast Orlando and Hollywood theme parks as well as due to
21
success of The Wizarding World of Harry Potter attraction in Orlando and the Transformers attractions in Orlando and Hollywood in 2012 and 2013.
3.2.4. Costs and Expenses
Comcast incurred $50.4 billion of total costs and expenses in 2012. This amount represents an increase of 11.68%, in comparison with 2011, while in 2013 such amount increased 1.40% to $51.1 billion.
Cable communications shows some consistency in terms of revenues versus costs, whereas this segment represents more than 55% of total Comcast costs. In fact cable communications costs and expenses have increased every year as shown on figure 6. In 2012 the costs increased by 5.02% to $29.8 billion, while in 2013 there was a growth of 4.27% to $31 billion. NCBCUniversal represents 40% of total Comcast costs and expenses on average. In 2012 NCBUniversal costs increased 24.22% to 21 billion, while a decrease of 31.68% to 20.3 billion was registered in 2013. Cable communications, Broadcast Television, Filmed Entertainment and Theme Parks segment has accounted for substantially all of the increase in consolidated costs and expenses, excluding depreciation and amortization. Furthermore, in 2012 the increase in costs and expenses was due to broadcasts of 2012 Super Bowl and the 2012 London Olympics, however, in 2013 the decrease in operating costs and expenses in Broadcast Television segment served to partially offset the increase in all costs and expenses. On the other hand consolidate depreciation and amortizations had an slightly increase of 0.94% to $7,871 million in 2013, by reason of the increases in capital spending in Cable Communications and Theme Parks Segments as well as depreciation associated with the acquisition of real estate properties by NCBUniversal on the same year.
3.2.5. Capital Expenditure 28.3 29.8 31.0 16.9 21.0 20.3 1.1 0.9 1.2 -1.2 -1.3 -1.4 -10.0 0.0 10.0 20.0 30.0 40.0 50.0 60.0 2011 2012 2013 Eliminations (CAGR=5.38%) Corporate and other (CAGR=2.68%) NCBCUniversal (CAGR=6.29%)
Cable Communications (CAGR= 4.90%)
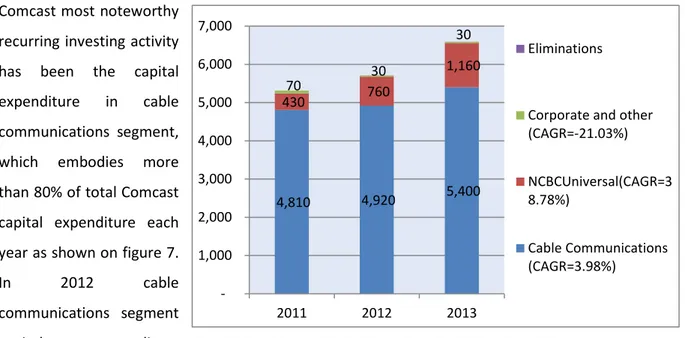
22 Comcast most noteworthy
recurring investing activity has been the capital expenditure in cable communications segment, which embodies more than 80% of total Comcast capital expenditure each year as shown on figure 7.
In 2012 cable
communications segment capital expenditure increased slightly 2% to
$4,810 million, while in 2013 there was an increase of 9.8% to $5,400 million, whose source is justified by the investment in Comcast IP and cloud-enable video platform, the deployment of wireless gateways in customer´s homes and continued investment in network infrastructure, as well as the expansion of business services and Comcast home security and automation services. At the same time, NCBUniversal capital expenditure hugely amplified 75.7% to $760 million in 2012 and an increase of 52% to $1,160 million in 2013. This increase in NBC-Universal is due the continued investment in original programming and sports programming rights at both Comcast cable networks and broadcast networks and continued investment in new attractions at Universal theme parks, including the Transformers and Despicable Me attractions and the expansion of the Harry Potter attraction.
3.2.6. Net Income
Figure 8: Net income ($ millions)
4160 6203 6816 0 1000 2000 3000 4000 5000 6000 7000 8000 2011 2012 2013
Net Income (CAGR=18%)
4,810 4,920 5,400 430 760 1,160 70 30 30 1,000 2,000 3,000 4,000 5,000 6,000 7,000 2011 2012 2013 Eliminations
Corporate and other (CAGR=-21.03%) NCBCUniversal(CAGR=3 8.78%)
Cable Communications (CAGR=3.98%)
23
Comcast’s net income registered a huge increase of 49% to $6,203 million in 2012 and an increase of 10% to $6,816 million in 2013 due to high increase in Broadcast Television and Filmed and Entertainment segments revenues in 2012 because of the events already referred in the last paragraphs.
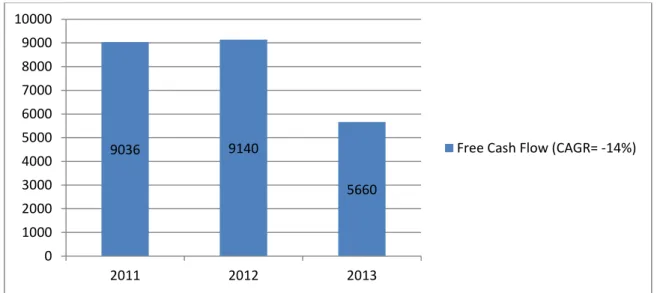
3.2.7. Free Cash Flow
Figure 9: Free cash flows ($ millions)
Comcast’s free cash flow has dramatically decreased by 14% in the last three years (CAGR); moreover in 2012 a slight increase of 1% to $9,140 million was registered, while the following year, free cash flow chart dropped significantly 38% to $5,660 million due to the increase in capital expenditure.
3.3. Time Warner Cable Inc.
Time Warner Cable (TWC) is a public American cable telecommunications company that provides video, high-speed data and voice services in 29 US’s states, well-clustered cable systems located in five geographic areas - New York City, the Carolinas, the Midwest, South California and Texas. Time Warner Cable with headquarter in New York City, is the second largest cable company in the US only behind Comcast. TWC was founded in 1990 as result of a merger between Time Warner Communications and Time Inc.’s cable television company. Traded in NYSE, the company’s IPO occurred in March 2007. Therefore there are two main services where Time warner’s revenue which are: Residential services and business services. Residential service allows offering video services, high speed- data and voice services, as well as the security and home management services to residential customers. Through business services TWC offers a wide range of products and services such as
9036 9140 5660 0 1000 2000 3000 4000 5000 6000 7000 8000 9000 10000 2011 2012 2013
24
business connectivity, video, high-speed data, voice, hosting and cloud computing services. Beyond these activities TWC relies on advertisements and other sources of revenues.
3.3.1. Residential Services
Through line of business Time warner cable detains 20% of US cable television market share (figure 5), being behind Comcast Corporation. Residential services represent 71% of the entire Time Warner subscribers. As stated in paragraph above, through this segment TWC offers video, speed data and voice services, as well as security services to residential customers.
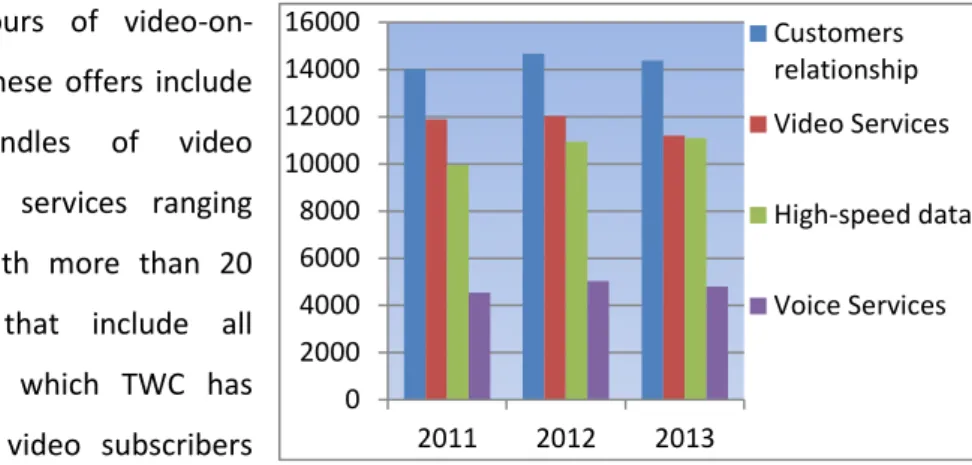
Video Services: Also known as programming video segment, TWC’s video services provides over 300 channels and 18000 hours of
video-on-demand programming. These offers include various tiers and bundles of video programming and music services ranging from a basic package with more than 20 channels to packages that include all programming services to which TWC has rights. Moreover, TWC’s video subscribers pay a monthly fee based on the video
programming tier or package they receive. On the other hand, for subscribers of specialized tiers and premium networks are charged with additional monthly fee. TWC’s video services tier represents nearly 27% of residential services, which is lower comparing with approximately 34% of customer relationship1. Despite of the rising of 5.57% to 42,663 thousands residential subscribers in 2012, the course slightly changed negatively in 2013; whereas, this segment faces a decrease of 2.78% to 41,476 thousands subscribers (figure 8).
High-Speed Data Services: TWC offers a range of high-speed data services tiers, that provide a diversity of speed (from 2 to 100 megabits per second (“Mbps”) downstream), price and consumption (unlimited, 20 gigabyte and 5 gigabytes) levels and communication tools as well as personalized services, including email, PC security, parental controls and online radio for free. TWC has an agreement with a group of other US cable companies to offer each other´s high-speed data subscribers access to their respective WiFi networks in order to allow customers to have access to a nationwide network. 26.74% of residential services subscribers in 2013 are associated to High-speed Data. This segment has increased more than any other in the last three years (figure 8).
1 Customer relationships represent the number of subscribers who buy at least one of the TWC’s services.
0 2000 4000 6000 8000 10000 12000 14000 16000 2011 2012 2013 Customers relationship Video Services High-speed data Voice Services
25
Figure 11: Breakdown of Business Services subscribers
Voice Services: Through residential services segment, TWC offers a variety of unlimited local and long-distance calling throughout the US, Canada and Puerto Rico that include call waiting, call forwarding, distinctive ring and call ID on customer’s telephone, computer or television, for a fixed monthly fee. The weight of voice services subscribers on residential services was low in 2013 due to a decrease of 4.34% to 4,806 subscribers in 2013 (figure 8).
Security services (IntelligentHome): Is considered as the next-generation home automation and monitoring service, in all of its operating areas. Customers who intend to obtain the IntelligentHome service must subscribe to TWC’s high-speed data service at the standard tier or higher.
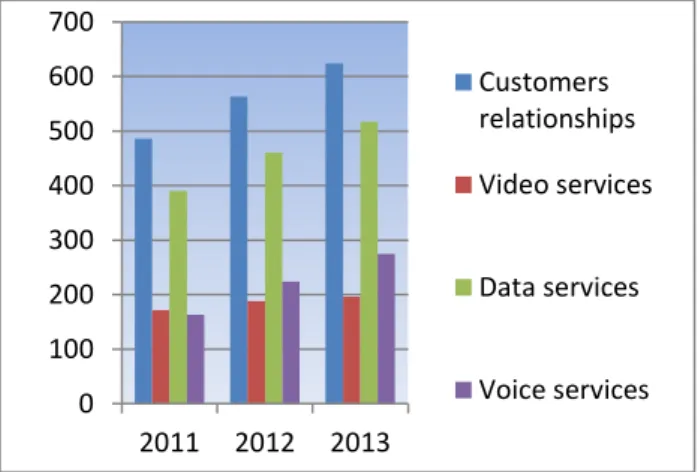
3.3.2. Business Services
Business services represent around 3% of all TWC subscribers. Time warner cable provides several products and services to business customers, such as business connectivity (data services, video and voice as well as hosting and cloud services ; at retail and wholesale2, managed and unmanaged, and using its own network infrastructure and third party infrastructure.
Data services: data services offered by TWC include internet access, network services and wholesale transport services. With internet TWC
provides asymmetrical broadband Internet access to small businesses with downstream speeds up to 15 Mbps and wideband Internet access with downstream speeds from 35 to 100 Mbps. Through Network services TWC offers Ethernet-based network services that support businesses to interconnect their geographically dispersed locations and local area networks in a private network. Whole
transport services are offered to wireless telephone providers for cell tower backhaul and other service providers to connect customers that their own networks do not reach. Data services division represents 32% of business services subscribers, meanwhile this division has increased in last three years; for instance in 2013 registered an increase of 13.39% to 517 thousands subscribers (Figure 9).
2 Retail customers range from small business with a single location to medium-sized an enterprise business
with multiple locations as well as government, education and non-profit institutions.
Wholesale customers are other services providers, such as telecommunication carries and network and managed services resellers.
0 100 200 300 400 500 600 700 2011 2012 2013 Customers relationships Video services Data services Voice services
26
Video Services: Video services enable TWC providing a wide range of video services which include a full broad of video programming ties and music services targeting business of different sizes and across key industries (hospitality, healthcare and education). Video services segment subscribers corresponded to 17% of business services subscribers. In addition, video services division increased in last three years (Figure 9).
Voice Services: Voice services division include both multi-line phone and trunk service. Multi-line phone allows TWC to offer a variety of calling plan options along with key business features, including call hunting, extensive call forwarding options, call restrictions and call transfer. Moreover TWC also provides a web-based customer portal, voice manager, which enable voice customers to customize and manage the underlying service features. TWC’s trunk is related to the services offered either to a Primary Rate Interface (PRI) or a Session Initiation Protocol (SIP) handoff to the customers. Through PRI trunk service, TWC offers medium-sized and enterprise business customers a variety of packages with up to 23 simultaneous voice calls on each trunk line and set of voice usage plans. SIP trunk service allows TWC offering medium-sized and enterprise business customers a variety of packages with up to 60 simultaneous voice calls with a set of voice usage plans. The subscribers’ weight of this division on Business services segment has increased in last three years; in 2013 represents 17.06% of total business subscribers, which is higher than 15.61% of subscribers in 2012 (Figure 9).
In general, TWC’s subscribers had a growth of 1.15% (CAGR) in three years. In fact the number of subscribers enhance from 56,134 in 2011 to 58,096 in 2013. Around 25% of total TWC’s subscribers are related to the single play subscribers, double play subscribers and triple play subscribers. 3.3.3. Revenues
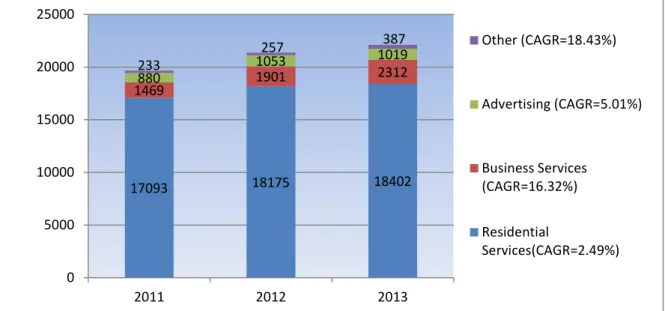
27 17093 18175 18402 1469 1901 2312 880 1053 1019 233 257 387 0 5000 10000 15000 20000 25000 2011 2012 2013 Other (CAGR=18.43%) Advertising (CAGR=5.01%) Business Services (CAGR=16.32%) Residential Services(CAGR=2.49%)
In 2013 Time Warner Cable achieved total revenue of $22.120 million, which corresponds to a Compound Annual Growth Rate (CAGR) of 3.98% in a range between 2011 and 2013. These revenues has been driven mainly by the Residential Services segment, whose weight in total TWC revenue maintained higher than 80% throughout the three last years. In contrast, Residential Services segment had a CAGR of 2.49% in the last three years, which is lower when compared with other sources of revenues (Figure 10). This weak CAGR in revenues is explained by a verified down in 2013 of 3.99% to $10.481 million and 3.66% to $2.027 of the Video Services and Voice Services respectively. Despite of the negative CAGR of 0.34% in Video Services division, High-speed Data has had an increase of 9.16% in last three years. On the other hand Business Services segment revenue registered an increase of 21.62% to $2312 million in 2013. Meanwhile, a crucial element behind TWC’s Business Services is Voice Services division, which has an increase in revenues of 55.33% to $306 million in 2012 and achieved the highest CAGR of 28.81% in 2013, whereas TWC obtained $421 million of revenues from Voice Services. At the same time, High-Speed Data division has increased 14.77% in three last years, while Video Services division has increased 6.66% at the same period of time. Another source of TWC revenue has been advertising, even though advertising faces a decrease of 3.23% to $1.019 million in 2013. Nevertheless, its CAGR over three past years remained positive (5.01%). Finally other sources of revenues from TWC have been increased each year (for example in 2012 other revenues increased 17.70% to $1.310 million)3.
3
Other revenues include fees paid to TWC by the Advance/Newhouse partnership and insight for the ability to distribute TWC’s high-speed data service and the Advance/Newhouse Partnership for TWC’s management of
28 9138 9942 10342 3311 3620 3798 3027 3264 3281 130 115 119 0 2000 4000 6000 8000 10000 12000 14000 16000 18000 20000 2011 2012 2013
Other Costs (CAGR=-2.90%)
Depreciations and
Amortizations(CAGR=2.72%)
Selling and Administrative costs (CAGR=4.68%)
Costs of Revenues(CAGR=4.21%)
Figure 13: Breakdown of costs and expenses in $ millions
3.3.4. Costs and Expenses
TWC’s total costs and expenses had an increase of 3.54% to $17,540 million in 2013. These costs and expenses reflect the costs of revenues, selling and administrative, depreciations and amortizations as well as merger-related and restructuring costs. Costs of revenues represent about 58.6% of total costs and expenses (Figure:13); however, cost of revenues include costs related with delivery of services to subscribers or the maintenance of company’s delivery costs such as video programming costs; high-speed data connectivity costs; voice network costs and other associated expenses, including non-administrative labour, franchise fees; and other related costs. Cost of revenues has increased 4.21% last long three years; even though voice network has had a negative CAGR of 2.35% other direct operating expenses had a growth of 15.29% to $1312 million in 2013. In 2013 video programming services and workforce costs increased almost half less than in 2012. Regarding selling and administrative costs, TWC incurred $3,798 million in 2013 while depreciations increased slightly 0.03% to $3,155 million at the same period due an increase in shorter-lived distribution system and capitalized software assets as well as two additional months of Insight costs related with its property, plant and equipment.
3.3.5. Capital Expenditure
certain functions, including, among others programming and engineering; and by commissions earned on the sale of merchandise by shopping network.