Ref. Nº C0777
Estimation and mapping transpiration with basal and stress crop
coefficients derived from remote sensing and ground-based plant water
stress indicator
F. L. Santos
1, M. M. Correia
1, I. Pôças
2, P. C. Valverde
1, R. R. Coelho
1, M. Vaz
1, T. A. Paço
2 1Instituto de Ciências Agrárias e Ambientais Mediterrânicas, Polo da Mitra da Universidade
de Évora, Évora 7002-554, Portugal,
[email protected]
;
2
CEER – Biosystems Engineering, Instituto Superior de Agronomia, Universidade Técnica de
Lisboa, Lisboa, Portugal .
Abstract
The use of remote sensing for obtaining evapotranspiration (ET) from natural and agricultural surfaces is already widely used. For irrigated agriculture the two basic approaches are: (1) the solution of the energy balance equation, using remotely sensed surface temperatures and reflectances to estimate variables and components of this equation, and (2) the crop coefficient and reference evapotranspiration (ETo) approach where the crop coefficient is obtained through canopy reflectance measurements. For the latter, theoretical and field studies have shown that satellite reflectance-derived vegetation indices (VIs) are closely relate to carbon and moisture fluxes and, when combined with ground data or appropriately calibrated models, they can produce valuable estimates of crop transpiration and related processes at the canopy or ecosystem scale (D´Urso and Calera, 2006). In this study the crop coefficient approach was used. For estimation of actual transpiration of irrigated and very high tree-density hedgerow orchards grown in Alentejo the procedure correlates (a) the basal crop transpiration coefficients (Kcb = Tmax/ETo) of the unstressed full irrigated treatment to the normalized difference vegetation
index (NDVI) values assessed from Landsat5 TM and Landsat7 ETM+ (r2 = 0.86) and (b) the crop stress coefficient (Ks = Ta/KcbETo), obtained from the ratio of the sustained deficit irrigation (Ta) and fully irrigated
(Tmax) daily transpiration rates, to a plant stress indicator, in the case, the basal leaf water potential (r2= 0.85).
Daily tree transpiration rates on both treatments were obtained from sap flow measurements. The unstressed crop status of the full irrigation treatment was warranted from the high Willmott index of agreement (IA = 0.88) obtained with transpiration values simulated with the Penman-Monteith “big leaf” model (Willmott, 1982). In this algorithm, a specific model of bulk daily canopy conductance (Gc) for unstressed olive canopies was used
(Orgaz et al., 2007). From the resulting relationship equations, known field values of leaf basal water potential and satellite-derived NDVI´s suffice to get estimates of Ks and Kcb, respectively and from them derive and map
the actual olive tree transpiration (Ta = Kcb Ks ETo) rates. The study is under way, and thus further validation
applications are planned prior to using the approach for mapping olive transpiration orchards of different tree density and scale areas.
Keywords: Olea europaea, transpiration, crop coefficient, hedgerow olive orchard, mapping transpiration
Estimativa e mapeamento da transpiração com os coeficientes culturais
basal e de stress derivados de deteção remota e de indicadores de stress
hídrico
Resumo
O uso da deteção remota para a obtenção de estimativas da evapotranspiração (ET) de superfícies naturais e agrícolas é hoje uma realidade. Para a agricultura de regadio, as duas aproximações mais usadas nessa estimativa são: (1) a solução da equação do balanço de energia, com as temperaturas da superfície e as reflectâncias obtidas por deteção remota, o que garante a estimativa de variáveis e componentes dessa equação, e (2) a obtenção de coeficientes culturais e da evapotranspiração da cultura (ET) com base na evapotranspiração de referência (ETo) e na reflectância do copado, esta obtida por deteção remota. Para esta aproximação, os estudos teóricos e experimentais demonstram que os índices de vegetação (VIs), derivados de informação de reflectâncias obtida de imagens de satélite, apresentam elevada correlação com os fluxos de carbono e de vapor de água e que, quando
Ref. Nº C0777
combinados com dados derivados de ensaios experimentais e de modelos devidamente calibrados, produzem estimativas válidas da transpiração das culturas regadas e de processos com esta relacionados, à escala do copado e do ecossistema. Neste estudo foi usada a aproximação dos coeficientes culturais. Para a estimativa da transpiração actual de pomares de olival superintensivo regados e em sebe na região do Alentejo, o procedimento relaciona (a) valores do coeficiente cultural basal (Kcb = Tmax/ETo) do tratamento de rega plena, em que a cultura
é bem abastecida de água, com o índice de vegetação diferença normalizada (the normalized difference vegetation index NDVI) obtido a partir dos sensores Landsat5 TM and Landsat7 ETM+ (r2 = 0.86)e (b) valores
do coeficiente de stress hídrico (Ks = Ta/KcbETo), em que a transpiração máxima da cultura é obtida do
tratamento de rega plena (Tmax) e a transpiração actual da situação de rega deficitária sustentada (Ta), com
indicadores de stress da cultura, no caso, o potencial hídrico de base (r2= 0.85). Nos dois tratamentos, os valores
diários da transpiração do olival foram obtidos através de medições de fluxos de seiva no tronco de árvores. O estado de rega plena e olival bem abastecido de água foi assegurado pelo elevado índice de concordância de Willmott (IA = 0.88) obtido entre os valores de transpiração medidos pelo fluxo de seiva e os derivados com a equação "big leaf" de Penman-Monteith (Willmott, 1982). Neste algoritmo, a condutância estomática diária global do olival foi obtida através do "specific model of bulk daily canopy conductance (Gc) for unstressed olive
canopies" de (Orgaz et al., 2007). Com as relações estabelecidas em (a) e (b), para se obterem valores de transpiração actual do olival (Ta = Kcb Ks ETo) e mapear a sua distribuição temporal, bastará obter valores
experimentais de um indicador de stress da cultura (potencial hídrico de base), para daí derivar estimativas de Ks,
e valores do índice de vegetação NDVI, para daí derivar as de Kcb. Mais aplicações e validações estão planeadas
para comprovar o uso do modelo no mapeamento global da transpiração de pomares de olival de diferentes densidades e áreas de plantio.
Palavras-chave: Olea europaea, transpiração, coeficiente cultural, olival em sebe, mapeamento da transpiração
Introduction
The large demand for water rising from the increasing number of hectares devoted to olive orchards in southern Portugal make the optimal use of irrigation water critical for the sustainability of commercial orchards. A precise estimation of transpiration under non-limiting conditions is required to set the upper limit of irrigation requirements, and to assess the opportunities for reducing transpiration and water applications via deficit irrigation (DI; Santos et al., 2007). This growing need to estimate crop transpiration under water‐limiting conditions, i.e., deficit irrigation, is also greatly felt in many dry areas of the world with a shrinking share of agricultural water and current and pressing water allocation issues. The Kc approach with an empirical Ks stress coefficient has been proposed and used
to describe the effect of water stress on crop transpiration (Allen et al., 1998). Furthermore, crop coefficients are used to help better schedule irrigation and water delivery. Crop coefficient values are also related to canopy development and fractional vegetation cover. Since these vegetation characteristics are well correlated with canopy spectral reflectances, it is possible to establish a correlation between remote multi-spectral observations of uniformly growing crops and corresponding Kc values derived from field investigations (Bausch and Neale, 1987; Bausch, 1995; Choudhury et al., 1994). They established the potential for modeling crop coefficient as a function of the Normalized Difference Vegetation Index (NDVI) and used this approach to perform irrigation scheduling. On the basis of intensive multi-temporal spectral reflectance acquisitions and simultaneous field evaluations, a linear relationship, relating the basal crop coefficient Kcb and NDVI, has also been defined by D´Urso and Calera (2006). The objective of this study was to develop a simple predictive model to estimate and help map the actual transpiration of irrigated and very high tree-density hedgerow olive orchards in Alentejo taking into account the Normalized Difference Vegetation Index, NDVI and a crop water stress indicator (i.e., the basal leaf water potential), by: (1) correlating the basal crop transpiration coefficients (Kcb = Tmax/ETo) of the unstressed irrigation treatment to NDVI values remotely assessed by Landsat5 TM and Landsat7 ETM+ satelite sensors, and (2) correlating the crop stress coefficient values (Ks = Ta/KcbETo), a ratio of the sustained deficit irrigation daily transpiration rates (Ta) to the corresponding unstressed transpiration (Tmax= KcbETo) values, to basal leaf water potential, ψb measurements.
Ref. Nº C0777
Material and Methods
The research was conducted during 2012 in the region of Alentejo, Portugal, and in a commercial orchard at the Herdade da Azambuja, Monte do Trigo, near Évora (38º 24' 47.03'' N, 7º 43' 38.36'' W; alt. 75 m) in a Eutric Cambisoil (WRB, 1998). The average apparent bulk soil density was 1,67 Mg m-3, and average volumetric soil water content at field capacity (i.e. at 0,03 MPa) was 0,36 m3 m-3, whereas it was 0,12 m3 m-3 at wilting point (i.e. at 1,5 MPa). Using an orchard stand of 6 year-old olive trees (Olea europaea L. cv. Arbequina) planted on hedgerow in a 3,75 by 1,35 m spacing layout and drip irrigated, the trees were treated from mid-May to the end of October using one of two irrigation treatments: a treatment A with full-rate irrigation to the full soil water holding capacity and continuously replenished, and a SDI treatment B with irrigation to trees to provide for approximately 70% of the water applied in treatment A. Reference evapotranspiration, ETo was calculated using the FAO-Penman–Monteith method and the procedures prescribed by Allen et al. (1998). Each tree of treatments A and B were supplied with water by a single drip line with emitters spaced 0,75 m apart throughout the entire length of the emitter line placed at the soil surface and laid out along each tree row, and serviced by 2,3 and 1,6 l h-1 emitters, respectively. The irrigation scheduling and time of water delivery to trees were the same for both treatments throughout the irrigation cycle. Half-hour averages of the meteorological parameters, wind speed, air temperature, solar radiation, precipitation and relative humidity were evaluated from data recorded in a nearby meteorological station. Half-hour averages of the net radiation above the canopy of the trees were measured using one NrLite net radiometer (Kipp & Konen, Holland) connected to a data logger (Delta-T, DL2e, Delta-T Devices, Cambridge, U.K). To evaluate sap flow rates and transpiration, three representative trees in each treatment were selected and their trunk implanted with heat- pulse probes. Using the compensation heat-pulse technique (CHP) described in Santos et al. (2007), sap flow measurements were taken at 30min intervals and tree transpiration rates were estimated as average sap flow rates of the three probes. Photosynthetically active radiation (PAR) was evaluated using a set of eight Quantum sensors (QPAR-02, 400 – 700 nm, Tranzflo, Palmerston, NZ) placed in a fixed grid around the trees and one at the top of the canopy. Basal leaf water potential, ψb was evaluated in leaves of trees chosen for sap flow measurements with a pressure chamber (PMS Instruments, Corvallis, USA). Acquired radiometrically corrected reflectance values for red and near infrared bands available from the Landsat5 and Landsat7 ETM+ sensors were used as inputs for generating the Normalized Difference Vegetation Index, NDVI. Measured daily transpiration values estimated from sap flow were compared to simulated transpiration values obtained with the Penman-Monteith (PM) “big leaf” equation (Monteith, 1981) coupled with the Orgaz et al. (2007) specific model of bulk daily canopy conductance (Gc) for unstressed olive canopies (hereafter the PM-Orgaz model).
Results and Discussion
Daily transpiration rates of treatment A estimated from sap flow measurements were highly correlated with the corresponding transpiration values simulated with the PM-Orgaz model (Figure 1). Line 1:1 in the Figure reflects the good match between the observed and simulated values, demostrating that the PM-Orgaz model was able to capture the variations in the seasonal pattern of the well-watered transpiration rates of treatment A. Also, the high Willmott index of agreement IA of 0,8, and the low root-mean-square error RMSE of 0,4 mm d-1 (Willmott, 1982) corroborates the goodness-of-fit, securing that treatment A was well irrigated. Treatment A average maximum and minimum daily transpiration rates were 4,2 and 0,8 mm d-1, and 4,6 and 0,2 mm d-1 with the PM-Orgaz simulation model, respectively. Irrigation applied water between 1 June and 30 September were 296 and 206 mm for treatment A and B, respectively.
Ref. Nº C0777
Figure 1. Observed (CHP-based) and derived (PM-Orgaz based) transpiration (mm d-1) rates for
hedgerow olive orchard grown in southern Portugal. Solid line is the 1:1 line
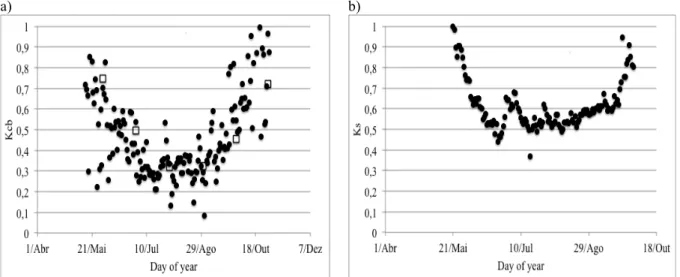
The basal transpiration coefficient Kcb for treatment A, the ratio of crop transpiration over reference evapotranspiration (Tmax/ETo) when the soil surface is dry and transpiration is occurring at a non‐water‐limiting rate, during summer (1 June to 30 September) was 0,398, with a maximum of 0,975 and a minimum of 0,082, but highly variable (Figure 2a) and with a marked increase at the end of summer and onwards. The variability was also high during spring. The U shape is a characteristic of olive trees (Testi et al., 2005). According to Allen et al. (1998), under water stress standard transpiration (Tmax) is usually reduced and the crop coefficient Kcb must be adjusted to those conditions using a stress coefficient Ks. The adjusted transpiration, Ta is the product of Kcb, Ks, and ETo. Ks is
also often used in the management of deficit irrigation regimes to adjust the upper limit of irrigation requirements to reflect the soil water limiting conditions. The evolution of Ks stress coefficients
values obtained for treatment B during summer is shown in Figure 3b. The average Ks was 0,691, with
a maximum of 0,92 and a minimum of 0,462, corroborating the steadily decline in transpiration rates of treatment B from June to September, when transpiration dropped to 59% of treatment A.
a) b)
Figure 2. Time series of (a) coefficient of transpiration Kcb (the ratio of crop transpiration over reference
evapotranspiration, or T/ETo) for the unstressed treatment A, and (b) the coefficient of stress Ks (the ratio
of stressed to unstressed crop transpiration) for deficit irrigation treatment B.
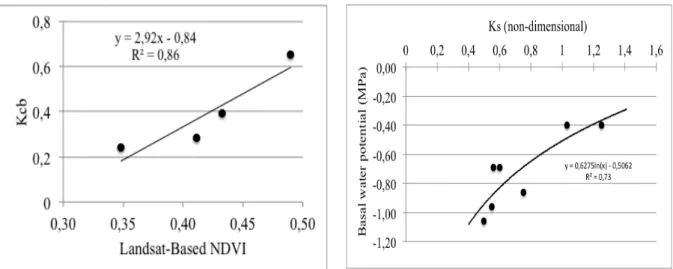
Figure 3a plots the relationship between Kcb and the Landsat based NDVI (R2=0,86) for the unstressed treatment A and shows the linear Equation 1,
Ref. Nº C0777
Kcb = 2,9 NDVI - 0,84 (1)
required to predict Kcb known corresponding values of NDVI. Figure 3b plots a similar relationship between Ks and the basal leaf water potential (R2=0,73), showing the logarithmic Equation 2,
Ks = 0,63 ln (ψb) - 0,51 (2)
also required to predict Ks known corresponding values of ψb.
Figure 3. Scatter plot for (a) calculated basal crop coefficient Kcb and the corresponding Landsat-based
NDVI values, and for (b) calculated stress coefficient Ks and the corresponding basal leaf water potential
(MPa) for a hedgerow olive orchard grown in southern Portugal
Conclusions
From the resulting relationships in Equations 1 and 2, known field values of basal leaf plant water potential, ψb and satellite-derived NDVI´s suffice to get estimates of Kcb and Ks, respectively and from them derive and map the actual olive tree transpiration (Ta = Kcb Ks ETo) rates. The study is under way, and thus further validation applications are planned prior to using the approach for mapping olive transpiration orchards of different tree density and scale areas.
Acknowledgements
Financial support from the Fundação para a Ciência e a Tecnologia (FCT) and Instituto de Ciências
Agrárias e Ambientais Mediterrânicas (ICAAM) for the projects PTDC/AGR-PRO/111717/2009
(H2Olive3S) and PEst-C/AGR/UI0115/2011, respectively, are gratefully acknowledged. Acknoweldgments are extended to the Estates Olivais do Sul for acess and research support in their commercial orchard at the Herdade da Azambuja.
References
Allen, R.G., Pereira, L.S., Raes D., and Smith, M. (1998). Crop Evapotranspiration: Guide- lines for Computing Crop Water Requirements. FAO, Rome, Irrigation and Drainage Paper, 56.
Bausch, W.C. (1995). Remote sensing of crop coefficients for improving the irrigation scheduling of corn. Agric.
Water Manag., (27):55-68.
Bausch, W.C., and Neale, C.M.U. (1987). Crop coefficients derived from reflected canopy radiation: a concept. Transactions American Soc. Agric. Engin., (30), 3:703-709.
Choudhury, B.J., Ahmed, N.U., Idso, S.B., Reginato, R.J., and Daughtry, C.S.T. (1994). Relations between evaporation coefficients and vegetation indices studied by model simulations. Remote Sens. Environ., (50):1-17.
Ref. Nº C0777
Observation data: methodologies and applications. AIP conference proceedings 852: Earth Observation for Vegetation and Water Management, 14-25.
Monteith, J.L., (1981). Evaporation and surface temperature. Quartely Journal of the Royal Meteorological Society, 107 (451), 1-27.
Orgaz, F., Villalobos, F.J., Testi, L., and Fereres, E. (2007). A model of daily mean canopy conductance for calculating transpiration of olive canopies. Functional Plant Biology, (34): 178-188.
Santos, F.L., Valverde, P.C., Ramos, A.F., Reis, J.L., and Castanheira, N.L. (2007). Water use and response of a dry-farmed olive orchard recently converted to irrigation. Biosyst. Eng. (98): 1, 102–114.
Testi, L., Villalobos, F.J., Orgaz, F., and Fereres, E. (2005). Water requirements of olive orchards –I: simulation of daily evapotranspiration for scenario analysis. Irrigation Science (24): 69-76.
Willmott, C.J. (1982). Some comments on the evaluation of model performance. Bulletin of American
Meteorological Society, (63): 11, 1309-1313.