Instituto Politécnico de Coimbra Instituto Superior de Engenharia de Coimbra Departamento de Engenharia Informática e de Sistemas
Machine-to-Machine Emergency
System for Urban Safety
André Filipe Gomes Duarte
Mestrado em Engenharia Informática
Instituto Politécnico de Coimbra
Instituto Superior de Engenharia de Coimbra
Departamento de Engenharia Informática e de Sistemas
Mestrado em Engenharia Informática
Estágio
Relatório Final
Machine-to-Machine Emergency
System for Urban Safety
André Filipe Gomes Duarte
21200791
Orientador: Professor Doutor Jorge Bernardino
Orientador da Empresa: Engenheiro Carlos Oliveira
Ubiwhere
i Acknowledgments
I would like to express the deepest appreciation to my supervisor at Ubiwhere, Carlos Oliveira, for his availability, motivation and knowledge shared during the internship. To Professor Jorge Bernardino for his accessibility and enthusiasm not only during the internship, but also during the entire degree.
To Ricardo Vitorino for his availability, knowledge and sharing useful inputs while the writing of the report.
To the remainder of my professors at ISEC which shared their knowledge and experience. To the Ubiwhere team, which provided an excellent working environment where it was possible to share knowledge and learn many new things.
To my friends and colleagues not only for their support but also for sharing experiences and knowledge.
ii
Resumo
Atualmente a maioria das pessoas vive em áreas urbanas. Com o crescimento das populações a exigência sobre os ecossistemas da cidade aumenta, afetando diretamente as entidades responsáveis pelo seu controlo. Desafios como este, fazem com que os responsáveis das cidades adotem maneiras de se interligar com o meio envolvente, tornando-os mais preparados e conscientes para a tomada de decisão. As decisões que tomam não só afetam diretamente a cidade a curto prazo, mas são também um recurso para melhorar o processo de tomada de decisão.
Este trabalho teve como objetivo desenvolver um sistema que pode agir como supervisor de emergência e de segurança numa cidade, gerando alertas em tempo real, que fornecem às entidades responsáveis novas competências para garantir a segurança. Este sistema é capaz de monitorizar os dados de sensores e fornecer conhecimento útil a partir deles. Este trabalho apresenta uma arquitetura para a recolha de dados na Internet das Coisas (IoT), proporcionando ainda a análise das ferramentas utilizadas e as escolhas feitas sobre o sistema implementado. Além disso, fornece os elementos necessários para que novos colaboradores possam vir a participar no projeto, uma vez que descreve todas as técnicas, linguagens, estratégias e paradigmas de programação utilizados.
Finalmente, descreve o protótipo que recebe os dados e os processa para gerar alertas com o objetivo de avisar equipas de emergência, descrevendo ainda a futura implementação de um módulo de previsão que pode agir como uma ferramenta útil para melhorar a gestão de equipas de emergência.
iii Abstract
Nowadays most people live in urban areas. As populations grow, demand on the city ecosystem increases, directly affecting the entities responsible for the city control. Challenges like this make leaders adopt ways to engage with the surroundings of their city, making them more prepared and aware. The decisions they make not only directly affect the city in short term, but are also a means to improve the decision making process. This work aimed to develop a system which can act as an emergency and security supervisor in a city, generating alerts to empower entities responsible for disaster management. The system is capable of monitoring data from sensors and provide useful knowledge from it.
This work presents an architecture for the collection of data in the Internet of Things (IoT). It delivers the analysis of the used tools and the choices made regarding the implemented system. Also, it provides the necessary inputs for developers to participate in the project, since it describes all the techniques, languages, strategies and programming paradigms used.
Finally, it describes the prototype that receives data and processes it to generate alerts with the purpose of warning emergency response teams and the future implementation of a prediction module that can act as a useful tool to better manage the emergency personnel.
The completion of the internship allowed the learning of new concepts and techniques, as well as the development of those that were already familiar. With regard to the company,
the developed system will integrate the company’s Citibrain platform and will act as a
iv
Keywords:
Disaster Management Emergency Systems Smart Cities
v Index
1. INTRODUCTION ... 1
1.1 Main Contributions ... 2
1.2 Ubiwhere ... 3
1.3 Structure of the Report ... 3
2. STATE OF THE ART ... 5
2.1 Smart City ... 5
2.2 Smart Cities Examples ... 6
2.3 Internet of Things (IoT) ... 9
2.4 Emergency Management ... 10
2.5 Smart Emergency Systems ... 11
3. PROPOSED ARCHITECTURE ... 13
3.1 Citibrain ... 13
3.2 Background ... 14
3.3 Architecture Example ... 18
3.4 System Architecture ... 19
3.5 Use Case ... 21
3.6 Technologies Used ... 24
4. SYSTEM DATABASE EVALUATION ... 27
4.1 Overview ... 27
4.2 Cassandra ... 28
4.2.1 Data Model ... 28
4.2.2 Architecture ... 30
4.2.3 Replication ... 30
4.2.4 Writing and Reading ... 32
4.3 Experimental Setup ... 33
4.4 Query execution evaluation ... 35
4.4.1 Querying an alert of a specific type (Q1) ... 36
4.4.2 Querying an alert for a rule (Q2) ... 37
vi
4.5 Summary ... 39
5. ALERTS MODULE IMPLEMENTATION ... 41
5.1 Alerts Module Overview ... 41
5.2 Alerts Module Architecture ... 42
5.3 API endpoints ... 46
5.4 How to receive alerts? ... 47
5.5 Summary ... 48
6. PREDICTIVE ANALYTICS MODULE ... 49
6.1 Predictive Analytics Overview... 49
6.2 Predictive Analytics Module Architecture ... 51
6.3 Dataset ... 53
6.4 Predictive Analytics Module Implementation... 54
7. CASE STUDY: URBAN SAFETY SYSTEM WITHIN OPORTO’S CITIBRAIN NODE ... 57
8. CONCLUSIONS AND FUTURE WORK ... 61
REFERENCES ... 65
ANNEXES ... 71
ANNEX A – INTERNSHIP PROPOSAL ... 73
ANNEX B – SMART CITIES: AN ARCHITECTURAL APPROACH ... 79
vii Index of Figures
Figure 1 - Participatory Sensing - Use Case Diagram (adapted from (Description of
implemented IoT services, 2014)) ... 8
Figure 2 - Smart Rescue Platform (Radianti, Gonzalez and Granmo, 2014) ... 11
Figure 3 - Citibrain Platform (Citibrain, 2015) ... 14
Figure 4 - Storm Topology (Apache Storm, 2014) ... 17
Figure 5 - Middleware Architecture (Cecchinel et al., 2014) ... 19
Figure 6 - Proposed Architecture ... 20
Figure 7 - Example application ... 22
Figure 8 - Data layer possible architectures ... 28
Figure 9 - Cassandra's Data Model (Charsyam, 2011) ... 29
Figure 10 - Cassandra Architecture (Strickland, 2014) ... 30
Figure 11 - Simple Strategy ... 31
Figure 12 - Network Topology Strategy ... 31
Figure 13 - Cassandra Writing ... 32
Figure 14 - Cassandra Reading ... 33
Figure 15 - Row prototype ... 34
Figure 16 – Query execution time of Q1 ... 36
Figure 17 - Query execution time of Q2 ... 37
Figure 18 - Query execution time of Q3 ... 38
Figure 19 - Alerts module architecture ... 43
Figure 20 - Alerts module event flow ... 46
Figure 21 - Steps to receive alerts ... 47
Figure 22 - PredictionIO high level architecture (PredictionIO, 2015) ... 50
Figure 23 - PredictionIO event server architecture (PredictionIO, 2015) ... 51
Figure 24 - Prediction module architecture ... 52
Figure 25 - Citibrain Applications ... 57
Figure 26 - Temperature data ... 58
Figure 27 - Citibrain dashboard ... 59
1
1. INTRODUCTION
Nowadays most people live in urban areas. The growth in population directly affects the city ecosystem and the entities responsible for the city control. City leaders must be aware of these changes and approve ways to engage with the surroundings of their city, enhancing their awareness and preparedness. The decisions they make not only directly affect the city in a short term, but are also a means to improve the decision making process. The growth in the number of human beings in urban areas comes with a significant increase in data. This data comes from sensor networks scattered around the city or from the sensors in a smartphone. As data production and availability increased, so did the need to integrate it and provide value added services to citizens.
As smart cities mature, legacy systems already in place are trying to evolve to become smarter, although these systems have many specific requirements that need to be attended. An architecture which is scalable, adaptable and interoperable for the Internet of Things (IoT) is necessary, therefore existing architectures will be analysed as well as the algorithms that make them work.
In this work we propose an architecture that is scalable, adaptable and interoperable for the Internet of Things (IoT) environment. It will be used as a basis to develop a system
that will integrate the company’s Citibrain Platform. Using sensors this system will
monitor parameters such as temperature, humidity, atmospheric pressure, ultraviolet radiation, fire detection and flooding in various points of a city. With this data comes the ability of providing useful knowledge that will lead to the alerting of the safety experts. These alerts are generated by the system when it analyses the information, which can provide indicator trends or make predictions for future events (e.g. fires, floods). The alerts intend to provide the ability for authorities to act as soon as possible upon an imminent danger.
2
With the purpose of improving the citizen’s quality of life and quickly and efficiently make informed decisions, authorities try to monitor all the information of city systems. Smart cities provide the integration of all systems in the city via a centralized command centre, which provides a holistic view of it. With the intent to suit the needs of specific systems the focus of this work is to gather viable information that leads to the analysis and presentation of solutions to address their current shortcomings. A system, based on the the developed architecture, will be implemented and integrated with the company’s Citibrain platform. The applications that are already deployed in the platform will provide information in real time, therefore the role of the system is to analyse this raw data, fire alerts and make predictions in order to mitigate future dangers. From a practical standpoint, this work intends to develop a Machine to Machine (M2M) prototype to act as an emergency and security supervisor.
1.1 Main Contributions
The main contributions of this work are:
An Application Program Interface (API), which intends to gather data from sensors scattered around the city;
An engine capable of receiving, processing and dispatching the alerts to
emergency personnel;
A predictive analytics module which provides the capability of estimating future
events;
The documentation of the best possible way to develop a smart system that receives streams of data from many sources and provides knowledge from it;
The creation of a prototype, based on the lambda architecture (Lambda
Architecture, 2014), which provides tools to work both with streams and batches of data, empowering cities with the necessary knowledge to avoid some types of disasters;
A generic IoT architecture for anyone to use or improve;
3 1.2 Ubiwhere
Ubiwhere is a software company, created in 2007, based in Aveiro and with offices in Coimbra and São João da Madeira, which specializes in research and innovation, idea to product and user-centred solutions. There are many brands under Ubiwhere’s name such as Citibrain, rprobe and Playnify.
This project is integrated in Citibrain, which is “a consortium which specialises in smart solutions for today's cities. Headquartered in Aveiro, Portugal, the consortium's main purpose is to create desirable and liveable places, bringing together cities and citizens to improve metropolitan life. Creativity, knowledge and innovation are at the core of Citibrain's strategy” (Citibrain, 2015).
1.3 Structure of the Report
The rest of this report is divided in the following chapters:
2 State of The Art – This chapter will cover the most important concepts related to smart cities and smart emergency systems;
3 Proposed Architecture – This chapter describes the proposed architecture for an Internet of Things system;
4 System Database Evaluation – This chapter explains how the database in the system is structured and handles the data;
5 Alerts Module Implementation – This chapter provides a technical approach to the main component of the system, which is the module that generates all the alerts. A broad perspective of the system is given to provide a better understanding on how the modules work;
6 Predictive Analytics Module – This chapter describes the predictive analytics module, which aims to make predictions for future disasters (e.g. fire, floods); 7 Case Study: Urban Safety system within Oporto’s Citibrain node – This chapter
shows a use case of the developed prototype with the data available from the
Oporto’s network of environmental sensors;
4
5
2. STATE OF THE ART
The area surrounding Internet of Things (IoT), Smart Cities and Smart Emergency Systems is vast and very much in its early stages. In this chapter we will attempt to analyse the most relevant parts of this ecosystem. The addressed problem has been partially developed in the past years with other studies and projects. To understand the basis of the developed work the necessary background shall be provided. It is important to acknowledge that the documented analysis will be high-level, although it covers as much information as possible.
2.1 Smart City
Smart cities are usually defined as modern cities with smooth information processes, streamlined mechanisms for creativity and innovativeness and sustainable solutions promoted through service platforms.
A smart city depends on the provision of information, communication technologies and services to the population via web based services (Alazawi et al., 2014). However, this formulation of Smart City can be misleading. In order to be smart, a city does not need state of the art technology, but interoperability between various key aspects of the city, such as governance, finance, transportation and many others. The kind of changes that smart cities will bring to the current world are many times said to be as similar to those seen in the industrial revolution. The motivation behind the concept is the ability to
improve the city’s ecosystem while focusing on people and allowing technology to work
for them and not with them, thus resulting in a greater vision of society.
6
include commercial confidentiality, whereas social media user groups work with open data systems, causing problems for joint working of cities with the private sector. This may create problems for collaborative ventures between city governments and businesses, and even with other public sector agencies, as well as with voluntary and community organisations.
The smart city concept can vary from the technologies and infrastructures of a city to an indicator that measures the education level of its inhabitants (Vakali et al., 2014). Furthermore this work intends to analyse the SEN2SOC (SENsor to SOCial) experiment for its impact in the current context of this topic. The SEN2SOC experiment promotes interactions between sensors and social networks to enhance the quality of data in the city of Santander. The concept of smart city is also referred and conceptualized in (Chourabi et al., 2012). The work enlists some success factors for smart cities, which are: (1) management and organization; (2) technology; (3) governance; (4) policy context; (5) people and communities; (6) economy; (7) built infrastructure; (8) natural environment. These factors provide a solid basis for the comparison of how cities are defining their smart initiatives. Also they represent the key areas for the success of every smart city. A theoretical definition of Smart City is yet to be found, although cities are developing and shaping for a not so distant future (Piro et al., 2014). Furthermore this work enlists some of the current definitions for the concept, that there is yet to be completely defined. In (Piro et al., 2014) it is also referred the necessity of Information and Communication Technology (ICT) services, with the intent to integrate them in a generic scenario of a smart city. The approach is from a service point of view, which means that it emphasises the role of the services in the city. It is also important to refer that real world cases are shown to prove the importance of the topic.
2.2 Smart Cities Examples
There are many examples of smart cities such as Amsterdam (Amsterdam Smart City, 2014), Santander (Santander Facility, 2014) and Barcelona (Barcelona Open Cities Challenge, 2014). These cities, due to constant innovation projects and investments, have a tendency to be pioneers in the adoption of new standards for smart cities. These cities use smart applications to facilitate the decision making process of their leaders.
7 services in cooperation with enterprises, public authorities and citizens as end-users. Although the work presents five project areas, the most relevant for our work is a smart city initiative focusing on the development of mobile phone services to facilitate urban travelling and living. It also opens up public data so that companies and citizens can create new services by combining and processing the data in innovative ways. This resembles the LivingLab movement that has spread across Europe in the 2000s (European Network of Living Labs, 2014).
In the city of Santander there are sensors to monitor the environment, parking areas, parks, gardens and irrigation systems. These sensors are scattered around the city in order to produce alerts that will notify end users with the status of the key aspects of the city. The data is captured by an IoT node that monitors indicators such as temperature, noise level or luminosity. This data then flows through repeaters positioned in higher grounds, which send it to gateways. Lastly, this data is stored in a database or sent to other machines where it is needed.
Regarding the environmental scenario, from a user’s point of view, the available
indicators are the temperature, Carbon dioxide (CO2) level, luminosity and noise, which allow them to receive useful inputs for their wellbeing throughout the day. These indicators are integrated in the environmental monitoring system, which intends to monitor the status of the city.
The environmental monitoring system is important because it shows how sensors interact with the server and how the server communicates back to the sensors and other subscribers that need this type of information.
The Santander City provides another system, named “Participatory Sensing” (Description of implemented IoT services, 2014). This system allows users to actively participate in the city ecosystem (e.g. by publishing an event in the platform). The information is then sent to the SmartSantander platform. Additionally, users become subscribers of the city systems and are able to receive updates of the current status of the road they have to cross to reach their destination. This type of instant real-time information directly affects the city from a user’s point of view due to its constant availability and usefulness. An application is available for smartphones and users without smartphone can interact with the platform via SMS.
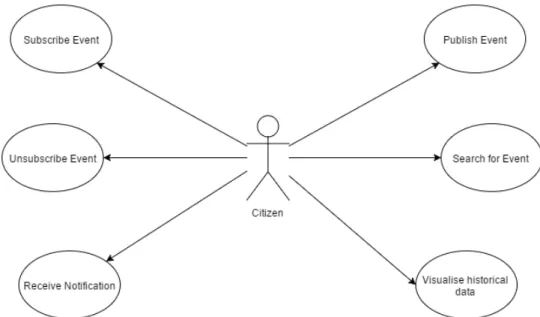
8
how they provide useful inputs to understand the type of data a user needs during application usage. It is possible to visualise that a user can, in this case, publish events, search for events, visualise historical data, subscribe and unsubscribe to events and receive notifications.
Figure 1 - Participatory Sensing - Use Case Diagram (adapted from (Description of implemented IoT services, 2014))
The components of the participatory sensing system are: a mobile client for end users to utilise; a server, capable of iterating through data and providing links between the apps and the SmartSantander platform also known as “Pace of The City Server”; and a module that allows devices to register onto the platform. Also, there is a system called “Universal Alert System” (UAS) system, which aims to fire user notifications.
Additionally, Santander provides other interesting case studies, which are “Precision Irrigation” and “Smart Metering”.
9 Smart Metering system aims to provide IoT based solutions to monitor energy usage in offices. To address this problem new components have been added to the architecture to generate, collect and store the data and information. In addition to these, intelligent components have also been created in order to provide useful information in a user-friendly way. These components provide data analysis in real-time and consequent knowledge extraction to identify energy failures and generate reports on energy consumption.
2.3 Internet of Things (IoT)
According to (Friess and Vermesan, 2013)the Internet of Things (IoT) “is a concept and a paradigm that considers pervasive presence in the environment of a variety of things/objects that through wireless and wired connections and unique addressing schemes are able to interact with each other and cooperate with other things/objects to create new applications/services and reach common goals. In this context the research and development challenges to create a smart world are enormous. A world where the real, digital and the virtual are converging to create smart environments that make energy, transport, cities and many other areas more intelligent.”
10
Internet and how people interact with it, due to the constant interconnectivity between people and the world. It will also provide the necessary resources for the creation of new applications and data driven platforms that will, hopefully, improve the citizen’s quality of life. This new way of reinventing the Internet will not only provide endless possibilities to improve the overall interaction between humans and machines but also create new challenges, which need to be tackled, to cities themselves. Furthermore, the work aims to develop data-driven models based on human actions to act as a proof of concept for Smart Cities. Additionally, the work concludes that the devices in the Internet of Things are able to gather data and provide knowledge and that a new age of interaction is about to appear, due to the increasing demand for smart applications.
2.4 Emergency Management
Emergency Management is the process that continuously prepares for a disaster even before it happens (Feng and Lee, 2010), intending to protect people from natural or man-made disasters. It is expected that it can integrate many emergency sources to provide the best possible outcome for the situation. In (Feng and Lee, 2010) the authors conclude that emergency management is of extreme importance in the nowadays world.
In (Benkhelifa et al., 2014) the authors listed the current disaster management projects. The purpose of this work is to summarize existing projects regarding this matter. This work is relevant due to its diversity and detail while presenting the projects, which is extremely important to have a baseline of what has already been studied and how it can, if possible, be improved. It is important to state that the focus of this work is wireless sensor networks, being the most relevant outputs the knowledge and awareness of the projects in this area. Also, the work delivers a wider perspective about the topic and led to discoveries regarding the State of the Art projects, which by itself ignited the discovery of solutions and use cases for each problem.
One of the major problems encountered when dealing with large amounts of data is the
system’s vertical scalability. It is also important to understand how similar systems
operate when larger amounts of data are in place so implementation choices can be made to avoid problems (Albtoush et al., 2011). This also enhances the overall viability and feasibility of the system.
11 (VANETs), sensors, social networks and Car-to-X, where X can either be infrastructures or other cars. These technologies are shaping the future with the objective of giving a ubiquitous sensing of the surroundings. These systems produce large quantities of data, changing the context of looking at them from small, simple solving problems, to big data problems that require stronger and more capable algorithms (Alazawi et al., 2014).
2.5 Smart Emergency Systems
Smart emergency systems are an extremely important piece for the welfare and wellbeing of people. These systems provide computational ways of responding to dangers. When they are in place, the probability of anticipating man-made or natural disasters increases. In (Radianti et al., 2014), the authors present emergency systems and then start to develop a platform that intends to mimic these systems in a smarter way. Figure 2 illustrates a smartphone based publish-subscribe system to accomplish this. The platform helps users by sensing their surroundings and assessing the current disaster scenario, providing them with a safer way to exit the building. It is interesting to analyse the communication that was developed as it takes the data from devices and delivers it, via a web-based broker, to managers and interested parties. The broker also forwards the data to a database where it is processed in order to retrieve sensor information in useful ways (e.g. charts, reports).
Figure 2 - Smart Rescue Platform (Radianti, Gonzalez and Granmo, 2014)
12
13
3. PROPOSED ARCHITECTURE
This chapter presents our proposal for an architecture for an IoT system. The background on the subject and the required technologies to implement a system using this architecture are also provided.
The systems already in place are decentralized, which means that they do not communicate between each other, making it almost impossible to prevent disasters. Most of the times these systems are designed to address a specific case or to work as an independent system that may receive information from many parts, although without the aim to deliver information to the necessary parties. With the intent to address these shortcomings, an architecture for a smart system in the context of smart cities will be
provided. This architecture has been created with awareness of the system’s possibility to
scale and to adapt itself to different contexts. It will address the problem of receiving the data, process it and then retrieve useful outputs to any party that subscribes to a specific type of content. This architecture can then be tuned to fit different use cases and scenarios.
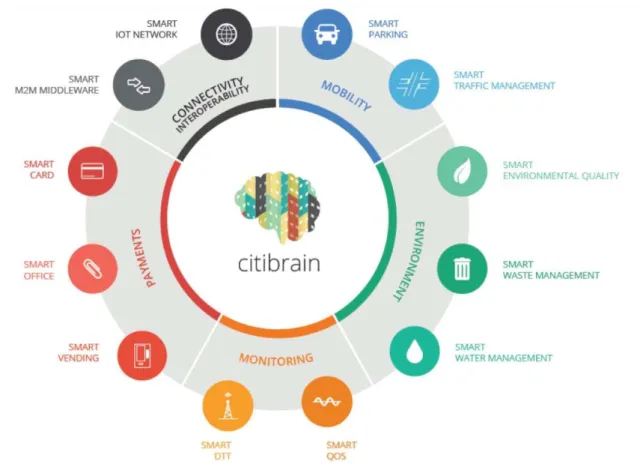
3.1 Citibrain
The architecture we are proposing will integrate Ubiwhere’s Citibrain platform. This platform already provides solutions such as:
Smart Waste Management – which intends to manage urban waste from a city with sensors placed in trash containers;
Smart Water Management – intends to manage water leakages in a city, aiming to
prevent, detect and correct these type of problems;
Smart Traffic Management – intends to solve the traffic problem in urban environments.
Figure 3 illustrates the current offerings of the Citibrain platform. These offers are divided in five main areas, which are:
Mobility;
Environment;
Monitoring;
Payments;
14
The main purpose with this platform is to provide the necessary tools to empower a city and make it smart. Therefore, it can be divided in areas which intend to segment applications, regarding their characteristics and usefulness in specific use cases.
The prototype we aim to develop will integrate the platform as a core component, providing unified access to alerts generated by other applications. For example, a user that subscribes the Smart Water Management Application and the Smart Waste Management Application will have access to a unified control centre. This control centre will monitor every application providing useful metrics from it.
3.2 Background
Systems in the IoT field require different technologies in order to be fully addressed, therefore this section aims to cover and introduce some of them which are, in some cases, the ones that have used.
Big Data is referred to as “(…) the processing and analysis of large data repositories, so disproportionately large that is impossible to treat them with the conventional tools of analytical databases” (Friess and Vermesan, 2013). The authors also explain that this data is produced by machines, which are much faster than human beings, and according to
15
Moore’s Law this data will grow exponentially (e.g. web logs, RFID, sensor networks,
social data, etc…) (Friess and Vermesan, 2013).
It is also referred that Big Data requires different technologies to process the massive amount of data within an acceptable amount of time, therefore some tools are presented in order to show the current standards in this field.
With the appearance of new technologies there is a new way of interaction between humans and the Internet via smart devices, which presents a challenge. This challenge exists because of the way that the Internet was created. Until now the Internet was based on a human to human kind of interaction, because it delivers content produced by humans for other humans. This kind of communication will not disappear, however new types of interactions will appear as smart objects integrate the nowadays world. These new types of interactions produce large amounts of data, which Big Data helps to store, with the objective of being analysed by intelligent algorithms and tools to extract information and provide knowledge. At this point it’s possible to conclude that Big Data requires special treatment as it is larger and contains more information than typical data.
Regarding this topic, the authors in (Friess and Vermesan, 2013) explain that major companies in the big data topic have a tendency to use Hadoop (Gu and Li, 2013) due to its reliability, scalability and distributed computing. Hadoop is a framework that processes big data in a distributed environment (Apache Hadoop, 2014). The Hadoop framework (Gu and Li, 2013; Apache Hadoop, 2014) is planned to scale up from single to multiple machines, where each of them provides storage and computational power, therefore it is a good way to implement the system. However, in more recent works Spark (Gu and Li, 2013) started to be used instead of Hadoop. Spark (Spark, 2015) is a general purpose, in-memory, big data processing framework that provides APIs in Java, Python amongst others. It also provides other tools important for machine learning (e.g. MLib, SparkSQL).
16
Finally the authors concluded that both frameworks are good, but their application depends on the situation. If there is a lot of memory to run the application, Spark is definitely faster than Hadoop, on the other hand Hadoop uses less memory but much more space in disk.
Other types of data processing are also interesting in the Internet of Things (IoT) context, due to their ability of processing data streams. For instance we can point out Complex Event Processing (CEP) (Chen et al., 2014) and Storm (Toshniwalet al., 2014). Notice that CEP is only a method of analysing and processing streams of data, while on the other hand Storm is a distributed computation framework that helps with the processing of large streams of data.
CEP is defined as an effective mechanism that analyses data and its context to trigger events (Chen et al., 2014). CEP can, for example, analyse streams of temperature and determine if changes in that temperature are normal or abnormal and can also relate different types of events that lead to a single complex event, such as: (1) flames; (2) temperature spike; (3) sudden humidity decrease. From these three events the system could infer that a fire was happening. Additionally (Chen et al., 2014) aims to develop an architecture for the IoT based on distributed complex event processing. The intent behind distributed CEP is to shorten the bandwidth and the necessary computation for event detection. The leading tool for CEP is Esper (Esper, 2015) which is an open source Java implementation of a CEP engine, which allows for real time stream processing.
17 Furthermore, Figure 4 illustrates a fault tolerant and scalable architecture for handling data (Apache Storm, 2014). Additionally, this architecture provides the concept of worker that can be interpreted as a node which is programmed to execute a specific task. These tasks may vary, although a good example can be the use of a worker to process the stream with the Esper queries, which are statements similar to SQL which allow the processing of events in real time.
Additionally, Esper and Storm can help one another: Esper needs something to organize and provide data, which means that some system needs to be implemented to provide data to Esper. This is where Storm can be useful as it can handle the data management while Esper handles the queries. This approach will join both systems to enhance both of their main capabilities when dealing with these types of data.
To access the data from cities, sensors and other devices are required. These devices and the communication protocols are comprised in the concept of Machine-to-Machine (M2M) (Wan et al., 2012). M2M refers to the automatic communication between computers, sensors and other devices in the surroundings (Wan et al., 2012). This topic is relevant because it makes sensor-to-server communication and sensor-to-sensor possible. This allows the system to constantly check for new data and vice-versa. This concept leads us to publish-subscribe services. According to (Ordille et al., 2009) these services broadcast information to the subscribed parties and in these types of systems, a subscriber is a device that will receive information from the publisher. This translates into a much more transparent system, because the publisher can send information to the subscribers and vice versa. In (Radianti et al., 2014) the publishers are treated as the ones that generate information in the form of events, subscribers are treated as the ones that
18
subscribe to arbitrary flows of information and brokers are a middle layer between the two participants to pass along the information.
3.3 Architecture Example
In this subsection, current use cases of similar systems will be addressed. This will result in a better knowledge base for the current standards in the area. For this, not only examples of smart cities will be presented but also examples of emergency systems that became smarter with the inclusion of these new concepts.
Beyond the systems studied in chapter 2, one more was analysed. The system which was analysed was the SMARTCAMPUS that aims to equip the SophiaTech campus, in France, with sensors to inspire the creation of new applications (Cecchinel et al., 2014). Once more the system was chosen due to its usefulness and value in terms of possible inputs for our system.
19 3.4 System Architecture
After gathering all this information it is important to clarify the requirements for the system we aim to develop. These requirements were assembled by reviewing the state of the art systems. Below a list of requirements will be presented:
Handle, process and store streams of data from sensors;
Generate alerts from the incoming stream of data;
Generate predictions from history data;
Provide KPIs (Key Performance Indicators) and historical data;
An API for users and developers to connect.
Thus, we have come up with a proposal for an architecture. This architecture will provide a way to gather information from many sources, process it and provide useful information to the interested parties.
One of the most important things to understand is that nowadays data comes mostly in streams, which presents an issue due to the tools needed to process it. The tool that is projected to be used is Storm, which has already been described. Even though Storm, by itself, cannot retrieve the most accurate results in real time, due to the processing time needed, it is planned to overcome this problem by implementing a parallel processing block with Hadoop. This will not only provide exact results when the large amount of data is processed, but also provide a better knowledge of the data.
The approach was inspired by the lambda architecture (Lambda Architecture, 2014) with the publish/subscribe pattern. The background from other related projects allowed us to
20
perceive that some technologies may not suit very well the collection and direct processing of data. Thus, we opted for a more complex approach that allows a more scalable and reliable system.
This type of approach also led us to extend the capability of receiving data from multiple sources, which is extremely important in the context of IoT.
In Figure 6 our proposal for the architecture is presented.
Our architecture is projected to act as an API to provide a connection between data in the IoT and the end user, with the intent of providing relevant information regarding emergency situations.
The system will receive a data stream from IoT nodes, which is then split in two parts to be processed by the batch layer, responsible for demanding calculations and the speed layer which delivers results in real time. After that, the data is merged with the intent of providing the result with the biggest confidence level associated. When the data is merged a bottleneck can happen, although this situation will be prevented by accepting the first result to appear with the highest confidence level. This can happen in two ways: (1) the stream layer finishes and the batch layer continues to process; (2) the stream and batch layer finish almost at the same time. In the first scenario the stream layer result will be
21 returned with a confidence level attached to it. In this second case the data will be merged to provide the most accurate output.
After the data is merged, it reaches another processing block, which intends to filter and redirect the acquired knowledge to the subscribed parties. Additionally this block sends the processed data to the statistical data block. The latter block not only keeps track of statistical data to help understand patterns along the year but also provides data to construct KPIs, charts and reports.
After all the processing is done, users can access the data in two ways: (1) via the API, which is projected for developers who want to build applications around this context; (2) via the data output, which will serve to return the data to the subscribed parties. Additionally, the API will provide a way of notifying other sensors, which means that if a sensor sends an alert, other sensors around it will be asked for their current situation to locate the hazard with maximum precision. This type of communication is also important if the alert is located, for example, near a road, since the system can be prepared to notify street lights to prevent drivers from entering the affected road and in highways a lane can also be closed being the traffic redirected to other lanes or roads.
3.5 Use Case
Our architecture can be applied in many different scenarios; one of them will be addressed so that we can establish an example to explain some of its functions.
22
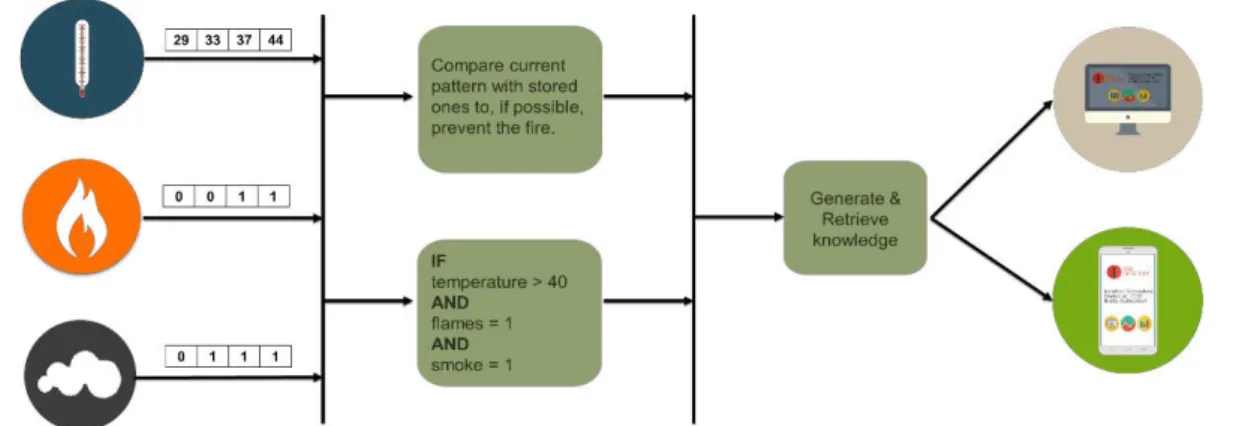
Figure 7 - Example application
Having different types of sensors allows us to better understand whether the fire is happening and different combinations of events can occur, thus the system must have something to divide the ones that are indeed problematic. Furthermore an example shall be presented:
If there is smoke, flames and the temperature passes the threshold, then we have a
fire;
If there is smoke, no flames and the temperature is rising, it is possible that we
will have a fire.
Many more combinations can be presented, although these explain the concept that we are trying to achieve.
On the IoT data comes mostly in streams, hence we need to account for the data stream that is arriving. For instance, the architecture should use a publish-subscribe messaging system, which handles the stream and splits it into events that can be processed by the rest of the modules. The events that have been split will be processed by both layers. At this point, in the speed layer, there are two important things to acknowledge: (1) it is advised to use a complex event processing tool due to the event driven nature of the system; (2) a database with high write speed for storing alarming events is also useful, because of the high demand from the system. This will provide an event based approach which will detect event correlations and deal with the data stream that is constantly changing. This approach will also provide the ability of integrating many types of events at once, this will expand system acceptance in terms of receiving events and inevitably prepare it to explore further sensor integrations.
23 charts and predict whether it is important or not for emergency response teams to be prepared. From a high level perspective this type of inputs seem to have a great importance, such as divide a specific fire protection team to a zone which is prone to peaks of fire during the summer or redirect traffic because a particular road is more likely to be affected by the floods in the winter.
The rest of the components do not need to be a specific technology, although we point out some advices for when choosing the technologies to work with.
The processing components in the system can be executed with any programming language and should withstand the volume and velocity of data, also the code should be optimized to minimize overheads and bottlenecks. The database should be chosen according to the needs of each specific scenario. It is important to understand that many database systems can be chosen to incorporate the solution, although for each specific situation a brief analysis of the problem should be made in order to perceive the best possible choice. As a practical example we can point out that the database in the speed layer should be in-memory due to its velocity, while on the other hand the statistical storage could be a NoSQL database that supports large quantities of data to enhance overall system scalability.
Moreover other important aspect to discuss is the communication. The way the system is designed, and from the lessons learned from the use cases (e.g. Santander city systems), the best technologies should be REST, WebSockets and AMQP. REST will provide an easy and consistent way to access the API, providing endpoints for events and the ability to execute filters in the queries; WebSockets are useful due to their ability in terms of real-time communication and the AMQP protocol is important to establish connection between the system, sensors and actuators scattered in the city in order to extract information.
24
3.6 Technologies Used
In this section we intend to list and introduce the technologies that are needed to develop this architecture. Thus, the list bellow contains all of the technologies used to develop the system:
RabbitMQ (RabbitMQ, 2015) – This is an open source messaging broker, which
implements AMQP (Advanced Message Queueing Protocol). It was written in Erlang language which allows it to guarantee messaging failover. RabbitMQ is currently owned and maintained by Pivotal. RabbitMQ provides two different ways of communication, which are queues and exchanges:
o Queue – A queue is a mechanism that provides asynchronous communication between a sender and a consumer. It can be seen as an infinite buffer of messages that await processing;
o Exchange – An exchange is a mechanism that allows queues to be connected and to receive the events that are sent to it. This is an important concept because it allows the consumer to connect multiple queues.
In our prototype RabbitMQ is the messaging system used for all communications.
Meshblu (Meshblu, 2015) – This is an open source M2M messaging tool that
allows data from the sensors and machines to be sent in an understandable way. It is used in our prototype to send the data from sensors to RabbitMQ;
REST (REST, 2015) – Although not considered a technology, REST is very
important so it was decided to include here. REST is an architectural style that allows web services to scale and communicate. It uses the HTTP verbs such as GET, POST, and DELETE. REST is used to expose an API, which handles the system’s overall functions;
Java (Oracle, 2015) – It is an object oriented programming language that allows
developers to create robust and secure enterprise applications. It is known for allowing to “write once, run anywhere”, as it is present in desktop, mobile and even web applications. This programming language is used to build almost every component of the prototype;
25 facilitated web development with Java. It is used to manage REST calls, dependency injection and HTTP responses;
Socket.io (SocketIO, 2015) – It is a JavaScript library to implement WebSockets
on real time web applications. Therefore, it enables real time, bidirectional communication. It is very popular because it has multiple fall-backs which guarantee the delivery of the message. In our prototype Socket.io is used to guarantee WebSocket connections to the generated events;
Esper (Esper, 2015) – It is an open source Java implementation of a Complex
Event Processing (CEP) engine, which allows for real time stream processing. For the stream processing it uses Event Processing Language (EPL) which is very similar to SQL. Esper is, in our prototype, the chosen CEP engine to generate events from the incoming data;
Node.js (NodeJS, 2015) – It is an open source runtime for server-side JavaScript
code. It is widely used in real time web applications due to its event driven architecture. Furthermore it uses the Google V8 engine (Google Developers, 2015), which compiles JavaScript to machine code. Node.js is the second programming language used by our prototype. It was used to create the WebSocket server and can be used to create the clients as well.
27
4. SYSTEM DATABASE EVALUATION
In this section we describe the NoSQL database Cassandra, chosen to integrate our system. To the best of our knowledge, a perfect solution for the Internet of Things data layer is yet to be found. With this in mind we aim to find the best possible solution for these type of systems. Thus, we started exploring which database would be the most suitable to provide a production ready environment. The database will be used in an Internet of Things system which needs to be production ready and receive enormous amounts of events in real time. This system intends to gather data from a city and process it in order to find events that are considered dangerous.
4.1 Overview
Systems on the IoT scope that deal with sensors is becoming gradually difficult to scale due to the amount of sensors and clients that extract data from them (van der Veen et al., 2012). Therefore it is important not only to pay attention to the velocity of the data, but also to the probable volume that it will gain during the time the system is deployed. With the inclusion of social mining it can even reach new dimensions in terms of volume and variety.
According to (Abramova et al., 2014a, 2014b, 2014c) Cassandra seems to have a clear advantage in terms of the needed characteristics to be implemented in our system.
“Cassandra system was designed to run on cheap commodity hardware and handle high
write throughput while not sacrificing read efficiency” (Lakshman and Malik, 2010), also
the decision of choosing Cassandra is related to the market share and popularity (DBEngines Ranking, 2015).
28
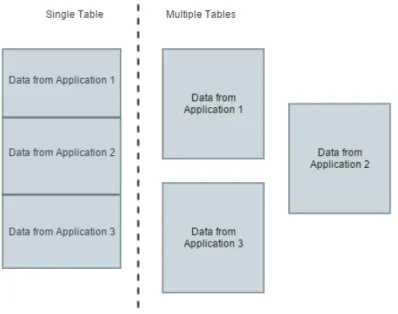
The main reason for this analysis is to understand which architecture for the data layer would best suit the needs of an IoT platform in terms of querying performance, without sacrificing the write speed. There were two ways which we have thought would be relevant in terms of implementation. First, a single table with all the data, which would then be filtered and dealt with when needed. A second approach is multiple tables for each specific application that sends events. From a theoretical standpoint it seems that the best way of organizing our data is through the creation of a table per application. This will result in smaller tables which, in comparison to a centralized table that stores everything is a lot faster because they have significantly less records. In the coming sections some experiments were documented for better understanding. Figure 8 illustrates the two cases, where on the left we can find the single table and on the right the multiple table configuration.
Figure 8 - Data layer possible architectures
4.2 Cassandra
Cassandra is a distributed storage system that manages large amounts of data across servers (Lakshman and Malik, 2010). Still according to the authors Cassandra uses a combination of well-known procedures that grant scalability and availability.
4.2.1 Data Model
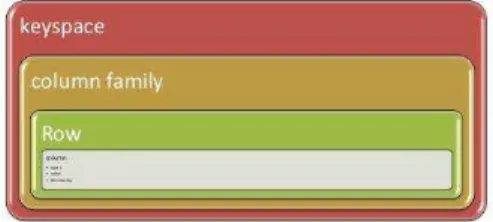
Cassandra’s data model provides a high processing speed when writing the data, this is
29 Cassandra indexes data by key, this key is a unique representation of the row which contains the data. Each row contains columns, which are attributes and finally these columns make up a column family.
Figure 9 illustrates the data model, which is composed by rows, column families and keyspaces.
Furthermore we shall address the two important concepts which make up the data representation in Cassandra, which are the column families and the keyspaces.
Colum Family – A column family is a container for a group of rows (Hewitt,
2011). Column families are not defined, which means that the structure can be changed at any desired time, this improves the system’s readiness to change and adapt during time;
Keyspace – In Cassandra the keyspace is the equivalent to a database in the
relational paradigm. The keyspace contains the column families which make up the full database. The keypaces contain attributes that can be tuned to enhance the overall performance of the database, these attributes are:
o Replication factor – which refers to the number of physical copies of the data. For example if the replication factor is set to two data will be replicated twice;
o Replica placement strategy – this attribute is used for defining the strategy of how data is placed in the cluster. There are some possibilities to define the replicas. As examples we can point out the SimpleStrategy which is most used when we have a single group of nodes in the cluster and NetworkTopologyStrategy which is more used when the cluster is working across multiple machines providing a way of managing the replicas in all the machines.
30
Lastly, Cassandra provides the notion of Super Column Families which are useful to define new types of data or more complex data structures which are not yet defined by the default types. The Super Column Families are organised in Super Columns which contain a name and the new columns that are needed. For example, if a new type “Address” is to be defined the Super Column should contain the new type name, in this case “Address” and then a key-value map which contains the attributes of the type (e.g. “Street”, “Street Name”).
4.2.2 Architecture
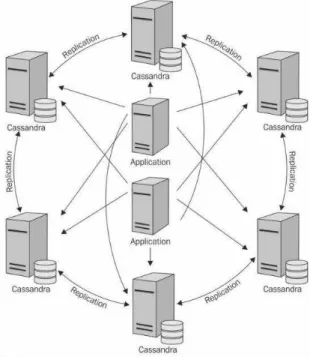
In this section is given an overview of the Cassandra architecture. Cassandra uses a peer-to-peer architecture, which means that all nodes within a cluster can receive a request and respond to it (Strickland, 2014). This provides better availability when the database is online. Also, this provides redundancies which help to keep the data safe and horizontal scalability. In Figure 10 we can observe the Cassandra peer-to-peer architecture.
Figure 10 - Cassandra Architecture (Strickland, 2014)
Furthermore, this architecture provides high availability to the database, this means that the system does not have a big downtime period, providing constant access to the data.
4.2.3 Replication
31 Cassandra provides two different replication strategies:
Simple Strategy – This strategy is normally used for single data centre deployments (Datastax, 2015). When this strategy is done, Cassandra will find the first replica and then will perform a clockwise movement to store the next replica. When creating this strategy the number of replicas must be defined. Figure 11 illustrates this strategy. The first replica is the original inserted value, the rest are copies placed in a clockwise fashion to replicate the data. The replication factor used was 3.
Figure 11 - Simple Strategy
Network Topology Strategy – This strategy is used when the cluster spans across
multiple data centres (Datastax, 2015). It places the replicas the same way as the Simple Strategy, although it places them in different physic groups (racks) to enhance the safety of the data in case of sudden crashes. When creating this strategy the number of replicas and the number of data centres to keeps those replicas must be defined. Figure 12 explains this strategy by providing an example. This example creates the copies in two different Data Centres with a replication factor of 3.
32
4.2.4 Writing and Reading
Cassandra is a Column Family NoSQL database, which translates into a data format storage which is vertical oriented. The appropriateness of this database for logging systems (Abramova et al., 2014a), led us to acknowledge that it could be used in IoT. Additionally (Abramova et al., 2014a) provides an architectural overview stating that Cassandra divides each received request into stages to enhance the capabilities while handling and serving a high number of simultaneous requests. This allows Cassandra to improve its performance, however it is limited by the host machine characteristics, mainly by the memory available. Finally, and because RAM memory is a lot faster than the standard HDDs and SSDs Cassandra needs to have a mechanism that will handle writing all this data to disk, in background. According to (Abramova et al., 2014a) this mechanism is called memory mapping and consists in two similar mechanisms: the Key Cache and Row Cache. Key Cache handles in memory mapping of the stored keys and
it’s solely responsible for storing in RAM these keys, providing fast read/write speeds on
them. On the other hand, Row Cache is the memory mapping for each row.
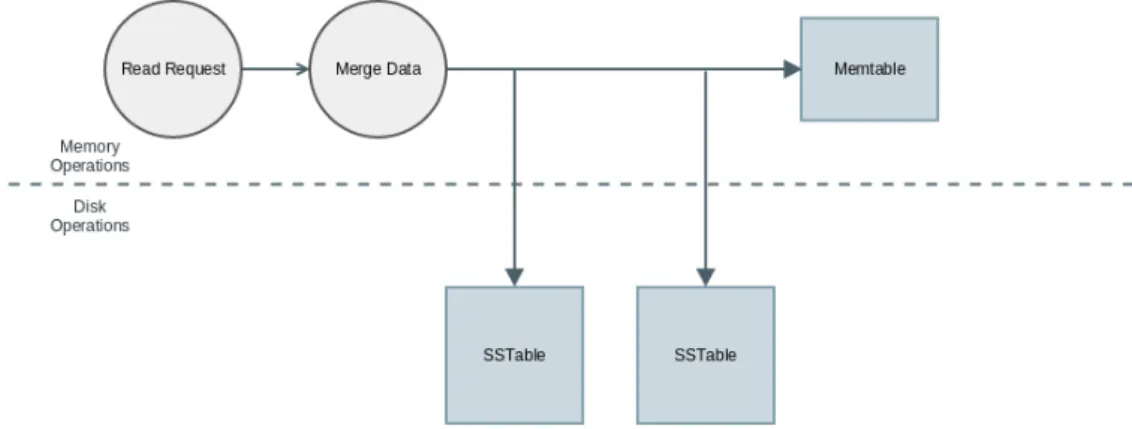
To better demonstrate the life cycle of a record being written in Cassandra we will provide an overview of the writing architecture. Figure 13 explains how Cassandra writes a record. First it writes every arriving row in the commit log, then it replicates this data on the Memtable. The data is replicated in the commit log to ensure that there are no records lost. The data which is now on the Memtable will only be written to disk when a flush happens. A flush can happen when: (1) it reaches the maximum allocated memory; (2) after a specific time in memory; (3) manually by the user. When flushed, the Memtable becomes an immutable Sorted String Table (SSTable) which stores all the data (Ordille, Tendick and Yang, 2009).
33 Figure 14 explains how Cassandra reads the data within one cluster. A request is made to any node in the cluster, the chosen node will become responsible for handling the requested data. The request is then processed and all the SSTables for a specific column family will be searched and the data will be gathered to merge data. Merge data is useful because of the replication factor of the tables, for instance nothing guarantees that the data is all stored in the same table. When a read request is made it might need to gather data from multiple tables, merge data allows this data to be combined.
4.3 Experimental Setup
The experiments that will be made will allow to learn which approach is better when storing data in the IoT. As mentioned before we have decided that there were two ways to organize the database which would be relevant in terms of implementation. A single table with all the data, which would then be filtered and dealt with when needed, or multiple tables for each specific application that sends events.
The experimental setup was created with the following characteristics: (1) The operating system was Ubuntu 14.04 LTS 64bit; (2) The machine had a dual core, Core i5 480m with 6GB of RAM and an HDD; (3) Cassandra ran in a single node to understand the minimum possible requirements when running the system.
We have decided not to use a benchmark tool because we have concluded that most tools available nowadays do not provide the necessary requirements to test the database system with the necessary characteristics. Also with this approach we guarantee that the performances we see are more accurate and can be replicated in a production environment.
The chosen queries intend to illustrate regular situations during the usage of the system, which reflect the better approaches to the problem, keeping in mind that attention to the
34
write speed is also needed. To analyse them, different queries will be created, matching the needs while the system is in place. These queries may vary from time to time, although some of them will be a recurrent task that needs to be performed. Additionally, it is important to keep in mind that these queries are to be performed in an IoT system, which generates alerts with the data that comes from the sensors scattered around a city. The idea is that these alerts are filterable and searchable throughout the lifecycle of the system.
In the experiments we have the following queries:
Q1: Alert selection from a specific type – This query is performed to provide the number of alerts of each type (e.g. Number of ‘warning’ alerts);
Q2: Alert selection for a submitted rule – This query will be used to see how many alerts were raised by a submitted rule (e.g. how many alerts were generated by rule X);
Q3: Alert selection in a range of time – This query serves to select a type of alerts (e.g. ‘warning’, ‘critical’) in a period of time.
These queries give a broad perspective of the system in terms of querying performance. To query the database we use the Cassandra CQL shell, to record the times we have enabled tracing which allow us to have a detailed view of the query and created indexes to allow filtering to happen. Figure 15 shows the row prototype.
Figure 15 - Row prototype
The row is composed by the following columns:
alert_uuid – This field is of the type UUID, it represents the universal id of the
alert to keep each alert unique;
config_id – This field is of the type UUID, it represents the application id which
created this alert;
event_query – This field is of type TEXT and it represents the rule needed to fire the alert;
alert_type – This field is of the type VARCHAR and represents the type of alert
35
event_type – This field is of the type VARCHAR and represents the type of event to be processed (e.g. Environment, Traffic);
event_window – This field is of the type TEXT and represents the event window
which triggered the alert;
event_body – This field is of the type TEXT and represents the full event which
triggered the alert;
created_on – This field is of the type TIMESTAMP and it represents the
timestamp on which the alert was triggered.
On the next section we will present the results of the experiments.
4.4 Query execution evaluation
In this section we evaluate the query processing time. Each chart contains, in the Y axis,
the “Query Time (ms)” which represents the time the queries took to be processed. In the
X axis, we have “Table Name” which represents the table where the query was made. The tables are divided by configuration and each represents an application. The “Table Name” axis uses the following notation:
App1-App5: correspond to applications with data that comes from environmental
sensors. Each of these applications have 100.000 records;
All: corresponds to the single table containing all the information. This table will
have 500.000 records.
The values presented in the experiments were obtained by executing the same query five times and then calculating the average value. Also, the first three queries of each run were discarded due to the possibility of cold boots. In the figures the dots represent the average value of the query speed and the error bars represent the standard deviation to that value. For a better approximation of a real system, the queries were made in no specific order. This has to do with the Cassandra reading architecture which is faster if the table is in memory.
36
4.4.1 Querying an alert of a specific type (Q1)
In the experiment we use this query to select all the alerts of type ‘warning’ from the applications. Using the CQL language the query looks like this:
SELECT * FROM query_performance.alerts_<config_id> WHERE alert_type = <alert_type>;
For the table with all of the data the query used was:
SELECT * FROM query_performance.alerts_full WHERE config_id =
<config_id> AND alert_type = <alert_type> ALLOW FILTERING;
This a very simple query, since it only lists the alerts of type ‘warning’ that were generated by the application. However it is expected to see an enormous change in terms
of performance, due to the amount of data in the “All” table.
Figure 16 – Query execution time of Q1
37 4.4.2 Querying an alert for a rule (Q2)
This query intends to list every alert for a specific rule created by the user. The query, using the CQL language, will look like this:
SELECT * FROM query_performance.alerts_<config_id> WHERE event_query = <rule>;
For the full table the query looks like this:
SELECT * FROM query_performance.alerts_full WHERE config_id = <config_id> AND event_query = <rule> ALLOW FILTERING;
The query on the full table could not be completed because the operation timed out. The operation quitted when filtering the data with the where clause, this is due to the amount of data it needed to filter. We have tried to change the environment settings for Cassandra to try to overcome this situation, but the error persisted. This led to the removal of this query from the charts. Due to this problem, the comparison was made only between the applications. Furthermore, we can conclude that this query cannot be made in a production environment because the system cannot be stuck waiting for the query to end. On a real world system, and because IoT systems require near real time responses, it is impossible to implement this query because of the error it kept raising.
Figure 17 - Query execution time of Q2
38
to draw from this experiment is that the table with all the data could not be queried because it kept raising an out of time error. This is due to the amount of data which is stored in that table which Cassandra cannot filter.
4.4.3 Querying an alert on a time range (Q3)
This query selects all the alerts of each application in a time range. In the real system this query is important because it delivers a query that provides a time based approach to the data. Using the CQL language the query looks like this:
SELECT * FROM query_performance.alerts_<config_id> WHERE created_on <= <timestamp> AND config_id = <config_id> ALLOW FILTERING;
The query made on the table with all of the information will look like this:
SELECT * FROM query_performance.alerts_full WHERE created_on <= <timestamp> AND config_id = <config_id> ALLOW FILTERING;
This is a simple date query, it only filters data by timestamp. However, it is expected to see an enormous change between the applications and the “All” table.
Figure 18 - Query execution time of Q3
39 4.5 Summary
The results show that, as expected, the single table had the worst performance. This is due to the amount of data that Cassandra has to filter, which cannot be placed in memory all
at once. Although the results of the “All” table were not five times worse we conclude
that the best implementation is with separate tables which not only give a better performance, but also provide a better overall data separation.
The performance changes between the first two applications are a little bit different, this might be due to the size of the string that is being searched. The main differences are between the “All” table, which was finished on Q1 but not on Q2. This is due to the fact that, on these tables, data is sequentially organized which means that if the query results are not on the first records, Cassandra cannot load all the data to memory and initiate the filtering process.
The average query processing time in Q3 is a lot less than on the others, this is related to the fact that the dataset is not heterogeneous enough in terms of dates because the values of the applications were recorded on a single day. Also, filtering is made by primary key because in Cassandra to make a time range query the column with the date needs to be on the primary key of the table.