Assessment: Scientific Foundation
Robert J. Nozza, Ph.D.
Department of Communication Sciences and Disorders, The Univcrsity of Georgia, Athens, GA 30602
here are a number of factors currently influ-
T
encing pediatric hearing assessment. The trend toward universal newborn hearing screen- ing and very early identification suggests that we will be assessing hearing of young infants in larger numbers than ever before. As a result, there will be an increasing need for reliable and valid assess- ment methods for infants. In particular, it is im- portant that we have the means for estimating frequency-specific and ear-specific thresholds. In addition, there is a need t o gather information on other aspects of auditory processing in infants t o help us in making our amplification and manage- ment decisions. This article focuses on issues not only related t o scientific foundations of current hcaring assessment methods, but also on research that can impact our understanding of the relation- ship between assessment data and the ability t o process meaningful auditory information in the environment.There are several issues to consider in the rela- tionship between research and clinical practice as they relate to assessment and to the link between assessment measures and the process of evaluat- ing and fitting amplification. First, it is important that our clinical assessment measures be sup- ported by normative data. For example, interpret- ing thresholds of infants and young children in the clinic depends on an understanding of the thresh- olds that are provided by infants and children with normal hearing. Infants and young childrcn undergo developmental changes in several dimen- sions of the sensori-perceptual process, any of which can affect the outcome of an audiological assessment.
Second, to make better decisions regarding man- agement of hearing impairment, we need t o know something about how infants and children use au- ditory information at various stages of develop- ment and what impact reduced hearing sensitivity
has on that process. For example, how does an in- fant with normal hearing process speech and what happens to that capability when the signal is de- graded by hearing impairment? Consider the pro- cedures we use for fitting amplification. They are primarily threshold-based prescriptive procedures. Obviously, the greater the reliability and validity of the thresholds obtained, the better the chance that the prescriptive fitting will be appropriate. But threshold-based prescriptive procedures were not developed based on threshold data alone. They are based on a relationship between thresh- olds and some measure of, o r some assumptions about, suprathreshold processing of speech. There are different assumptions underlying different pre- scriptive procedures, but all of them have as an objcctive to amplify speech to a level that is com- fortable a n d o r that produces the greatest intelli- gibility for the listener. Given the number of dif- ferent threshold-based procedures, it is easy to see that there is no consensus on how thresholds relate to what hearing impaired ears require in terms of amplified speech. Further, most prescrip- tions are not based on data from infants or very young children. Answering questions related to more complex auditory processes in infants, and the effect of hearing impairment on those pro- cesses, almost necessitates laboratory research.
Third, in the laboratory setting, variables can be controlled that cannot be controlled easily in a clinical setting. Tracking and/or manipulation of test variables such as trial interval duration, step size, and trial type (stimulus versus control trial) can be done easily in a laboratory setting. As a re- sult, information on the methods used can be gath- ered in a systematic way. The work done in the laboratory can and should contribute t o the devel- opment and improvement of our clinical methods. Finally, work that goes on in the laboratory should force us t o question some of our assump-
40 Trerids it1 Antplification
tions. Hopefully, the following discussion will stimulate us to think differently about some of the issues that are raised. We should never become complacent and assume that we have all of the knowledge and information that we need. Ideally, the relationship between the clinical process and the work that goes on in the laboratory is syner- gistic. There are different objectives for work in the laboratory and for work in the clinic. How- ever, in the field of audiology, the best work in the laboratory is driven by clinical questions and the best work in the clinic makes use of knowledge that is gained in the laboratory.
In cooperative adults and older children, the assessment stage and the beginning of the man- agement and follow-up stage are somewhat dis- tinct. Typically, the assessment stage is complete before the initiation of the hearing aid fitting pro- cess, except, of course, for regular follow-up eval- uations and/or examinations to evaluate perceived changes in function. However, in the younger child and infant, the process of selecting and fitting hearing aids often must begin before the assess- ment stage is complete. Development of a com- plete and valid audiogram of an infant occurs over a period of time. Introduction of amplification can be deemed necessary long before the assess- ment is complete, so there is an overlapping, highly inter-related process that goes on and it should not be viewed as two separate and distinct processes. Assessment then becomes part of the intervention. This is important because it may im- pact the choice of assessment method at various points in the clinical process.
The four basic assessment methods used with infants and children are auditory brainstem re- sponse (ABR), otoacoustic emissions (OAE), au- ral acoustic immittance and behavioral test meth- ods. After just a brief overview of some recent work in ABR and OAEs, the discussion will focus on acoustic immittance testing and behavioral measures of hearing. (See Sabo, in this issue, for more information on ABR and OAE measures in the clinic.)
ABR
Research has played an important role in de- velopment of the ABR as an assessment tool. Re- search has been influential in three areas that are of particular interest to the pediatric audiologist: Development of stimuli that are capable of gener- ating a frequency specific ABR for clinical appli- cation, measures of developmental change in the
ABR and the correspondence between the ABR and behavioral measures of hearing.
The inadequacy of the transient, or click, stim- ulus to provide frequency specific information that correlates with behavioral thresholds in var- ious configurations of hearing loss has led to at- tempts in clinical research laboratories to deter- mine stimulus configurations that would best provide a frequency specific ABR. Gorga et al (1989) provided data on normal patterns of re- sponses for the ABR in infants. Stapells and Oaks (1997) studied several methods for improving the frequency-specificity of the ABR and the degree to which the methods produce results that are predictive of behavioral thresholds. In spite of some reports that tone-burst ABRs are not as good as stimulus arrangements using various gat- ing functions or high-pass or notched-noise mask- ing, Stapells et a1 (1995) have shown excellent re- sults using tone bursts alone as well.
With respect to developmental changes, there have been many studies examining changes in la- tency of the ABR with age early in life. Using ABR waveforms to predict threshold, however, reveals that by 340-6 months of age, ABR thresh- olds are similar to those of adults. This is not con- sistent with changes in behavioral thresholds dur- ing infancy and will be discussed further in the section on behavioral testing.
Agreement between ABR thresholds and be- havioral thresholds can be quite good when proper stimulus conditions are used. Stapells, et a1 (1995) have been able to demonstrate good agreement between tone burst ABR thresholds and behav- ioral thresholds in both normal and impaired ears.
OAE
between the O A E and audiometric thresholds that suggests that we can separate normal from abnormal ears with a high degree of accuracy. These data indicate that the OAE may be fairly predictive of the degree of hearing loss in im- paired ears, at least up t o 50-60 d B HL. As our understanding of this phenomenon grows, the work of researchers in this area will translate into improved clinical assessment methods. The devel- opment of a condition that was unheard of before the discovery and clinical implementation of OAEs, auditory neuropathy, has caused us to view indi- viduals with sensori-neural hearing loss in a dif- ferent light, as well.
ACOUSTIC IICIMIITANCE
As part of the pediatric assessment battery, es- pecially as pertains to the ongoing management of an infant or child with hearing loss, acoustic im- mittance testing serves to alert us to changes in middle ear status. This is critical for a child wear- ing hearing aids for which gaidfrequency re- sponse has been determined with a healthy mid- dle ear. Research over the past decade o r so has altered the way we measure and interpret acoustic immittance information. Incorporation of the new data into clinical practice has been slow, however.
One event that has changed the way we inter- pret acoustic immittance information was the de- velopment of an ANSI standard (S3.39,1987) for aural acoustic immittance measures. This stan- dard calls for use of absolute physical quantities in specifying middle ear function. This development made obsolete instruments that used what are re- ferred to as arbitrary compliance units rather than units of admittance (mmhos) o r units of imped- ance (ohms). It also encouraged investigation into quantitative analyses of immittance data as op- posed t o the pattern classification scheme made popular by Jergcr (1970).
Pattern classification has been most successful when the pattern is flat. The flat pattern indicates middle ear effusion a high percentage of the time. However, only a fraction of ears with effusion produce a flat tympanogram. In addition, very few ears with middle ear effusion (MEE) produce a tympanogram with peak immittance and tympan- ometric peak pressure (TPP) within the normal range. The bulk of ears with fluid behind the tym- panic membrane produce tympanograms that are classified as type C (i.e., peak immittance within a normal range, but with high negative TPP). Un- fortunately, many ears without M E E produce
type C tympanograms as well. Even with subclas- sification of the type C, the ability of pattern clas- sification of tympanograms to identify M E E is limited. In attempts to improve diagnostic perfor- mance, the pattern classification system has been taken t o extremes and has resulted in schemes with as many as 15 different patterns (Cantekin et al, 1979), with no real improvement in perfor- mance with respect to identification of MEE.
Along with the change to absolute physical units of measure for the tympanogram, attention has been brought back to the value of tympano- gram shape in the diagnosis of MEE. In the A,B,C scheme, tympanogram shape is largely ig- nored. Except for peak versus no peak, there is no use of information related to the rate of change in immittance near the peak as a function of ear ca- nal pressure. The notion that tympanogram shape, o r gradient, contains valuable information with respect to the presence or absence of middle ear fluid is not a new one (Brooks, 1968,1969). How- ever, the use of the arbitrary compliance units in clinical instruments made the gradient measure difficult to apply. In 1986, de Jonge published a paper that examined normal properties of differ- ent gradient measures, one of which was called tympanometric width, using tympanograms that were based on absolute physical units rather than arbitrary compliance units. Subsequently, Koeb- sell and Margolis (1986) and Margolis and Heller (1987) investigated the use of tympanometric width for idcntification of M E E with young chil- dren and found the results to be encouraging. In 1990, in a revision of the ASHA guidelines for screening for middle ear disease, a cutoff based on tympanometric width was included, along with one for peak compensated static acoustic admit- tance, as independent criteria for referral for mid- dle ear disease. Both are quantitative measures and contribute t o the description of important characteristics of the tympanogram. The use of quantitative analysis of tympanograms in identifi- cation of M E E was further supported in new ASHA (1997) guidelines and in a position state- ment on screening by the American Academy of Audiology (1997).
42 Trends in Amplification
tympanograms in clinical practice. Because tym- panograms now are not based on arbitrary units of compliance and they must conform t o stan- dards with respect to aspect ratio, the relationship between the scale for immittance (admittance in mmhos or impedance in ohms) on the y-axis ver- sus the scale for pressure (in daPa) on the x-axis, their appearance is slightly different from those that were based on arbitrary units. Clinicians and investigators have been forced to establish their own criteria for a flat, o r type B, tympanogram, and many have still not incorporated the infor- mation on tympanogram shape. Of course, gra- dient or tympanometric width information is available now on many commercial immittance in- struments.
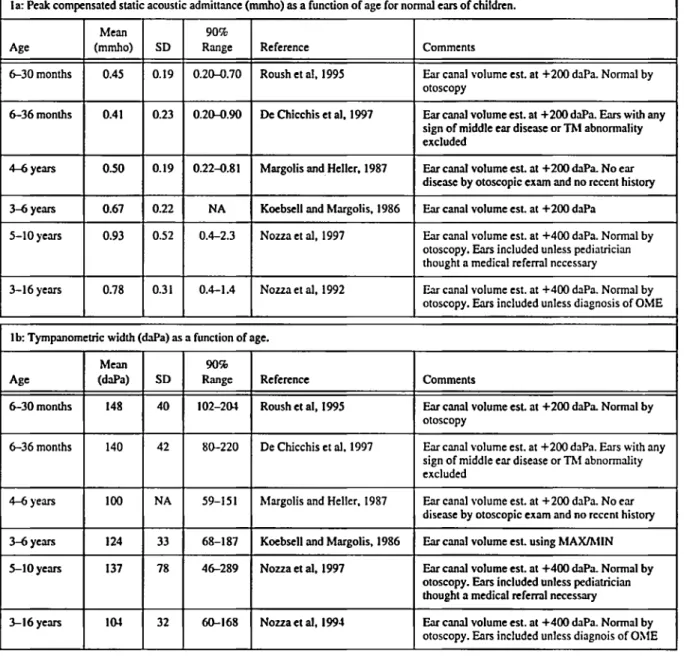
In recent years, there has been research to ex- amine the properties of acoustic immittance mea- sures in the ears of infants and young children. Several investigators have reported on normal values for peak admittance (the immittance mea- sure most commonly found on commercial instru- ments) and for tympanometric width for infants at very young ages. The research is consistent in finding developmental change in peak admittance and in tympanometric width from early infancy (Roush et al, 1995; D e Chicchis et al, 1997). Clearly, tympanograms of normally developing young in- fants are lower in admittance and have greater tympanometric width than those of older infants and children. Table 1 displays data from studies that measured tympanograms on infants and chil- dren who were free of middle ear disorder or were considered to have normal middle ears, even exclud- ing abnormalities that were clinically insignificant (De Chicchis et al, 1997). The table illustrates the age effect for both peak compensated static acous- tic admittance and tympanometric width.
Distributions of values for peak admittance and for tympanometric width were determined in a study of admittance values in children with his- tory of chronic or recurrent M E E who were scheduled for myringotomy and tube surgery ( N o u a et al, 1992, 1994). Immittance testing was done immediately before surgery and the deter- mination of the presence or absence of M E E was made by the surgeon at the time of the myringot- omy. Values of tympanometric peak pressure (TPP) and peak admittance (Nozza et al, 1992, 1994) and tympanometric width (Nozza et al, 1994) were evaluated, alone and in combination, for their ability to separate ears with MEE from ears without MEE. Peak admittance and tympa- nometric width were much better at identifying
MEE than was TPP. Even in combinations, TPP added almost nothing to the ability of the other variables to identify ears with MEE.
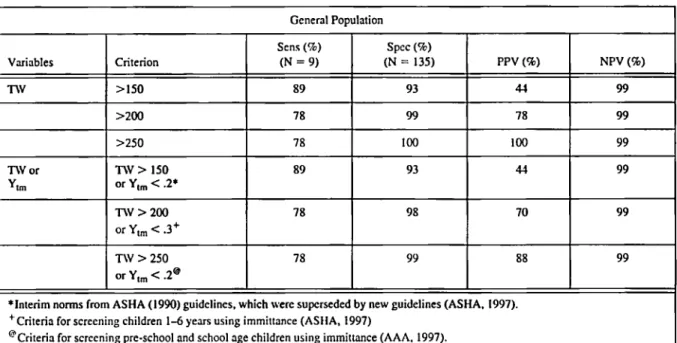
The data from the ears of children undergoing surgery also were compared to those of children drawn from a group unselected with respect to their ears o r ear history and who were without middle ear disorders by otoscopic exam at the time of testing. The sensitivity and specificity for identification of M E E in the children undergoing tube surgery were determined so that different criteria for identification of M E E could be exam- ined (Table 2). The performance of tympanome- try in identifying M E E in children, using a quanti- tative classification scheme, is quite good and is more objective than pattern classification schemes that have been used in the past.
BEHAVIORAL TESTING
A primary goal of diagnostic audiological as- sessment is to develop a complete and valid au- diogram. The behavioral audiogram is the corner- stone of the diagnostic evaluation and is critical to the development of a strategy for intervention. It is understood that it may take time to establish a valid audiogram for an infant or young child; re- peated testing is not unusual. For infants, when thresholds are obtained, they are often consid- ered to be biased by inability of the infant to maintain attention to the task. The term minimum resDonse levels (MRL) is often used for estimates of hearing sensitivity in infants because they are not considered to be thresholds in the same sense as those determined for older, more cooperative individuals. However, in spite of the develop- ments in ABR and O A E testing, behavioral test- ing still has an important role. The behavioral test is especially important with respect to the infant with a hearing aid for whom the ability t o process auditory information and then to use it in a mean- ingful way are the ultimate objectives.
6-36months
4-6 years
3-6 y e m
140 42 80-220
100 NA 59-151
124 33 68-187
Table 1. 'Qmpanometric variables as a function of age.
la: Peak compensated static acoustic admittance (mmho) as a function of age for normal ears of children.
ft
90%Range
0.20-0.70
0.20-0.90
Ane Reference Comments
Roush et al. 1995
6-30 months
6-36 months
Ear canal volume est. at +200 daPa. Normal by otoscopy
Ear canal volume est. at +200 daPa. Ears with any sign of middle ear disease or Thl abnormality excluded
De Chicchis et al. 1997
4-6 years
OSO
I
0-190.22-0.8 1 Margolis and Heller. 1987 Ear cmal volume est. at +200 Ma. No ear
disease by otoscopic exam and no recent history
Koebxll and hlargolis. 1986
N o u a et al, 1997
Ear canal volume est. at +200 daPa
Ear canal volume est. at +400 daPa. Normal by otoscopy. Ears included unless pediatrician thought a medical referral necessary 3-6 years
5-10 years
NA
0.4-2.3
3-16years
1
0.78I
0.31I
0.4-1.4I
Nouaetal, 1992 Ear cmal volume est. at +400 daPa. Normal by otoscopy. Ears included unless diagnosis of OMEl b Tympmometric width ( M a ) as a function of age.
Age
I
f:
1 1
E e6-30 months 102-201
Reference Comments
Ear canal volume est at +200 daPa. Normal by otoscopy
Roush et al, 1995
De Chicchis et al. 1337 Ear canal volume est. at +200 daPa. Ears with any sign of middle ear disease or Thl abnormality excluded
Ear canal volume est. at +200 daPa. No ear disease by otoscopic exam and no recent history
Ear cmal volume est. using hfAXlh1lN hfargolis and Heller. 1987
Koebxll and Margolis. 1986
N o u a et al, 1997 Ear canal volume est. at +400 &Pa. Normal by otoscopy. Em included unless pediahcian thought a medical referral necessary
N o u a et al, 1994 Ear canal volume est. at +400 daPa. Normal by otoscopy. &rs included unless diagnois of OXIE
Normal Thresholds
Over the years, visual reinforcement audiome- try
(VRA)
has been used t o obtain thresholds of infants from about five o r six months of age. With the use of earphones in experimental studies using VRA, ear-specific and frequency-specific thresholds have been measured in infants as young as six months of age.A
consistent finding has been that thresholds of infants with normal hearing improve with age and that there is greater developmental change in the low frequcncies than in the high fre- quencies ( N o u a and Wilson, 1984; Olsho et al, 1988). That is, infant hearing is more adult-like in44 TreiiciS in Ainplificdori
Table 2. Performance of selected tympanometric criteria in screening for middle ear effusion based on otoscopic diagnosis (Nozza et al. 1994).
General Population
*Interim norms from ASHA (1990) guidelines. which were superseded by new guidelines (ASHA. 1997).
'Criteria for screening children 1-6 y e m using immittance (ASHA, 1997)
@Criteria for screening pre-school and school age children using immittance (AAA. 1997).
Sens = Sensitivity; Spec = Specificity; PPV = Positive Predictive Value; NPV = Negative Predictive Value;
nV
= tympanometric width; ,Y = peak compenvted static acoustic admittance.olds as we think of them when testing an adult o r cooperative older child. MRLs are considered to be influenced by nonsensory factors such as atten- tion, motivation, response criteria and biases. Further, it is suggested that non-sensory factors must operate more on low-frequency signals than on high-frequency signals to explain the infant- adult differences across frequency.
Why is the issue of sensory versus nonsensory limits on threshold estimates important in the con- text of assessment of hearing-impaired infants? Before we can estimate degree of impairment, we must understand the capabilities of the infant with a normal auditory system. Currently, audiometric data obtained on an infant are plotted on the au- diogram that uses audiometric reference values based on adult hearing. If there are developmen- tal diiferences in hearing, we need to know the magnitude of such differences, as a function of frequency, so we can interpret more properly thresholds obtained on infants with hearing im- pairment.
That there is a different estimate of hearing when using A B R than when testing with a behav- ioral technique also is important to consider. A B R thresholds of six-month-old infants with normal hearing are much like those of adults, while the behavioral thresholds are elevated.
Does this mean one is correct and one is not cor- rect? Does this prove that infant hearing does not undergo developmental change?
Difference in Difference in
Stimulus threshold in quiet threshold in noise
500 Hz 15dB * 4 dB
References
Hesketh, 1983 (quiet; monaural); Nozza, 1987b (noise; binaural); Estimated based on work in progress (quiet and noise; Nozza).
plification, if an infant ABR reveals thresholds that are 15 dB better than behavioral thresholds, which thresholds do you use in your prescription for setting the gain of a hearing aid? Is it the one based on an identifiable waveform or the one that indicates the ability of the infant to respond in a meaningful way?
Comparisons of infant behavioral thresholds in quiet versus conditions of masking may shed some light on the degree to which infant threshold estimates can be influenced by nonsensory fac- tors. In a number of studies designed to mea- sure infant and adult behavioral thresholds, in quiet a n d o r in noise, infant-adult differences in masked thresholds have been much more consis- tent across stimulus conditions than have the infant-adult differences in thresholds in quiet (Ta- ble 3). Why would thresholds in quiet vary widely with the stimulus conditions (e.g., tone frequency o r speech-sound discrimination task) at the same time that thresholds for the same stimulus condi- tions in the presence of a masking noise vary little?
While some have proposed that the greater dif- ference in unmasked threshold between infants and adults in the low frequencies is due to non- sensory factors such as listed above, it may be rea- sonable to assume that the differences in thresh- olds between infants and adults may be due, at least to some degree, to true differences in sen-
sory processes. For example, in a study to investi- gate the minimum masking level (MML) for in- fants and adults for a tone of 1000
Hz,
thresholds were estimated in quiet and at increasing levels of4000 Hz
/bd
-
masking noise (Nozza, 1995). The group differ- ence between infants and adults was about 12 dB for unmasked thresholds. If infants were biased against responding to a 1000
Hz
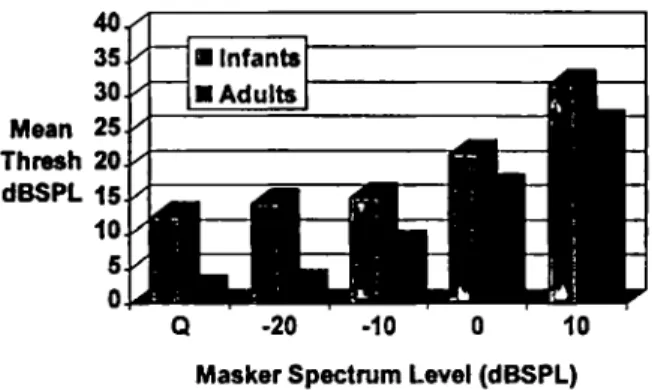
tone relative to the adults, the introduction of masking noise should not alter the infant-adult difference. How- ever, if infants truly have a poorer sensitivity than adults, then as the masking noise reaches and ex- ceeds the MML, the difference between infants and adults should diminish or disappear in much the same way as an increase in masking intensity level would shrink the difference in thresholds be- tween a listener with normal hearing and one with a hearing impairment. That is, under this assump- tion, we can view the infant as having a hearing loss relative to the adult. Figure 1 illustrates the change in thresholds of infants and adults as masking intensity increases. The difference be- tween infants and adults in threshold for the masker at +10 and at 0 d BSPL
per cycle is about5 dB compared to 12 dB in the unmasked condi- tion. If there were nonsensory factors accounting for the entire 12 dB difference between infants and adults for the unmasked thresholds, one would expect those same factors t o operate in the masking condition. Clearly, the infant-adult dif- ference shrinks considerabIy with the introduc- tion of the masker and the difference of about 5
d B with masking probably represents the most that nonsensory factors contribute.
Preliminary analysis of the results of a recently completed study in my laboratory indicates that infant-adult differences in unmasked thresholds
6 dB 7 dB Noua and Wilson. 198-4
17 dB 6 dB Noua et a], 1988
/bat vs /gal discrimination threshold
I
ImHz25 dB 6-7 dB Noua et d, 1991b (quiet)
NOW et al. 1930 (noise)
Nozza et PI. 1991a (noise)
12-13 dB N o u i and Wilson. 1984
Noua. 1995
Olsho ct a!. 1988
46 Trends in Amplification
Q -20 -10 0 10
Masker Spectrum Level (dBSPL)
Figure 1. Thresholds of infants and adults for a loo0 Hz
pure tone, presented through an insert earphone, in quiet (Q) and in different intensity levels of masking noise using an octave band masker centered at the test frequency. Data taken form Noua (1995).
get smaller with increasing frequency (500 t o 2000 Hz) and are consistent with data from other stud- ies (Werner, 1992). However, in the same study, the infant-adult differences in thresholds under conditions of masking are quite similar across the two frequencies. That is, the results are consistent with earlier studies (Table 3) that suggest wide variability in unmasked thresholds as a function of frequency and little variability when masking is employed.
Given the evidence that the inner ear is mature at birth and that infants have normal abilities with respect to frequency analysis (Werner, 1992), what sensory factor(s) might explain the differ- ences between infants and adults in unmasked thresholds as a function of frequency? One possi- ble factor is developmental change in transfer characteristics of the middle ear. There are changes in middle ear admittance in early life (Table 1) and data are emerging on developmental changes in middle ear reflectance (Keefe et al, 1993). Such changes are consistent with greater stiffness and poorer transmission of low frequencies. Another factor that must be considered is that of physio- logical noise. Greater self-generated noise in in- fants is likely to occur in the behavioral test set- ting and such noise is typically greater in the low frequencies than in the high frequencies. That would suggest that, at least in part, the greater infant-adult differences in unmasked thresholds in the lower frequencies could be due to greater low-pass internal noise in the infants. This would be a limit o n the sensory process that is not re- lated t o the nonsensory factors such as attention, motivation, etc. Of course, we know little about the role that thc central nervous system might
play in the limits on sensory processing in the de- veloping infant, even with respect to sensitivity and in spite of infant ABR thresholds, so this must be included in our thinking. For all measures of sensitivity, and especially when thinking about the similarity between ABR thresholds of infants and adults, we must keep in mind that the SPL at the tympanic membrane of an infant is greater, by substantial amounts at some frequencies, than at the tympanic membrane of an adult for the same output at the earphone (Feigin e t al, 1989). So even when threshold estimates for infants and adults are similar, the infant is working with greater intensity at the input t o the system, sug- gesting that there are differences in transmission andlor processing beginning at the tympanic membrane between the two age groups.
Suprathreshold Processing
How d o these different theories about the origin of infant-adult differences in behavioral thresh- olds affect our thinking with regard to supra- threshold processes such as speech perception? If differences in threshold are due to greater inter- nal noise in the infants, tasks performed at levels 30-50 dB above threshold would be unaffected. This has been tested in a study of the effects of intensity on infant speech perception (Nozza, 1987a). Infants revealed optimal performance in a speech-sound discrimination task at levels (about 50-60 dB HL) that are consistent with normal conversational speech. However, at around 40 dB HL, within 20 d B of typical speech, infant perfor- mance was reduced (Nozza, 1987a, 1994). Adults were able t o perform the task down t o around 10 o r 15 d B HL. There are several possible explana- tions for the breakdown in infant performance with only slight reduction in intensity of the stim- uli, including the greater complexity of the dis- crimination task relative to a detection task, acoustic filtering of the stimuli due t o a different audibility curve, and possibly others.
Adults
Difference between infants and adults
Mean (sd) 11.8 (5.1) 9.7 (3.7)
2 7 5 25.4
olds. That is, internal noise might explain a differ- ence in threshold responses but cannot explain infant-adult differences in speech processing at levels well above threshold. As with detection, testing with masking noise revealed that infant performance on a speech-sound discrimination task was much more similar to that of adults than when testing was done in quiet (Nozza et al,
The speech-sound discrimination task was mod- ified so that intensity thresholds could be deter- mined in much the same way as they are in a de- tection task. The purpose of developing a threshold of discrimination was t o make more efficient the process of getting a measure of speech sound dis- crimination for the infants. Using the standard one up, one down adaptive protocol, the 50% point on the psychometric function was estimated for discrimination of speech sounds in noise (Nozza et al, 1990,1991a) and in quiet (Table 4; N o u a et al, 1991b). The differences in thresholds between infants and adults were 25-28 dB in quiet, but were small (6-7 dB) when masking noise was included. Again, the evidence suggests that infants can perform much more like adults when masking noise is used to equalize the back- ground for infants and adults. However, in the ab- sence of an external masker, infant performance is far inferior to that of adults, suggesting that the greater part of the infant-adult difference is not due to nonsensory o r task-related variables, but to some limitation in the sensory process.
When considering amplification for infants, we worry about over-amplification; and this is an ap- propriate concern. However, data suggest that in- fants with normal hearing cannot perform simple auditory tasks unless stimuli are at intensities above those at which adults can perform the same tasks. Does this mean the infant with hearing im- pairment has need for greater sensation level
1990).
Table 4. Thresholds (dB
SPL)
for discrimination of two consonant-vowel syllable pairs, h a / vs Ida/ andh a / vs /gal for infants and adults (Nozza, 1991b).
I
InfantsI
Mcan(sd)I
39.3 ( 6 5 )I
35.1 (5.6)I
also? We don’t know, but this is something we must consider. Determining gain based on pre- scriptive procedures that assume infants have the same auditory requirements as adults may be less than optimal. Research that demonstrates how in- fants really d o perform important speech percep- tion tasks must be incorporated into our thinking about and management of hearing impairment in infants.
Methodological Improvements
Of course, in the laboratory study of auditory behavior, we can track variables that might affect infant performance o r that might affect the way we estimate infant performance. We study the in- fant’s behavior and the methods we use in a con- trolled setting so that we can better understand how t o improve our clinical methods. For exam- ple, one of the features of the laboratory version of VRA that has not been incorporated to any great degree in the clinic is the computer control of specific aspects of the protocol. In behavioral testing, experimenter bias or error can influence outcome. With the computer, some decisions can be removed from the experimenter’s control, such as duration of the stimulus presentation or re- sponse interval, information about whether a trial contains a signal or is a control trial, the intensity level of a given signal in the adaptive protocol, and others. This kind of computer control pre- vents the experimenter from extending o r reduc- ing the duration of a signal based on knowledge of the stimulus intensity (and the assumptions about whether the infant cAn Kear it), o r changing the time following a signal during which the rein- forcer will be available. With the computer, ex- perimenter involvement is limited. We know in clinical behavioral testing with any age group that these things can and d o come into play and can bias our estimate of hearing.
48 Trends in Atnplificatioti
ing a hearing test is not told when to listen for the signal. If a criterion head turn occurs, the experi- menter presses a response button that is inter- faced with the computer. If the trial is a stimulus trial and if the response button is pressed during the response interval, the computer scores a hit, activates the visual reinforcer and steps the atten- uator according to the tracking algorithm. How- ever, if the button is pressed and it is NOT a stim- ulus trial (i.e., it is a control o r blank trial), it is recorded as a false positive and no reinforcement is provided. Also, if it is a stimulus trial but the button is pressed outside the response interval, no reinforcement is given. The inclusion of com- puter-selected control trials helps to keep the ex- perimenter objective in making decisions about starting trials and in judging responses.
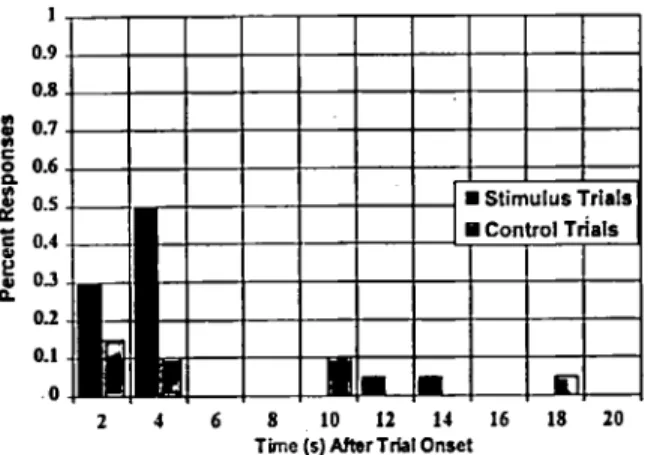
In one experiment ( N o u a , 1987a), the time in- terval from the onset of each trial to the time of the first head-turn response, for both stimulus and control trials, was recorded to chart the infant’s tendency to respond as a function of stimulus con- dition. The data were collected to permit analysis of the relationship between responses to trials in which the stimulus was present versus when it was not present as a function of the time following trial onset. In the example from one typical sub- ject (Figure 2), it is evident that the infant made a high percentage of responses in the first four sec- onds following the onset of stimulus trials. How- ever, notice that there is also a cluster of re- sponses that were made within the first four seconds following initiation of control trials. Con-
1
0.9
oa
$
0.7f 0.6 8 0.5
5
0.40 3
0.2
0. I . O 0
2 4 6 8 10 12 14 16 18 20
Tima (5) After Trbl Onset
Figure 2. Percent of head-turn responses as a function of time following onset of the trial for an infant subject
in a speech-sound discrimination task (from Nozza,
1987a). The response latencies represent the time from trial onset to the first head-turn response following the start of the trial.
trol trials, in theory, provide no information re- garding the stimulus, so why would the infant re- spond so often within four seconds of the start of a control trial? O n e thing we can derive from data like these is that the infant is predisposed to re- spond at certain times during the session, inde- pendent of whether the stimulus is present o r not. This can happen easily if the experimenter is starting trials with a constant inter-trial interval and the infant has developed a timing response. This can happen also if the experimenter in the room with the infant has certain behaviors that occur at the time he or she is initiating a trial, sig- naling t o the infant that the probability of seeing the toy reinforcer is greater than at other times. Things such as cessation of movement, introduc- tion of a new distracting toy, or making eye con- tact with the infant just as a trial is initiated could inform the infant. Data on the frequency and tim- ing of false responses are very useful for estimat- ing the reliability of an infant’s performance. An infant who responds only when the stimulus is present and never when it is absent would provide a more reliable estimate of auditory function than one who responds as often when the signal is ab- sent as when it is present. Such knowledge is use- ful in helping us understand the infant’s behavior in the stimulus-response paradigm and can help us to minimize biases that we, as the audiologists, might introduce into the testing.
CONCLUSIONS
what amplification strategies are optimal will ulti-
mately depend on behavioral research with infants rather than on d a t a from studies of adults. Finally,
d a t a on infant performance in behavioral test set-
tings, which is most easily derived from labora-
tory studies, should be used t o better understand a n d improve t h e methods we use in t h e clinic.
REFERENCES
American Academy of Audiology. (1997). Position Statement: Identification of hearing loss and middle- ear dysfunction in preschool and school-age chil- dren. Aiidiol Today 9(3):21-22.
American National Standards Institute. (1987). Auieri- cat1 Notional Stmilard Specifications for Itutriinietits to Measure Aiirnl Acoiistic Inipedarice arid Admit-
tatice (Aiiral Acoiistic Itwinittatice). ANSI S3.39, New
York: American National Standards Institute, Inc. American Speech-Language-Hearing Association. (1990).
Guidelines for scrccning for hearing impairment and middle ear disorders. Asha 32(Suppl. 2):17-24.
American Speech-Language-Hearing Association. (1997).
Guidelines for Audiologic Screening. Rockville MD: ASHA
Brooks DN. (1968). An objective method of detecting fluid in the middle ear. Intertiat Aiidiol7280-286.
Brooks DN. (1969). The use of the electro-acoustic im- pedance bridge in the assessment of middle ear function. Intertiat Aiidiol8563-569.
Cantekin EI, Bluestone CD, Fria TJ, Stool SE, Rccry QC, Sabo DL. (1979). Identification of otitis mcdia with effusion in children. Ann 0101 Rlitiol Larytigol
Suppl69,89(3):190-195.
De Chicchis AR, Todd NW, N o v a RJ. (1997). Age re- lated changes in acoustic irnmittance. Poster pre- sented at the 20th Anniial Midwinter Research Meet-
itig of The Association for Research iti
Otolnryngology, St. Petersburg Beach, FL, February
1-6.
de Jonge R. (1986). Normal tympanometrie gradient: a comparison of three methods. Aiidiol 25299-308.
Feigin JA, Kopun JG, Stelmachowin PG, Gorga MP.
(1989). Probe-tube microphone measures of ear-ca- nal sound pressure levels in infants and children. Ear
Hear 10:254-258.
Folsom RC, Wynn MK. (1986). Auditory brainstem re- sponses from human adults and infants: Restriction of frequency contribution by notched-noise mask- ing. J Acoiisr Soc Anier 80~1057-1064.
Gorga MP, Kaminski JR, Beauchaine KL, Jesteadt W, Neely ST. (1989). Auditory brainstcm responses from children three months to three years of age: Normal patterns of response 11. J Speech Hear Res
Gorga MP, Ncely ST. Ohlrich B, Hoover B, Redncr J,
and Peters J. (1997). From laboratory to clinic: A
large scale study of distortion product otoacoustie
32~281-288.
emissions in ears with normal hearing and ears with hearing loss. Enr Hear 18:440-455.
Hesketh LJ. (1983). Pure-tone thresholds and ear-canal pressure levels in infants, young children and adults. Unpublished thesis, University of Washington, Seattle. Jerger J. (1970). Clinical experience with impedance au-
diomctry. Arch Otolnryngol925311.
Karzon RG. (1991). Validity and reliability of tympano- metric measures for pediatric patients. J Speech Heor
Res 34:38&390.
Keefe DII, Bulen JC, Hoberg K, Bums EM. (1993).
Ear-canal impedance and reflection coefficient in human infants and adults. J Acoiut Soc Anier 93:2617- 2638.
Koebsell KA, Margolis RI I. (1986). Tympanometric gradient measured from normal preschool children.
Aiidiol25:149-157.
Margolis RH, Heller JW. (1987). Screening tympanom- etry: criteria for medical referral. Aiidiol26:197-208.
Nozza RJ. (1987a). Infant speech-sound discrimination testing: Effects of stimulus intensity and procedural model on measures of performance. J Acoiist Sac
Anier 81:1928-1939.
N o v a RJ. (1987b). The binaural masking level differ- ence in infants and adults: Developmental change in binaural hearing. Itif Behav Dev 10:105-110.
N o u a RJ. (1994). The effects of mild hearing loss on in- fant auditory function. Itif-Tod Interveti 4285-298.
N o u a RJ. (1995). Estimating the contribution of non-
sensory factors to infant-adult differences in behav- ioral thresholds. Hear Res 91:72-78.
N o v a RJ, Wilson WR. (1984). Masked and unmasked thresholds of infants and adults: development of au- ditory frequency selectivity and sensitivity. J Speech
Henr Res 27613-622.
N o u a RJ, Wagner EF, Crandell MA. (1988). Binaural release from masking for a speech sound in infants, preschool children and adults. J Speech Ifear Res
N o v a RJ, Rossman RNF, Bond LC, Miller SL. (1990).
Infant speech-sound discrimination in noise. J Acoilst
Soc Anier 82339-350.
N o v a RJ, Miller SL, Rossman RNF, Bond LC. (1991a).
Reliability and validity of infant speech-sound dis- crimination-in-noise thresholds. J Speech Ifear Res
34:643-650.
Noua, RJ, Rossman, RNF, Bond LC. (1991b). Infant- adult differenccs in unmasked thresholds for the dis- crimination of CV syllable pairs. Aiidiol30102-112.
Noua, KJ, Bluestone CD, Kardatzke D, Bachman RN.
(1992). Towards the validation of aural acoustic im- mittance measures for diagnosis of middle ear effu- sion in children. Ear Hear 13:442453.
N o v a RJ, Bluestone CD, Kardatzke D, Bachman RN.
(1991). Identification of middle ear effusion by aural acoustic immittance and otoscopy. Ear Henr 15:310- 323.
N o u a RJ, Sabo DL. Mandel E. (1997). A role for oto-
acoustic emissions in screening for hearing impair-
50 Trends it1 Aniplificntion
ment and middle car disorders in school-age chil- dren. Ear Hear 18227-239.
Olsho LW, Koch EG, Carter EA, Halpin CF, Spetner NB. (1988). Pure-tone sensitivity of human infants. J
Acoiut SOC Amer 841216-1324.
Prieve BA, Fitzgerald TS, Schulte LE. (1997). Basic characteristics of click-evoked otoacoustic emissions in infants and children. J Acoiist Soc Anier 102(5:1): 2860-2870.
Prieve BA, Fitzgerald TS, Schulte LE, Kemp DT.
(1997). Basic characteristics of distortion product otoacoustic emissions in infants and children. J Acoiut
Soc bier 102(5:1):2871-2879.
Roush J, Drake A, Sexton JE. (1992). Identification of
middle ear dysfunction in young children: A com- parison of tympanometric screening procedures. Ear
Hear 13:63-69.
Roush J, Bryant K, Mundy M, Zeisel S, Roberts J.
(1995). Developmental changes in static acoustic ad- mittance and tympanometric width in infants and toddlers. J A m Acad Airdiol6334-338.
Silman S, Silverman CA, Arick DS. (1992). Acoustic- immittance screening for detection of middle-ear ef- fusion in children. I Amer Acad Airdiol3:262-268.
Stapells DR, Gravel JS, Martin BA. (1995). Thresholds for auditory brain stem responses to tones in notched noise from infants and young children with normal hearing or sensorineural hearing loss. Ear Hear
Stapells DR, Oates P. (1997). Estimation of the pure- tone audiogram by the auditory brainstem response: A review. Aiidiol Neurootol2:257-280.
Werner LO. (1992). Interpreting developmental psy- choacoustics. In: Werner LA, Rubel, EW. (eds.) De-
velopttietital Psycfioacoiutics, Washington: Ameri-