The influence of off-screen
landmarks on user orientation
Amichai Korda
CERTIFICATION OF APPROVAL
The influence of off-screen landmarks
on user orientation
by
[Amichai Korda]
Dr. Rui Li
Dr. Francisco Ramos
Dr. Marco Painho
Date
Date
DECLARATION
This document describes work undertaken as part of a program of study at the University on Muenster. All view and opinion expressed therein remain the sole responsibility of the author, and do not necessary those of the university.
I declare that this thesis entitled “The influence of off-screen landmarks on
user orientation” is the result of my own research except as cited in the
references. The thesis has not been accepted for any degree and is not concurrently submitted in candidature of any other degree.
Signature:
Name: Amichai Korda
Place: Münster, Germany
I
ACKNOWLEDGEMENTS
Many thanks to Maurin Radtkeor for writing the Java map interface, Sitcom lab for providing me with smartphones.
My appreciation to all participates for volunteering to take part in this experiment with the knowledge that they will be spending time in cold weather. Thanks to Sunny Levy, my wonderful sister, Fiona Thiessen and
Tanja Zettler for helping with grammar, structure and mental support.
Much obliged to my adviser Rui Li. His guidance combined with helpful information expanded my knowledge and had helped shape this master
II
TABLE OF CONTENTS
PAGE
Acknowledgements ... I
List of Tables ... II
List of Figures ... II
Abstract ... IX
CHAPTER
1. Introduction ... 1
2. Literature Review Orientation 2.1.1 Cognitive mapping ... 4
2.1.2 Landmarks ... 5
2.1.3Individual difference ... 6
Maps 2.2.1 Digital maps ... 8
2.2.2 Small screen maps ... 8
Off-screen landmarks 2.3.1 Approach ... 10
2.3.2 Related work ... 11
Research question ... 13
3. Method 3.1 Participants ... 14
3.2 Materials ... 15
3.3 Environment ... 18
3.4 Procedure ... 20
III
4. Results ... 25
5. Discussion ... 40
6. Conclusion and outlook ... 45
References ... 46
Appendices A. Participants Legal Forma ... 50
B. Santa Barbara Sense Of Scale ... 52
IV
LIST OF TABLES
TABLE PAGE
1. Icon used in map interface ... 17
2. Distinguishing the of off-screen landmarks ... 17
3. point and distance task 1 ... 27
4. point and distance task 2 ... 28
5. point and distance task 3 ... 29
6. Score and icons listed comparison of SOD ... 36
7. Score and icons listed comparison Gender ... 37
LIST OF FIGURES FIGURE PAGE 1. Halo interface vs., Wedge interface ... 12
2. Map display ... 16
3. Direction and Distance sketch box ... 22
4. Calculation of distance and angle accuracy ... 23
5. Distance estimation based on gender for task 2. ... 28
V
7. Pointing Distance estimation based on map interface ... 31
8. Distance estimation based on map interface ... 32
9. Angle accuracy based on based ... 34
10. Angle accuracy based on map interface ... 34
11. Distance accuracy based on gender ... 35
12. male zooming and panning based on map interface ... 39
VI ABSTRACT
Maps displayed on hand held devices, such as smartphones; provide limited visibility due to their small screen display. In order to overcome display limitations, researchers have developed new techniques that point users to objects and landmarks located off-screen, which is known as an “off-screen
interface”. Since this is a new type of map interface, there is little information regarding the effect it has on the user’s perception of the environment and
spatial orientation abilities.
This thesis investigates the relationship of a map display to the user’s orientation in the environment. A field experiment was conducted in an urban environment, where twenty-four participants were individually guided along an unfamiliar route. All participants were provided with a map displayed on a smartphone, whereas only half were additionally equipped with the off-screen
interface. Tasks involving user’s orientation knowledge were preformed along the route and at the end point. In addition, user’s interaction with the map was monitored. Results were compared between the two interface groups and individual difference, such as gender and sense of direction abilities, were taken into account.
The results do not indicate a significant difference between the two interfaces in relocation to orientation abilities. However, considerable differences among the interface groups were found with relation to gender and senses of direction. Moreover, a significant difference was found between groups in relation to user-map interaction.
Based on the results of this study, a relation between the off-screen map
1
CHAPTER I
INTRODUCTION
Maps are an important tool for human orientation in the environment. They provide a representation of an environment by showing different features and their spatial relations. This is significant since this information is usually not available from in situ perception (Montello et al., 2004). Together with personal presence in the environment, maps helps develop a mental representation known as a “cognitive map” (Tversky, 1993).
The term cognitive map was introduced by Edward Tolman in 1949 to describe the internal representations of space. In 1975, Siegel and White distinguished three types of knowledge involved in forming a cognitive map (Siegel & White, 1975): Landmark knowledge – memory of distinctive objects and/or views within the environment that serve as points of reference. As landmarks can be viewed and remembered, they are used in cognitive representations as anchor points (Winter et al., 2008). Route knowledge –
memory of procedural linking of landmarks, including order, inter-landmark distances, and required actions. Survey knowledge – memory in which landmark and route knowledge is integrated into a configurationally map-like whole.
It is important to understand the concept of the cognitive map when providing spatial information. The map is a source of communication between the information provider and the information receiver. Therefore, the cartographer or service provider must understand how to present information. Maps vary depending on their requirements and the users demand, but always share a common role: providing spatial information.
2
(Nissen et al., 2003). For many people, paper maps have been replaced with digital maps of which some are integrated into hardware devices such as
smartphones, Tablets PC’s, Notebooks etc.. Among American adults,
smartphone ownership has risen from 35% in 2011 to 46% in 2012( Zickuhr, 11/5/2012). As of 2013 the smartphones’ screen side ranged from 2 - 6.5 inches (Bonnington, 11/4/13). There is no common definition of size for a
small screen. In this paper “small screen map” is defined as a map projected
on a hand held device such as a smartphone. The change from large paper maps to a smaller digital screen has changed users’ visualization of the map. The display changes the limits of map visualization and requires users to zoom and pan (map scrolling) in order to get a prospection on the environment. This means that in order to view the greater environment, the user must zoom out to a small scale. Once viewing the map on a smaller scale, important information is lost, which requires the user to move back to the large scale (zoom in). The result is that the user comprehends the map in parts and never as an understandable whole (Skundergard et al., 2012).
Several studies have reported negative effects on users’ orientation abilities
when using a small screen map (Münzer et al., 2006; Willis et al., 2009; Ishikawa, 2008). A study of map visualization on different scales in which maps were only presented in parts has reported hindered performance with respect to accuracy of orientation performance (Dillemuth, 2009).
The understanding of the visualization limitation when projecting a map on a small screen has encouraged developers to design a map interface that will overcome size limitations (Bederson et al., 1994). This paper presents an interface that addresses visualization limitation using “off-screen landmarks”. The off-screen interface presents icons of landmarks on the side of the screen providing direction and distance to the location. This interface was designed based on the approach that landmarks presented on a map are
3
orientation in the environment. The interface provides a possibility to view a map on a large scale (zoomed in) and at the same time, have a perception of the surrounding landmarks. Several off-screen interfaces have shown positive
results in relation to way finding and the users’ perception of further
landmarks (Gustafson, 2008; Baudisch & Rosenholtz, 2003). The developers of these interfaces provide information regarding their effect when used for navigation and user interaction with the map, but have not studied their
effects on user’s orientation in the environment. Furthermore, there is a lack
of information regarding the interface effects on individual differences such as gender and personal sense of direction.
In order to examine the effect of the off-screen interface on the user’s orientation abilities, a field experiment was conducted. The experiment
consisted of tasks that tested users’ orientation in the environment, mental
representation of an area, and interaction with the map. Two map interfaces were developed for this experiment and smartphones were used to project them. The first map interface consisted of a map with icons presenting landmarks in the environment. The second interface consisted of the same display, but included an additional off-screen interface. The results of this study provide information regarding the off-screen interface indolence on the
4
CHAPTER II
LITERATURE REVIEW
Orientation
Cognitive map
Over a century has passed since the human sense of direction was described
by Darwin in scientific literature (Hegarty et al., 2006). Having a sense of direction has been associated with the ability to discriminate fine-grained environmental cues, strategies for learning a route, and memories of locations, which together create a cognitive map (Cornell et al., 2003).
The term Cognitive map was introduced by Edward Tolman in 1949 to describe the internal representations of space. Tolman (1949) presented a theory of cognition which stated that our behavior is not determined only by a stimulus response model, popular at thetime, but that the spatial knowledge we receive is regulated and integrated into our knowledge base. Sixty-five years later, the term is found in disciplines ranging from psychology and geography to computer science.
In 1975, Siegel and White distinguished three types of knowledge involved in forming a cognitive map (Siegel & White, 1975):
● Landmark knowledge – memory of distinctive objects and/or views within the environment that serve as points of reference. Since landmarks can be viewed and remembered, they are used in cognitive representations of space as anchor points (Winter et al., 2008)
● Route knowledge – memory of procedural linking of landmarks, including order, inter-landmark distances, and required actions.
5
strong survey knowledge of an area are able to accurately estimate straight-line directions and distances to unseen locations, and plan routes between places which have not been visited before.
A cognitive map differs from a "true" map of the environment. As maps,
cognitive maps reflect spatial relations among elements in the environment. As mental constructs, cognitive maps are presumed to be like real maps, which according to the classical view of mental imagery, are internalized perceptions (Tversky, 1993).
In relation to Navigation, studies by Cornell and colleagues (2003) on human and animal navigation have identified methods of Navigation that rely on landmark and route recognition and use of survey knowledge. It appears that humans are capable of a variety of methods of wayfinding, depending on information provided (Cornell & Heth, 2000). The individual’s sense of direction could be important to all of these methods. For example, a person with a good sense of direction may be better able to look for areas likely to contain landmarks and can use that information to direct actions at intersections on routes. People with a good sense of direction should be able to accurately orient their mental representation of a configuration of landmarks by the information that is provided (Allen, 1999).
Landmarks
Lynch (1960) defines landmarks as external points of reference: points that are not part of a route or of the travel network itself.
6
hierarchical system of landmarks. The use of landmarks is subject to the
users’ understanding and the person to whom information is being provided.
Therefore, a hierarchy is based on the route, place description, and the person that information is provided to (Plumert etal., 1995; Nothegger, 2004).
Distinguishing landmarks is associated with contents of the users’ choice; an
example would be deciding to use a statue or a street intersection as a landmark.
Individual differences
There has been a long tradition of research on the measurement and classification of individual differences in spatial abilities (Lawton, 1994). These differences are correlated to gender, age, environment, culture etc. (Kato & Takeuchi, 2003; Chen., at el, 2009). When addressing individual differences, two distinct concepts are often confused: spatial ability and
spatial orientation (Coluccia, 2004). Spatial ability generally refers to the ability to generate, represent, transform, and recall spatial information (Linn & Petersen, 1985). Spatial orientation is the ability to combine all skills used for locating oneself with respect to a point of reference or an absolute system of coordinates (Woollett & Maguire, 2010).
Gender differences in spatial abilities are considered among the largest gender differences in all cognitive abilities (Lawton & Morrin, 1999). In traditional tests of basic spatial abilities, males perform better than females; however, the size of this effect changes depending on the type of the spatial ability measured (Coluccia & Louse, 2004). Concerning spatial orientation, mixed results have been obtained (Lawton & Morrin, 1999).
7
(see Hegarty et al., 2006) and psychometric tests (mental rotation of shapes and solving mazes.), and (2) large scale tasks representing the
“environment”. Environmental spatial tasks include learning the layout of new environments, such as buildings or cities, navigation in known environments, and giving and interpreting verbal navigation directions. A small correlation of spatial abilities was found between the two scales, meaning that abilities on one scale do not reflect on abilities of the other. Given that, large individual abilities regarding the environmental scale were found, presenting strong differences in spatial abilities depending on the individual
The free dictionary describes the sense of direction (SOD) as “An awareness
of your orientation in space“. Since this is a personal perception it is i subject to individual differences (thefreedictionary, 2014). Personal mental representations of the environment are subjects of interpretation of the survey knowledge and working memory (Hund & Nazarczuk, 2009). Survey knowledge is an individual understanding and personal perception of location and objects. Sholl (1996) described this as the knowledge development from self-to-object relations to object-to-object relations. People with a good and poor SOD may differ in the processing of information and in working memory which in turn may affect the nature of acquired mental representations. Egocentric frames of reference specify locations with respect to the body (e.g., front-back-left-right), and allocentric frames of reference define spatial relations with respect to external objects or cardinal directions (Klatzky, 1998). It is important to understand that representations are directly related to
8
Maps
Digital maps
Maps are an essential tool for self-orientation and navigation in an environment (Skundergard, 2012). A map provides a representation of an environment that may be larger than the area of the user’s immediate perception or of a farther location. By showing the features of an environment and their spatial relationships with one another, a map can assist a user in developing a cognitive map (Tversky, 1993).
With increased user demands and technology improvements, maps have constantly been evolving. Today, maps have been integrated into hand-held mobile devices, such as smartphones, and are easily accessible to the average user. Smartphones are commonly used and ownership has been on an increasing rise. In fact, among American adults, smartphone ownership has risen from 35% in 2011 to 46% in 2012.(Zickuhr, 11/5/2012). This means that the overall population of U.S. adults has constant access to digital maps.
Small screen maps
Technology has made it possible to use maps on mobile devices. Unfortunately, the small screen of mobile devices has limited visibility as compared to the use of a desktop screen or paper maps (Burigat & Chittaro, 2011; Münzer et al., 2006). When information is displayed on a large scale, users obtain an overview but lose details. By zooming-in, users may obtain needed details, but lose direct visual access to content that falls outside the view area. If essential objects of interest fall in the off-screen region, users would have to pan and zoom in order to view them.
9
using digital maps traveled more slowly, made larger direction errors and drew sketch maps with poorer topological accuracy. Ishikawa (2008) claims
that the map size can be a major obstacle and raises the question: “How
much surrounding area needs to be covered by a map so that it works as a map or fulfills its advantage of conveying the layout information about the
space?”
Dillemuth (2005) studied the effect of visualization of a map in different scales. In this experiment, participants answered distance and direction questions in one of four viewable-extent conditions, ranging from 10% to 100% of the map viewable at a time. Map-use results showed that small viewable extents hindered performance with respect to accuracy and response time but had no effect on participants’ confidence in their performance on the navigation tasks. Tests of spatial knowledge acquisition showed differences across conditions for recall tasks, but a sketch-map analysis revealed no differences based on viewable extent.
An experiment conducted by Willis et al. (2009) compared two groups of participants: those who had learned the environment from a paper map and those who had learned it using a mobile map. The results show that there are differences in the spatial knowledge acquired, and that mobile map users performed worse than map users on route distance estimation.
10
into a single consistent spatial mental model and require users to spend additional time reorienting when switching between views (Willis, 2009). Different contextual cue techniques (off-screen landmarks) are being tested in order to overcome visualization limitation on small screens (Burigat & Chittaro, 2011).
Off-screen landmarks
Map visualization has changed with the decrease of display size. Evidence of
a negative effect on one’s orientation ability’s has encouraged map
developers and cartographers to overcome some of the problems caused by the visualization reduction (Cox, 1998; Burigat & Chittaro 2011; Baudisch & Rosenholtz, 2003). This has called for a new map interface design. One approach are off-screen landmarks that will be presented in this chapter.
Approach
11
Related work
In the following section two off-screen interfaces are presented with a short overview.
1. Halo (Baudisch & Rosenholtz, 2003)
This interface addresses the visualization problem by overlaying the display window with translucent arcs indicating the location of a landmark. Each arc is part of a circular ring that surrounds one of the off-screen locations (see Figure 1). Although the arc is only a small fragment of the ring, its curvature contains all the information required for locating the ring center, which is where the off-screen object is located. When comparing to the arrow interface (arrows pointing to direction of landmark), the Halo users completed tasks 16-33% faster, while there were no significant differences in error of directions. In this report, all tasks were related to navigation, wayfinding and user-interface interaction.
2. Wedge (Gustafson et al., 2008)
12
Figure 1: Halo interface vs, Wedge interface.
13
Research question
Visualization limitations due to small screen maps have been the subject of much research. The off-screen research is aimed towards the users’ interaction with the map and addresses navigation and wayfinding topics. However, the influences on the user’s spatial orientation and development of a cognitive map has not been properly addressed.
To this end, I have embarked on this research project. The main questions I asked were:
1. Are there differences in spatial orientation (such as estimation of distance and direction) when off-screen landmarks are displayed?
2. Can using off-screen landmarks improve the development of a cognitive map?
CHAPTER III
METHOD
In order to investigate the effectiveness of spatial orientation in the use of off-screen interfaces, an experiment was designed that tested the map interface in a real-world environment. The present study aims to investigate differences between a regular digital map and a map equipped with an off-screen interface. Several tasks were included in the experiment to identify differences in self-orientation in a real environment, interaction with the map, and representation of a cognitive map.
Participants
Twenty-four university students (11 men and 13 women) participated in this experiment ages 19-33 (m=24.9). All participates were undergrad to PhD’s students, from different departments at the University of Muenster, Germany (WWU).
15
Materials
Bicycle
Using a bicycle it is possible to be exposed to a large area in short amount of time. This provides an opportunity to use real landmarks that are spread out among a neighborhood and have participants match landmarks from map to the real landmarks in the environment. Muenster is a bike friendly city and has been called the bicycle city of Germany (Muenster, 2013). This provides an opportunity to operate with little distractions and, within a safe environment. Participants used their personal bikes and if stated that they did
not own one, a “Holland bike” which is easy to operate was provided.
Digital maps- smart phone
16
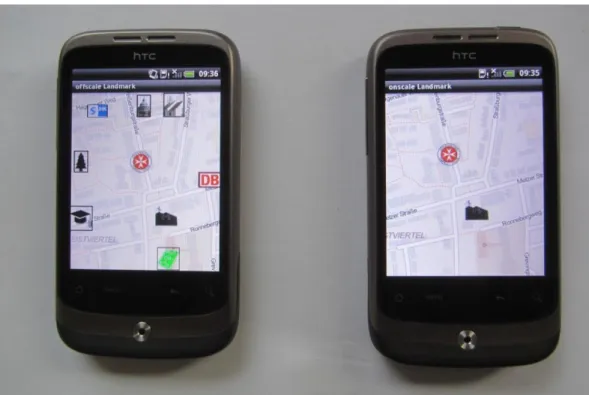
Figure 2- Map display. The Off-screen interface can be seen on the left. The on-screen interface can be seen on the right.
Software
17 Landmark icons
All icons were designed to fit the screen without interfering with the map display. Weight was given to off-screen landmarks icons depending on the distance from the center of the screen to insure that closer landmarks did not overlapped further ones. Icons used in the map interface were either photos taken from street level, commercial logos, or universally understood icons (see Table 1).
Table 1- Icon used in map interface
Picture Logo of company Universal icon
In order to distinguish between on-screen and screen landmarks, the off-screen landmarks were presented on the side of the off-screen with a black frame (see Table 2). This prevents the user from misinterpreting the true location of the landmarks.
Table 2- Distinguishing the off-screen landmarks
On-screen LM icon Off-screen LM icon
18 Zoom levels
An option of three zoom levels was provided: (1) A small scale level, which allowed an observation of the street names, (2) a middle scale zoom providing a view of the streets and nearby landmarks, and (3) a large scale zoom which provided an opportunity to view landmarks that where further away, e.g. the air-port.
Phone log
An operation log was added to the software. It recorded the users’ zooming and panning during the experiment providing a useful indicator of the actions made. This log was not visible to the users.
Environment
Due to the fact that the aim was to investigate the cognitive map, it was important that the environment would be unfamiliar to the subjects so that no previous knowledge would interfere with the results. Only participants who indicated on a screening questionnaire that they were not familiar with the study location were selected. The area is free of high-rise buildings and the trees were leafless since the experiment was conducted during the month of December. These conditions enabled us to conduct an experiment with a good visibility.
Participants were students, therefore a non-student neighborhood was chosen. It should be noted that a distance consideration was taken since subjects were commuting with bikes. The chosen location needed to be within bike ride distance from the city center. Some familiar streets bordered the study area.
19
not all landmarks could be observed. Routes did not start and end at the same point.
Route 1 Route 2
Route 3 Route 4
Map 1- Routes used in experiment. Blue stars indicate starting point, Green
20
Procedure
Participants were met at a set location which was not part of the study area. After explanation of the experimental procedures, time was given to become familiar with the map interface. Once ready, the experimenter and the participant went to the starting point together where participants located themselves on the map. Traveling by bicycle, a stop was made every few hundred meters in order to let participants look at their map and self-orientate.
In this experiment, three orientation tasks were performed at different locations depending on the route (see map 1). The order of the tasks was the same for all four routes. At the end of the route, sketch map and Icon map tasks were completed. Following the experiment, the Santa Barbra Sense Of Direction Scale (SBSOD) was sent via email and completed through a Google form.
It should be noted that between stops, the smartphones containing the maps were kept in the participants’ pockets in order to allow participants to observe their surroundings and concentrate on riding their bikes.
21
Tasks
Direction and distance
Pointing accuracy is often used as a measure of environmental orientation (Montello & pick, 1993). The requirements of the task were pointing to the direction followed by direction estimation of a landmarks.
Task 1- Direction and distance to starting point
Task 2- Direction and distance to four listed landmarks depending on route used.
Task 3- Direction and distance of all recalled landmarks
Recording of the pointing and distance estimates was done by using a sketch box (see figure 3). Participants were asked to place themselves in the center of the table and draw a line in the direction of the landmarks followed by estimation of distance. For all tasks participants were facing north. Pointing answers were converted to error scores by measuring the difference between
the participant’s answer and the actual direction of the landmark. Maximum
22 +
Figure 3- Direction and Distance sketch box
Map icon
As a measure of survey knowledge, participants were asked to place landmark icons from a provided list onto a map. A similar method was used by Coluccia., et al, (2007) researching the relationship between map drawing and spatial orientation abilities. The map presented in this task was similar to the one projected on the smartphone map, but did not include the icons. The map is shown in two different scales, large and small (seen in appendix C). The large scale represents the direct study area where streets were visible and the route used was easy to distinguish. The smaller scale allowed users to place further landmarks (e.g. Airport and power plant).
23
Sketch map
Inspired by Friedman and Kohler (2003), a task of map sketching was used. Participants were asked to draw the route they followed on a blank A4 sheet of paper and add landmarks as reference points.
The Gardony Map Drawing Analyzer (GMDA; Gardony et al., 2013) is a software used for analyzing hand-drawn sketch maps of environments. This software compares the locations of landmarks on the sketch map to the Cartesian coordinates of the target environment. Turns along the route were marked and compared by distance and angel to the original turns on the route. This provided an error measure of angle and distance.(see figure 4)
24
Santa Barbara sense of direction scale
This questioner built by Hegarty,. et al, (2002) rates participants’ personal feelings about their spatial abilities (see appendix B). It has been found to be a useful measure of participants’ sense of direction- (SOD) abilities (Ishikawa & Montello, 2006). The self-report scale is highly correlated with tests of spatial knowledge that involve orienting oneself within the environment. Furthermore, the SBSOD is slightly higher correlated with measures of spatial knowledge acquired from direct experience in the environment than with measures of knowledge acquired strictly from maps (Hegarty et al., 2006).
CHAPTER III RESULTS
Data analysis was performed using SPSS 22.0. To test for differences among interfaces and subgroups, a significance criterion of =.10 was defined Analysis was completed using exploratory data analysis methods (boxplot) among with statistical models (independent samples t-test).
Sense of direction
The participants’ sense of direction was assessed using the “Santa Barbra Sense of Direction Scale” (SBSOD) which comprises 15 items on sense of direction (SOD). Based on the sample’s mean score of M=4.3, participants were dichotomized into participants with poor SOD (less than 4.3) and participants with good SOD (above 4.3). An independent-samples t-test was
conducted to compare participants’ SOD results among the two interface groups. On screen participants’ SOD results (M=4.16, SD=1.17) showed no significant difference to the off screen results (M=4.25, SD=1.0); t (22) = .200,
26
Orientation measures
Task 1
The first task required participants to point to the direction of starting location followed by distance estimation.
Among the on/off screen groups, a t-test indicated no significant difference in pointing and direction estimation to the starting point. Looking at differences among SOD groups, there was a significant difference in the pointing error of the poor SOD participants. The poor SOD participants using the on screen interface (M=21, SD=7.41) made greater pointing errors compared the off screen users (M=5.85, SD=5.84); t (9) = 3.8, p = .004. These results suggest that the off screen map does have an effect on users with poor SOD. Specifically, results suggest that participants with poor SOD using the off screen landmark interface demonstrated more accurate direction estimations than participants with poor SOD who used the on screen interface. However, even though there was a significant difference in pointing among the poor SOD participants, no significant difference was found for distance estimation.
A marginally significant difference between good and poor SOD groups using
the on screen interface was found. The poor SOD participants’ pointing error
27
Table 3- point and distance task 1
Means of pointing and distance estimation errors and distance errors for males and females of both interface groups (standard deviations in parentheses)
On screen Off screen T-tests
M SD M SD t df p
Males Point error 10.83 (14.28) 12 (5.7) .17 9 .86 Distance error 130 (153.23) 206 (175.04) -.77 9 .46
Females Point error 15.83 (10.68 6.43 (10.69) .43 11 .14 Distance error 242.5 (203.75) 247.8 (236.18) -.04 11 .96
Task 2-
The second task required participants to point and estimate the direction of four landmarks listed by the experimenter.
No significant difference was found among the on/off screen groups; Pointing:
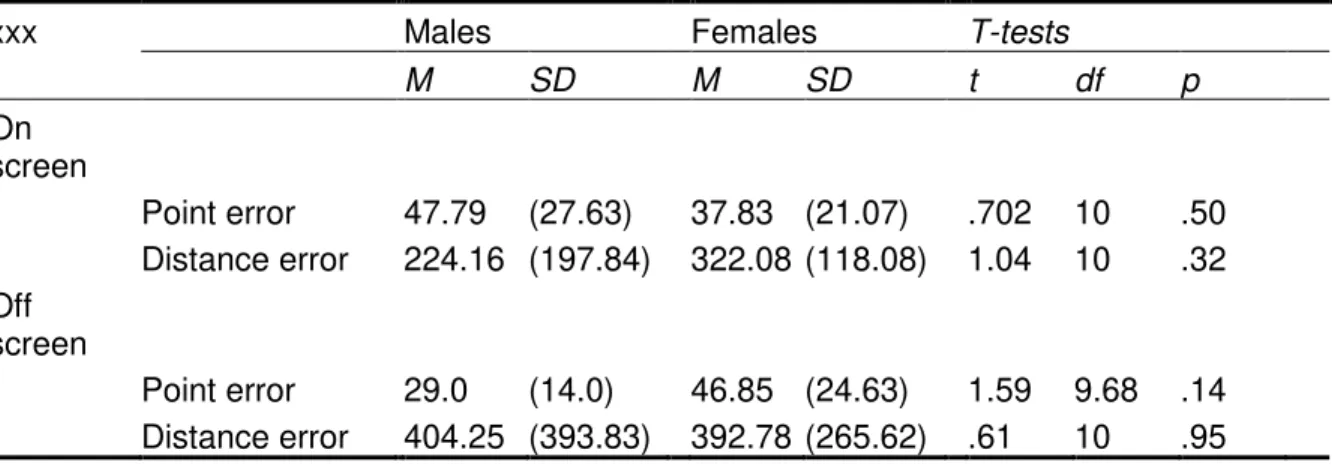
28 Table 4- point and distance task 2
Means of pointing errors and distance errors for males and females of both interface groups (standard deviations in parentheses)
xxx Males Females T-tests
M SD M SD t df p
On screen
Point error 47.79 (27.63) 37.83 (21.07) .702 10 .50 Distance error 224.16 (197.84) 322.08 (118.08) 1.04 10 .32 Off
screen
Point error 29.0 (14.0) 46.85 (24.63) 1.59 9.68 .14 Distance error 404.25 (393.83) 392.78 (265.62) .61 10 .95
29
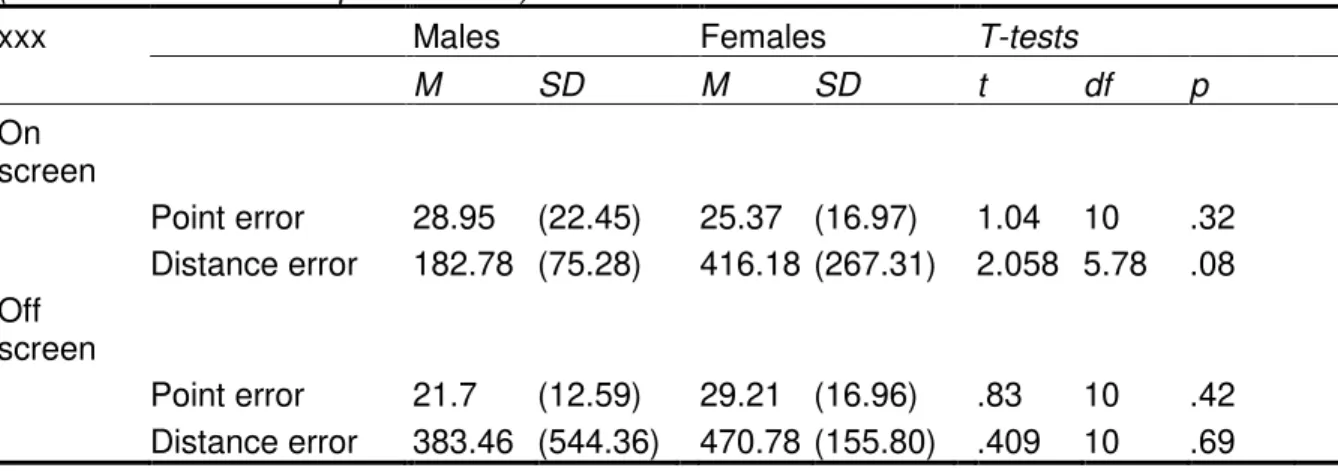
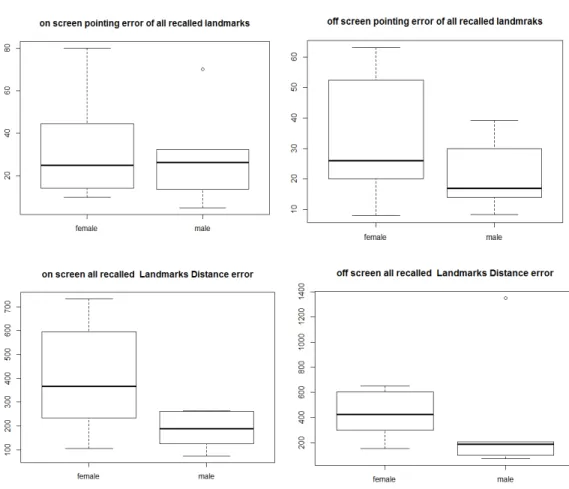
Task 3-
In the third task, participants were asked to point and estimate the direction of all landmarks that they could recall.
Among the on/off screen groups, there was no significant difference in pointing and direction estimation. While there is no difference in pointing error at this task, men show a smaller error regarding the distance estimation when using the off screen interface.( see table 5)
In task 3, females’ distance estimation error in the on screen interface group
is greater than males’. Using the off screen interface, men still do better but
size of difference is smaller. Male in the off screen interface group demonstrated smaller pointing errors. ( see figure 6)
Table 5- point and distance task 2
Means of pointing errors and distance errors for males and females of both interface groups (standard deviations in parentheses)
xxx Males Females T-tests
M SD M SD t df p
On screen
Point error 28.95 (22.45) 25.37 (16.97) 1.04 10 .32 Distance error 182.78 (75.28) 416.18 (267.31) 2.058 5.78 .08 Off
screen
30
31
Means of tasks
Results of all tasks based on pointing and distance estimation error were analyzed and compared. Two types of combinations were made depending on distance and pointing error. The first is the mean of tasks that required recalling surrounding landmarks (task 2 and 3). The second is the sum of all orientation tasks.
Comparison of the two interfaces
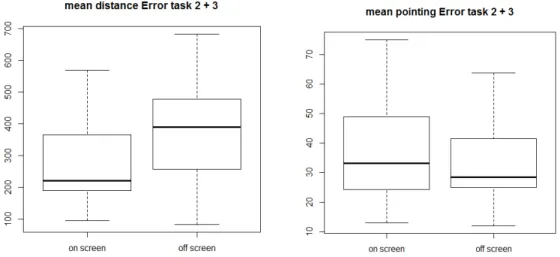
A marginally significant difference in distance estimation was found within the tasks that locate the surrounding landmarks (task 2 and 3). A comparison between the two interface groups showed that users of the off screen interface (M=415.98, SD=178.52) had a larger distance error in comparison to the on screen users (M=286, SD=152.96); t (22) = -1.911, p=.06 (see figure 7). Results suggest that users of the off screen interface had a larger distance estimation error. No significant difference was found in pointing error.
32 Gender comparison:
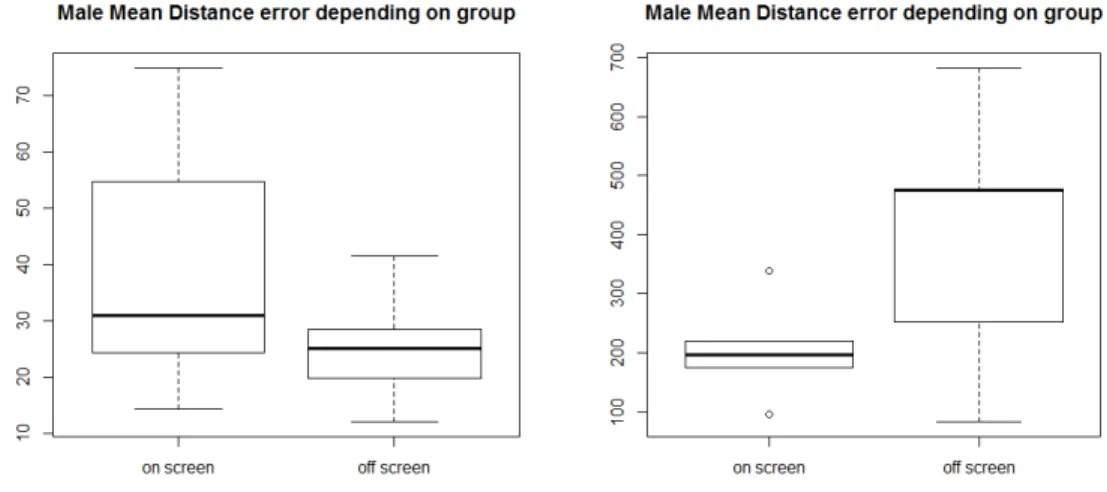
Though no significant difference was found between genders, boxplots in figure 8 insinuate that males, compared to females, were affected to a stronger degree by the type of interface used.
Males using the on screen interface (M= 203, SD= 79.46) showed a smaller distance estimation error than males using the off screen interface (M= 393,
SD= 148.40); t(4.788) = -1.75, p=0.14. In contrast to results for distance estimations, pointing error of males using the on screen interface (M= 38,
SD= 22.34) was larger than males’ pointing error in the off screen interface group (M=25, SD= 10.93); t (9) = 1.18, p =0.26.
33
Cognitive representation
Mental representation of the study environment was measured by two separate tasks. The first required sketching the route followed. The second was placing landmark icons on a map that represented the study area.
Sketch map task
Participants were asked to draw the route followed during the experiment on a blank A4 paper. Observed turn points were marked and compered to actual turn points.
Angle Accuracy
Among the on/off screen groups, there was no significant difference in angle accuracy. No significant difference was found between genders. Regarding the on-screen interface, female participants (M= 0.86, SD= 0.10) showed similar angle accuracy compared to male participants (M= 0.85, SD= 0.07); t
34 Figure 9- Angle accuracy based on based
Figure 10- Angle accuracy based on map interface.
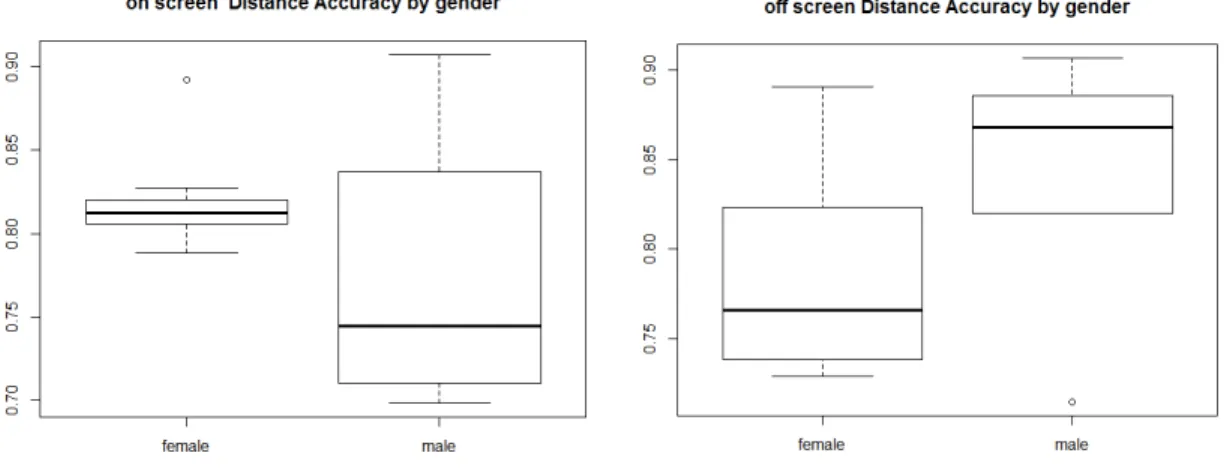
Distance Accuracy
When using the on screen interface, females’ (M=0.82, SD=0.04) distance
35
Figure 11- Distance accuracy based on gender.
Icon map
Participant were ask to place landmarks icon on to a map the represented the study area.
Among the on/off screen groups, there was no significant difference in score or the listing of icon remembers. No significant difference was found between genders groups of on-screen interface, but a significant difference was found between genders groups of the off-screen interface (see table 7).
36
Table 6 - Score and icons listed comparison of SOD
Means of score and icons listed for poor SOD and good SOD of both interface groups (standard deviations in parentheses)
Poor SOD Good SOD T-tests
M SD M SD t df p
On screen
Score 10.17 (4.79) 10.67 (3.2) -2.21 10 .83 Icons listed 12.17 (1.94) 9.0 (2.0) 2.78 10 .02
Off screen
Score 9 (3.84) 10 (7.07) -.30 10 .77 Icons listed 10.33 (1.96) 10.17 (1.32) .17 10 .87
Table 7 - Score and icons listed comparison Gender
Means of score and icons listed for males and females of both interface groups (standard deviations in parentheses)
Males Females T-tests
M SD M SD t df p
On screen
Score 10.50 (2.95) 10.33 (4.96) -.70 10 .94 Icons listed 9.83 (3.18) 11.33 (1.5) 1.04 10 .32 Off
screen
Interaction with map
To each map interface software an action log was added. This recorded actions made by the user during the duration of the experiment, such as panning and zooming.
Zooming
A comparison between the two interfaces groups indicated a significant difference in times zooming. Participants using the on screen interface (M=38,
SD=20.07) zoomed more than off screen users (M=16.76, SD=10.87);
t(23)=3.32 , p = 0.003. Results suggest that users of the off screen interface preferred to stay at the same scale of the map and zoom less.
Females using the on screen interface (M=38, SD=12.89) zoomed significantly more than females in the off screen interface group (M=21.42,
SD=11.64); t(11) = 2.43, p = 0.03. Males in the on screen interface group (M= 39, SD=29.81) zoomed (not significantly) more than males in the off screen interface group (M=12, SD=7.29); t (4.47)=1,92 , p = 0.12.
In relation to SOD, participants with a good SOD showed significantly less zooming actions than participants with poor SOD. The good SOD users in the on screen interface group (M=47, SD=24.45) zoomed more than the good SOD users in the off screen interface group (M=18, SD=11.43); t (10) = 2.57,
39
Panning
Among the two interface groups, there was no significant difference in the amount of panning made. Focusing on male participants, a significant difference in number of panning could be found between the two interface groups. Males using the on-screen interface (M= 1052, SD= 670.58) panned less than males using the off-screen interface (M=213, SD=1005.03); t(8)= -2.002, p = 0.08.
Though no significant difference was found among the male participants in relation to zooming (on-screen (M= 1052, SD= 670.58) and off-screen (M=2134, SD=1005.03) interface; t (4.47)= 1.923, p = 0.119). The boxplot 12 suggests that there is a relation between zooming and panning depending on the interface used.
Figure 12- male zooming and panning based on map interface.
CHAPTER V
DISCUSSION
This study compared the orientation abilities of two groups, each using a different map interface. The comparison was done through an experiment that
measured participants’ orientation abilities, mental representation (cognitive
map) and user interaction with the interface.
Participants using the off-screen interface zoomed less than participants using the on-screen interface. This indicates the importance of viewing a map on a large scale. When viewing a map on a large scale, streets name can be discerned, and small roads are visualized, which enables participants to self-position themselves on the map. The information presented on a screen when viewing maps on a large scale is comfortable to the user, therefore, will choose to stay on this scale if possible (Büring et al, 2006). On the other hand, when viewing a map on a large scale, information of the surrounding area cannot be visualized. Winter 2008, describes landmarks as anchor
points in our cognitive map that are essential to the user’s orientation in the environment. When viewing maps on a large scale, users of the on-screen interface must zoom out in order to visualize the nearby landmarks, as opposed to the off-screen interface participants. The off-screen interface presented surrounding landmarks on the users’ preference scale, therefore there is less reason to zoom out.
Female participants of the off-screen interface zoomed significantly less than females using the on-screen interface. Allen 1999, suggests that females tend
to use “route strategy” when wayfinding. This strategy relies on routes and
41
importance to this strategy. When using the off-screen interface, this information can be displayed along with the landmarks. Allen also suggests
that in contrast to females, males tend to use the “orientation strategy” when
wayfinding. This strategy relies on the understanding of direction and distance of surrounding landmarks. Indeed, in this study I found that in the off-screen group interface male participants zoomed less than female participants. Moreover, this strategy can be related to the difference found among men regarding map panning. Male participants using the off-screen interface zoomed less and map panned significantly more in comparison to male participants using the on-screen interface. These findings suggest that participants using the off-screen interface felt more comfortable remaining on one scale.
In addition, participants’ interaction with the map was found to have an effect on orientation tasks (tasks along the route). Participants of the off-screen interface group presented a greater distance estimation error compared to participants using the on-screen interface. A reasonable explanation can be assigned to the fact that off-screen participants zoomed less than on-screen participants. The off-screen interface users were provided with the direction of the landmark, but not the distance. Participants that do not zoom out to a smaller scale find it harder to estimate distances such as location-landmarks and landmark-landmark.
off-42
screen interface. This implies the males distance estimation is strongly affected by the off-screen interface, whereas female are less affected.
Regarding pointing error in the orientation tasks, no significant difference among the two map interface groups was found. This was unexpected since the off-screen interface presents icons and their general direction. A possible explanation is related to the experiment procedure and spatial memory. The
aim of this task was to evaluate the participants’ understanding of their
location. When looking at a map there is no need of spatial memory, just a clear visualization of information. Spatial memory is used in terms of remembering objects in relation to other objects (Montello et al, 2004). When orientating without a physical map, we rely on our cognitive maps. During the experiment, participants stopped to view the map every few hundred meters and could observe the relation of the surrounding landmarks. At the task location participants did not view the map before starting the task. The movement between the last map stop and the task location might have confused participants of both groups. Montello & Sas 2006 state that movement between locations involves locomotion. Locomotion is subject to human-factor and has an effect on the individual navigation abilities and influences the subject’s spatial memory.
43
genders the off-screen interface group. Coluccia et al 2007, examined the relationship between map drawing skills and spatial orientation abilities. In their study, males were more accurate than females in map drawing, which was related to their superior spatial orientation abilities. In this study, females of the on-screen interface showed high levels of distance and angle accuracy using the on-screen interface. In contrast, females using the off-screen interface showed low levels of angle and distance accuracy. This is could be due to the necessity of females in the off-screen interface to zoom significantly less than females of the on-screen interface. Unexpected, when comparing the two participant of poor SOD to participant with good SOD, no significant differences were noticed.
Interestingly, the icon map task results showed that the number of landmarks recalled and total score were similar among the two interface groups. The average participant recall of both interfaces was 10 out of 14 landmarks, but the average score was less than half of the total achievable score. This implies that most participants could recall icons seen on the map, but could not place them in the right location.
44
Limitation
Though extensive research has been done in the fields of navigation and wayfinding, the study of orientation abilities not related to navigation and wayfinding is extremely limited. This limits the ability to compare this
experiment’s results to findings of similar studies.
This aim of this study was to compare two map interface groups. Therefore, navigation abilities were not of interest, only orientation skills. Since participants were guided through the route, they were not highly motivated to remember the location of landmarks and turns along the route. Participant motivation has been shown to affect performance on navigational tasks (reference here).
45 CAPTER VI
CONCLUSION AND OUT LOOK
The aim of this study was to investigate the effect of the off-screen interface
on the user’s spatial abilities and his interaction with a small screen map
display.
The experiment in this study compared participants of two map interfaces, and was able to provide information to this relatively new field of study. Though comparing the two interface group did not show a significant difference in orientation abilities, a significant difference in user-interface interaction was observed. Participants which used the off-screen interface switched less times between the map scales, implying that they feel comfortable with the information provided with this interface. This is noticeable with both genders and participants of good and poor SOD. This study found that male participants are highly affected by the use of the off-screen interface. Males using the off-off-screen interface show larger distance estimation error, but a more accurate understanding of the environment and their surroundings. Unexpectedly, a significant difference was not found between participants of different SOD. This implies that the interface has a smaller effect on the elements that construct the personal sense of direction.
46
REFERENCES
Allen, G. L. (1999). Cognitive abilities in the service of wayfinding: A
functional approach. The Professional Geographer, 51(4), 555-561. Baudisch, P., & Rosenholtz, R. (2003, April). Halo: a technique for visualizing
off-screen objects. In Proceedings of the SIGCHI conference on Human factors in computing systems (pp. 481-488). ACM. Bederson, B. B., & Hollan, J. D. (1994, November). Pad++: a zooming
graphical interface for exploring alternate interface physics. In Proceedings of the 7th annual ACM symposium on User interface software and technology (pp. 17-26). ACM.
Bonnington,C,. (11/4/13). Smartphones screen size keep on growing- but not for much longer .Retrieved 20/12/13, From:
http://www.wired.com/gadgetlab/2013/04/why-big-smartphone-screens Burigat, S., & Chittaro, L. (2011). Visualizing references to off-screen content
on mobile devices: A comparison of Arrows, Wedge, and Overview+ Detail. Interacting with Computers, 23(2), 156-166.
Büring, T., Gerken, J., & Reiterer, H. (2006, May). Usability of overview-supported zooming on small screens with regard to individual
differences in spatial ability. In Proceedings of the working conference on Advanced visual interfaces (pp. 233-240). ACM.
Chen, C. H., Chang, W. C., & Chang, W. T. (2009). Gender differences in relation to wayfinding strategies, navigational support design, and wayfinding task difficulty. Journal of environmental psychology, 29(2), 220-226.
Coluccia, E., & Louse, G. (2004). Gender differences in spatial orientation: A review. Journal of environmental psychology, 24(3), 329-340.
Coluccia, E., Iosue, G., & Antonella Brandimonte, M. (2007). The relationship between map drawing and spatial orientation abilities: A study of gender differences. Journal of Environmental Psychology, 27(2), 135-144.
Cornell, E. H., Sorenson, A., & Mio, T. (2003). Human sense of direction and wayfinding. Annals of the Association of American Geographers, 93(2), 399-425.
47
Cox, D. A., Chugh, J. S., Gutwin, C., & Greenberg, S. (1998, April). The usability of transparent overview layers. In CHI 98 Cconference Summary on Human Factors in Computing Systems (pp. 301-302). ACM.
Dillemuth, J. A. (2009). Navigation tasks with small-display maps: the sum of the parts does not equal the whole. Cartographica: The International Journal for Geographic Information and Geovisualization, 44(3), 187-200.
Dillemuth, J. A. (2005). Human-map interaction for mobile cartography (Doctoral dissertation, University of California).
Friedman, A., & Kohler, B. (2003). Bidimensional regression: assessing the configural similarity and accuracy of cognitive maps and other two-dimensional data sets. Psychological methods, 8(4), 468.
Gustafson, S., Baudisch, P., Gutwin, C., & Irani, P. (2008, April). Wedge: clutter-free visualization of off-screen locations. In Proceedings of the SIGCHI Conference on Human Factors in Computing Systems (pp. 787-796). ACM.
Gardony, A.L., Brunyé, T.T., Taylor, H.A., & Wolford, G.L. (2013). Streamlining Sketch Map Analysis: The Gardony Map Drawing
Analyzer. Proceedings of the 54th Annual Meeting of the Psychonomic Society. Toronto, ON.
Hegarty, M., Montello, D. R., Richardson, A. E., Ishikawa, T., & Lovelace, K. (2006). Spatial abilities at different scales: Individual differences in aptitude-test performance and spatial-layout learning. Intelligence, 34(2), 151-176.
Hegarty, M., Richardson, A. E., Montello, D. R., Lovelace, K., & Subbiah, I. (2002). Development of a self-report measure of environmental spatial ability. Intelligence, 30(5), 425-447.
Hirtle, S. C., & Jonides, J. (1985). Evidence of hierarchies in cognitive maps. Memory & Cognition, 13(3), 208-217.
Hund, A. M., & Nazarczuk, S. N. (2009). The effects of sense of direction and training experience on wayfinding efficiency. Journal of environmental Psychology, 29(1), 151-159.
48
Ishikawa, T., & Montello, D. R. (2006). Spatial knowledge acquisition from direct experience in the environment: Individual differences in the development of metric knowledge and the integration of separately learned places. Cognitive psychology, 52(2), 93-129.
Ishikawa, T. (2013). Retention of memory for large-scale spaces. Memory, 21(7), 807-817.
Kato, Y., & Takeuchi, Y. (2003). Individual differences in wayfinding strategies. Journal of Environmental Psychology, 23(2), 171-188. Lawton, C. A. (1994). Gender differences in way-finding strategies:
Relationship to spatial ability and spatial anxiety. Sex roles, 30(11-12), 765-779.
Lawton, C. A., & Morrin, K. A. (1999). Gender differences in pointing accuracy in computer-simulated 3D mazes. Sex roles, 40(1-2), 73-92.
Lynch, K. (1960). The image of the city (Vol. 11). MIT press.
Montello, D. R., & Sas, C. (2006). Human factors of wayfinding in navigation. Chicago
Montello, D. R., Waller, D., Hegarty, M., & Richardson, A. E. (2004). Spatial memory of real environments, virtual environments, and maps. Human spatial memory: Remembering where, 251-285.
Montello, D. R., & Pick, H. L. (1993). Integrating knowledge of vertically aligned large-scale spaces. Environment and Behavior, 25(3), 457-484.
Münzer, S., Zimmer, H. D., Schwalm, M., Baus, J., & Aslan, I. (2006).
Computer-assisted navigation and the acquisition of route and survey knowledge. Journal of Environmental Psychology, 26(4), 300-308. Munster (2013) www.muenster.de/stadt/tourismus/en/city-of-bikes.html.
Retrieved 4/11/13
Nothegger, C., Winter, S., & Raubal, M. (2004). Selection of salient features for route directions. Spatial cognition and computation, 4(2), 113-136. Nissen, F., Hvas, A., Münster-Swendsen, J., & Brodersen, L. (2003).
Small-display cartography. EU-projek
Siegel, A. W., & White, S. H. (1975). The development of spatial representations of large-scale environments. Advances in child development and behavior, 10, 9.
Skundergard, K., Kirsh, D., & Dahlbäck, N. (2012). Maps in the Head and Maps in the Hand. In CogSci 2012 (pp. 2339-2344).
49
Thefreedicsonary(2014) www.thefreedictionary.com/sense+of+direction received (2/1/14)
Tobler, W. R. (1965, December). Computation of the correspondence of geographical patterns. In Papers of the Regional Science Association (Vol. 15, No. 1, pp. 131-139). Springer-Verlag.
Tolman, E. C. (1948). Cognitive maps in rats and men. Psychological review, 55(4), 189.
Tversky, B. (1993). Cognitive maps, cognitive collages, and spatial mental models. In Spatial Information Theory A Theoretical Basis for GIS (pp. 14-24). Springer Berlin Heidelberg.
Willis, K. S., Hölscher, C., Wilbertz, G., & Li, C. (2009). A comparison of spatial knowledge acquisition with maps and mobile maps. Computers, Environment and Urban Systems, 33(2), 100-110.
Winter, S., Tomko, M., Elias, B., & Sester, M. (2008). Landmark hierarchies in context. ENVIRONMENT AND PLANNING B PLANNING AND
DESIGN, 35(3), 381.
Woollett, K., & Maguire, E. A. (2010). The effect of navigational expertise on wayfinding in new environments. Journal of environmental psychology, 30(4), 565-573.
APPENDIX A Legal form
pInformed Consent Form for Social Science Research
Spatial Intelligence Lab, Institute for Geoinformatics, University of Muenster Title of Project: Off scale landmarks app and its effects on spatial abilities.
Principal Investigators: Amichai Korda, Dr. Rui Li IFGI, Heisenbergstraße 2, Münster
1. Purpose of the Study: studies the field of mental maps and small screen maps. Testing of a new app to see how it influences your understanding of the environment.
2. Procedures to be followed: Ride bikes in a neighborhood in Münster and stop at a few different points. At the stops you will be asked some simple questions
3. Discomforts and Risks: There are no risks in participating in this research beyond those of riding a bike.
4. Benefits: Helping and taking part of an interesting experiment. 5. Duration: The entire practice will take less than 50 minutes. 6. Statement of Confidentiality: Your participation in this research is
confidential. No personally identifiable information will be neither associated with the data nor used in publications.
7. Right to Ask Questions: Please contact Ami korda with questions, complaints or concerns about this research.
51
withdrawal from this study will involve no penalty or loss of benefits you would receive otherwise.
9. Data storage. The data with no identity associated will be stored in an online database.
10. Use of material. This material will only be used for demonstration
purposes in this course or future publication. You must be 18 years of age or older to take part in this research study. If you agree to take part in this research study and the information outlined above, please sign your name and indicate the date below.
You can contact us later for a copy of this consent form for your records. ______________________________________________
_____________________
Participant Name (please print) & Signature Date
______________________________________________ _____________________
52 APPENDIX B
54 APPENDIX C
Icon map
1
2
3
4
5
6
7
8
9
10
11
12
13
14
15
16