Mercator, Fortaleza, v. 15, n. 3, p.19-36, jul./sep., 2016.
SPATIAL DISPERSION OF POPULATION IN THE BRAZIL
dispersão espacial da população no Brasil
Carlos Lobo *
Resumo
As evidências históricas não deixam dúvidas sobre a relevância dos deslocamentos espaciais da população na ocupação do território nacional. Em vários momentos no tempo essa força de trabalho móvel serviu como fonte catalisadora de profundas transformações econômicas e sociais nas regiões de origem e destino e não apenas como mão de obra disponível para as atividades econômicas. Esse trabalho tem como objetivo a
ava-liação da magnitude e diferenças no processo de dispersão espacial da população nas Regiões de Inluência das Áreas de Concentração deinidas pelo IBGE, tendo como base na distribuição dos estoques de população e dos luxos migratórios identiicados no Censo Demográico de 1991, 2000 e 2010. Os resultados demons
-tram que não há uma tendência generalizada de ampliação da dispersão espacial da população. Embora os núcleos regionais que compõem as denominadas ACPs tenham experimentado, em sua maioria, queda no ritmo de crescimento demográico e perdas relativas no processo de redistribuição espacial da população,
ainda exercem alto nível de atração na população em cada região.
Palavras-chave: Dispersão Espacial; População; Migração; Áreas de Concentração (apcs).
Abstract
The historical evidence leaves no doubt about the relevance of the spatial displacement of the population in the occupation of the national territory. At various points in time this mobile workforce served as the catalyst of profound economic and social changes in their regions of origin and destination and not only as labor
available for economic activities. This study aims to evaluate the magnitude and diferences in the process of spatial dispersion of the population in the Regions of Inluence of the Areas of Concentration deined by the IBGE, based on the distribution of population stocks and migration lows identiied in the 1991, 2000
and 2010 Censuses. The results show that there is not a general trend of increasing spatial dispersion of the
population. Although on the whole the regional centers that make up the so-called APCs have experienced
a fall in the rate of population growth and relative losses in the process of spatial redistribution of the
popu-lation, they still exert a high level of attraction over the population in each region.
Key Words: Spatial Dispersion of Populations; Migration; Areas of Population Concentration (apcs).
Resumen
Las evidencias históricas no dejan dudas sobre la relevancia de los desplazamientos espaciales de la población en la ocupación del territorio nacional. En varios momentos del tiempo esa fuerza de trabajo móvil sirvió como fuente catalizadora de profundas transformaciones económicas y sociales en las regiones de origen y
destino y no solamente como mano de obra disponible para las actividades económicas. Este trabajo tiene como objetivo la evaluación de la magnitud y diferencias en el proceso de dispersión espacial de la población
en las Regiones Inluencia de las Áreas de Concentración deinidas por el IBGE, tomando como base la distribución de los estoques de población y de los lujos migratorios identiicados en el Censo Demográico de 1991, 2000, 2010. Los resultados demuestran que no hay una tendencia generalizada de ampliación de la dispersión espacial de la población. Aunque los núcleos regionales que componen las denominadas ACPs hayan experimentado, en su mayoría, reducción en el ritmo de crecimiento demográico y pérdidas relativas en el proceso de redistribución espacial de la población, aún ejercen alto nivel de atracción en la
población en cada región.
Palabras claves: Dispersión espacial; Población; Migración; Zonas de concentración.
20
INTRODUCTION
One of the issues of interest to regional studies refers to the supposed process of spatial deconcentration of the population and economic activities. Despite the recurring controversy on the subject, which resulted in the proposal of terms such as “reverse polarization “, “concentrated
de-concentration”, and “polygonal development”, there is at least a consensus regarding the empi
-rical evidence of a reduction in the momentum of population growth in large Brazilian metropolitan centers, especially in the inal decades of the last century. Although the processes of urbanization and metropolization in Brazil are relatively recent, the data available from the past demographic Censuses seem to conirm a trend, although not widespread, in the growth of emigration from the
main metropolises in the country, even if these centers have maintained their regional demogra
-phic expression and have continued to attract signiicant numbers of migrants. In addition to the contributions of the regional economy and demographics, already traditional in research in the area, this debate requires new evidence about the efects of the alleged spatial redistribution of the
population. However, in the ield of Geography there are few studies on internal migration in Bra
-zil, especially those that use census data to estimate the spatial movements of the population. The regional analysis of migration lows makes it possible to recognize under-explored dimensions in
studies of the de-concentration or spatial dispersion process of the population.
Studies on the spatial mobility of the population underwent a signiicant change in their the
-oretical approach after the analysis of the reality of late industrializing countries (PACHECO and PATARRA, 1997). The dynamics of capital accumulation, the historical heritage and social structures
are now considered key to the mobility of the population and the workforce for the industry in ex-pansion or in response to the situation of stagnation with the growing concentration of the dynamic
poles. Singer (1973), for example, considers migration to be a direct relection of the structure of
the development of the capitalist system, whose main driver is the intensiication of regional ine
-qualities. Despite their merits, considering the context in which they were proposed, Structuralist formulations do not respond fully to the most dynamic issues of the population, including those speciic to migration and other spatial displacements, such as commuting or seasonal mobility, not
only linked to the needs of the today’s capitalist system. If the way spatial elements are arranged
can be seen as a historical result of the activities of political, economic and social actors, the lows of information, capital and people allow and feed the dynamism of forms and functions that make up and characterize each region. Santos (1997), for example, considers the need for luidity as one of the most important features of the present world, which is especially relevant to regional studies. Migratory movements are phenomena that manifest themselves and materialize in time and space and should not be considered only as a result of a given social reality and / or economic condition, but also as a cause of other lows such as investment, technology, professional experience , etc., which have their regional manifestations (LOBO and MATOS, 2011).
Therefore understanding migration dynamics on a regional scale involves the investigation of
relations that are established between the various forms of human settlement, favoring combinations and diferentiations which manifest themselves in space. It is precisely the approach on a regional
scale which gives this research its distinctiveness. The objective proposed in this study is to
eva-luate the current stage of the spatial dispersion of the population, in particular in the spatial area established by the Regions of Inluence (RIs) of the Areas of Population Concentration (APCs), as deined by the IBGE (REGIC 2007). Once the dimensions and lows of the stock had been broken down into the resident population and inter-municipal migration, the microdata extracted from the 1991, 2000 and 2010 Demographic Censuses was used in the study. Although it may be subject to criticism and controversy, the regional proile established also allows the analysis of the migration lows circumscribed in a network analysis, assessing the losses and gains of each spatial unit at
21
THE CONCENTRATION AND SPATIAL DISPERSION OF THE POPULATION: THEORETICAL AND CONCEPTUAL ASPECTS
Richardson (1980) published a reference work on the process of reversing the polarization of economic activities and the population. In this work, the author established as a premise the idea
that the continued growth of the concentration of economic activities does not lead to a perpetual
increase in eiciency because the marginal beneits derived from the urban scale and concentration tend to decrease from the time at which the urban center reaches a certain population size. In the same work the author states that the rollback process is characterized by the change in the trend of spatial polarization in the national economy, from which there would be a spatial dispersion out of the central region. Still according to Richardson (1980), a sequence of events characterizes the reversal of the polarization: at irst, a well-deined process of economic concentration is established,
creating a center and a periphery, when there are structural changes in the central area. As the ad
-jacent cores begin to show faster growth than the center, the process of reversing the polarization begins, schematizing a wider dispersion. The dispersion also reaches secondary centers when the
central area begins to lose population. The faster expansion of employment opportunities outside
the major metropolitan area promotes a redistribution of the population in the whole urban system, relecting the growing comparative advantages of the secondary cities (average). This framework is the relection of the conversion of lows of capital and work out of the central core (metropolis) to secondary (average) cities, promoting the increase of economic and demographic growth rates.
There have been several attempts to empirically evaluate evidence on the process of economic
and demographic de-concentration / dispersion. Champion (1984), for example, speciically em
-phasized demographics, using the oicial annual population estimates to examine changes in the scale of the rural-urban shift in the distribution of the UK population since the 1960s. The results
showed that the level of de-concentration of the population at the regional level reached its peak
in the early 1970s and since then the rate of population loss observed in London and several other major cities has declined sharply. The results indicate that the diferentials of the growth rate of the population between metropolitan and non-metropolitan Britain narrowed between 1970 and 1980 but the negative relationship between the urban situation and population change remained. Unlike the experience of the USA and other European countries, in the mid-1980s Britain experienced a
resurgence of non-metropolitan growth, which had a widespread impact across the country (Cham
-pion, 1994). Lipshitz (1996) examined the population and migration in Israel in the period from 1948 to 1992 and noted that the most common feature was a slowing or even a reversal in the trend of concentration, which had been occurring widely in the previous decade, although the results were not generalized to all regions of the country. One conclusion of the study was that most people
moving from central regions chose the metropolitan peripheries as their destination.
In Brazil, some attempts to apply these models have been presented. However, Brazilian structural and sectorial characteristics make it additionally diicult to interpret the phenomenon correctly. Townroe and Keen (1984) presented some concrete evidence of a reversal of polarization in the state of São Paulo between 1970 and 1980. In addition to the decline in population of the core population, the authors identiied clear signs of spatial de-concentration of the population. However, the proposals regarding the possible reversal of the process of polarization in Brazil was heavily criticized, both for the consistency of the empirical evidence presented and the type of variables and methodology used. Azzoni (1986) highlighted that the size of the city should be considered as
an indicator of agglomeration economies as it is crucial to consider the central region capable of
22
observed in São Paulo would be closer to a spread of industry within the most industrialized area
of the country, in a process of “concentrated de-concentration” (AZZONI, 1986). Diniz (1993) pro
-vided elements of a new form of interpretation. After the indisputable economic and demographic
concentration veriied until the late 1960s, the process of reversal of polarization began (DINIZ, 1993). For Diniz (1993), the “spread” of Brazilian industry did not only occur within the limited
radius of 150 km of the metropolitan area of São Paulo. After the undeniable economic and demo
-graphic concentration veriied until the end of the 1960s, initially there was the process of reversal of this polarization. However, the de-concentration process was not widespread; instead it took place in well-equipped, rich selective spaces in the externalities of the country, mainly relecting the spread inland in certain states. In a second phase, there was the relative re-concentration in the polygon deined by the region formed by Belo Horizonte-Uberlândia-Londrina / Maringá-Porto Alegre-Florianópolis-São José dos Campos-Belo Horizonte.
In addition to considering Azzoni’s analogy unwarranted, Negri (1996), believed the polygon established by Diniz (1993) was inappropriate, as although the central region beneited from the decentralization of the previous 20 years, when its share in the domestic industry increased from 33.1% to 49.2%, this represented no inconsistencies against the growth outside the polygon. In a way Matos’ (1995) observations corroborate the analysis carried out by Azzoni, as the true scope of the alleged phenomenon of decentralization is unknown or if the existing explanations cover all cases, even though major changes in the spatial distribution of the population are underway. It is important to recognize, therefore, that much of the expansion of the country’s urbanization in
recent decades stems from the multiplier efects of the spread of urban and industrial concentra
-tion in the Southeast. This process stimulated the increased density of the urban network and the
links of complementarity between the various centralities. Lobo and Matos (2011), on analyzing spatial dispersion in Brazil in the 1980s to 2000, did not conirm the completeness of the reversal of polarization in Richardson’s terms or the supposed economic and demographic de-concentration highlighted by Redwood III, among others, but they provide signs of the spatial dispersion of the population, already prominent in certain cases, such as the Region of Inluence of São Paulo. In this region, the volume of targeted migratory lows to the main attraction centers suggests that this is a form of “polynuclear dispersion” (LOBO, 2009).
In fact, the interpretation of reality by theoretical models outlined for the advanced developed
countries collides with the particularity and complexity that mark the formation of territory and the
organization of national space. The Brazilian urbanization process began to take shape in the 1940s, when a still fragile industrialization led to a spatial reorganization of the population in the country. A new pattern of urbanization, essentially concentrating, was being drawn. It is in the Southeast that
the big urban centers concentrating this huge mass of urbanites forming in the country were located.
This occurred over the heads of government eforts aimed at the opening of the agricultural frontiers since the 1930s (MARTINE, 1987; PATARRA, 1984 TASCHNER and BÓGUS, 1986). In contrast, the rural population has declined since the 1950s. In the 1970s the urban population accounted for about 56% of the total Brazilian population. In the same period, this proportion reached 72.7% in the case of the Southeast. The increase in rural-urban migration lows promoted the intensiication
of the process of growth of the urban population, heavily concentrated in major Brazilian cities, for
23
the arts and the practice of all professions that each year a greater number of people may dwell
in them” (RAVENSTEIN 1980: .26). For this same author, there are other aspects that should be considered, given their inducing efect in migration, such as educational facilities, the health of the
climate or the cost of living. In reviewing Ravestein’s theses, Lee (1980) introduces some addi
-tional information about the internal movements in the societies of late capitalism. In his analysis, Lee (1980) states that the decision to migrate is linked to a rational (though not exclusive) decision involving the positive and negative factors in the areas of origin and destination. It is natural, in the perspective ofered by this author, that diferent people are afected diferently by a number of
obstacles or incentives to the possibility of migration.
Although the individual perspective is not literally excluded, Singer (1973) considers migration a direct relection of the structure and the mechanisms of the development of the capitalist system, whose main driver is the intensiication of regional inequalities. For this author,
Of course, any manufacturing process involves a large transfer of activities (and therefore people) from the countryside to the cities. However, along capitalist lines such a transfer tends to favor only a few regions in each country, emptying the others. Such regional imbalances are well known and are compounded in that locational decisions are taken solely using the perspective of private enterprise as a criterion (SINGER, 1973, p.222).
Singer’s contribution (1973), especially as it relates to relections on migration, is to identify how the factors of attraction relect the need for manpower as a relex of the growth of industrial production and the expansion of the urban services sector. The push factors, in turn, can be divided
into factors of change stemming from capitalism’s penetration in the countryside and the adoption
of a labor saving system, and stagnation factors linked to demographic pressure on the Earth. The regions of change lose population, but productivity increases, which, at least in principle, allows an improvement in local living conditions. However, the areas of stagnation present a deteriorating quality of life, sometimes acting as “nurseries of labor” for the landlords and the big agricultural companies (SINGER, 1973). In the same Structuralist approach, there are still some authors who
consider migration as a low deeply linked to the creation, expansion and articulation of labor ma
-rkets. If development is uneven within capitalism, the population is distributed following the same logic of the intensiication of economic spaces, forming large labor pools. Aside from the merits
of such formulations the Structuralist approach cannot cover the whole multiplicity of the most
dynamic and speciic causes of migration, such as comparative advantages and external capabilities that have transformed the destination areas. For Matos (1995) little efort has been made to analyze
the migration of urban origin and often there has not even been any mention of return migration.
In addition, there is no substantive investment in understanding the positive efects that migration can stimulate in dynamizing destination regions, both with regard to the supply of skilled labor and certain possibilities of new investments and technical exchanges, for example. The analysis of migration gives visibility to broader social processes, not limited to being a simple indicator of the concentration or dispersion of economic activities. It also allows the identiication of a rural and urban development proile, the institutional and social forms of dissemination of information and innovations, the late or advanced insertion into the demographic transition and the degree of regional inequality when discussing the end of the concentrating pattern of activities. For Matos (2003) visibility should be given to recent changes in the Brazilian migratory pattern, which has been characterized by the second-class position of lows from the countryside to the cities and the
increasing complexity of the urban network, obvious signs of an increase in some positive externa
-lities on the outskirts and new migratory lows that are already heading to the medium-sized cities. Considering that the organization of the spatial elements should be regarded as the historical result of the activities of political, social and economic actors, the lows of information, capital
-24
pose and characterize the space. According to Santos (1997), luidity is one of the most important features of today’s world that is simultaneously the cause, condition and result of its own need. Internal migrations are, in essence, manifestations of these lows that materialize in space. These are contingents of people moving in space, a non-exclusive relection of a social reality and / or
momentary economic condition, but also the causes and consequences of other lows. These in
-volve investments, technologies and professional experience, which can translate into signiicant positive increments in the areas of origin. Evaluating this luidity at the regional level is a challenge
proposed in this study.
THE SPATIAL DISTRIBUTION OF THE POPULATION: THE REGIONAL PROFILE AND THE METHODOLOGICAL OPERATIONALIZATION USED
Urban hierarchical levels and the deinition of the regions of inluence of Brazilian cities come from previous studies conducted by the IBGE, which were based on questionnaires that allowed an investigation of the intensity of consumer lows in search of goods and services in the years 1966, 1978 and 1993. The current proposal for regionalization (REGIC 2007), published in 2008, resumes the original design used in the irst works carried out by the IBGE, which resulted in a classic study: Brazil’s division into functional urban regions in 1972. The REGIC 2007 favored the concept of territorial management, as deined by Corrêa (1995). For this author, the center of
territorial management
[...] is the city where, on the one hand, the various organs of the state are located and on the other, the headquarters of companies whose decisions directly or indirectly afect a given space that comes under the control of the city through the companies based in it (CORRÊA, 1995, p.83).
In brief, the hierarchy of the classiication of the network of cities favored two central levels: Federal Management, measured by the existence of organs of the Executive Branch and the Federal
Judiciary and Business Management, which refers to the presence of diferent equipment and ser
-vices (trade and ser-vices, inancial institutions, higher education, health, internet, open television networks and air travel connections). The inal set of Regions of Inluence in the country involved a total of 711 management centers, classiied into six hierarchical levels, according to their position in their respective spheres of federal and business management. Establishing of areas of inluence and the articulation of networks of cities occurred according to the intensity of the links, identiied based on secondary data and information obtained by a speciic questionnaire in the research. The cities were classiied into ive major levels of hierarchy, namely:
1. METROPOLISES - these are the 12 major urban centers in the country, characterized by their large size and the strong relationships with each other. In addition, they generally possess an extensive area of direct inluence. This group was divided into three sub-levels, according
to their territorial extension and the intensity of these relationships: 1.a The great national
metropolis - São Paulo, the largest city in the whole country, with 19.5 million inhabitants; 1.b - National metropolis - Rio de Janeiro and Brasilia, with a population of 11.8 million and 3.2 million in 2007, respectively; and 1.c - Metropolis - Manaus, Belém, Fortaleza, Recife, Salvador, Belo Horizonte, Curitiba, Goiânia and Porto Alegre, with a population ranging from 1.6 (Manaus) to 5.1 million (Belo Horizonte), are the second level of territorial management. 2. REGIONAL CAPITAL - there are 70 centers on this level, which like the metropolises also
relate to the upper strata of the urban network. With a management capacity on the level
im-mediately below that of the metropolises, they have a regional area of inluence, being referred
25
3. SUB-REGIONAL CENTER - there are 169 centers on this level with less complex ma
-nagement activities, dominantly between levels 4 and 5 of the territorial ma-nagement; they
have a smaller area of activity and their relationships with centers external to their network are generally only with the three national metropolises.
4. ZONE CENTER - this level consists of 556 smaller cities and their activity is restricted to their immediate area; they perform basic management functions.
5. LOCAL CENTER - the remaining 4,473 cities whose centrality and performance do not go beyond their municipal limits, serving only their inhabitants; their population is predominantly less than 10,000 inhabitants (median 8,133 inhabitants).
When considering the purposes deined in this work, the spatial area used was the aggregation
of the municipalities that make up the Areas of Population Concentration (APCs) from the irst hie
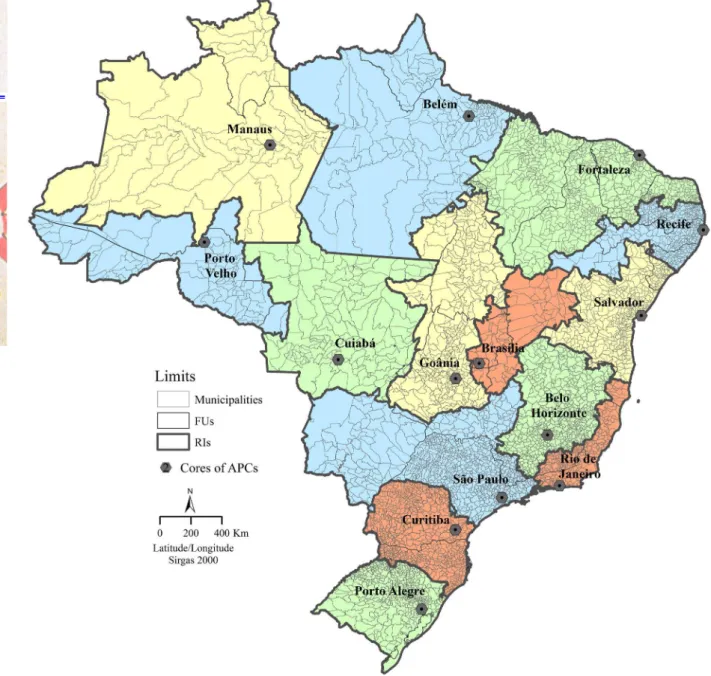
-rarchical level deined by the IBGE, which are: Belém, Belo Horizonte, Cuiabá, Curitiba, Fortaleza, Goiania, Manaus, Porto Alegre, Recife, Rio de Janeiro, Salvador and São Paulo. The RIs of Brasilia and Porto Velho were also included, which, although not considered APCs have a well-deined area of polarization, including in the REGIC. The areas delimiting each one of these Regions of Direct Inluence are shown in Figure 1. Size-wise, in addition to the RI of São Paulo, with 24.95% of the population, 16.06% of the municipalities and 8.89% of the area of the country, the RIs of Fortaleza and Rio de Janeiro are both notable, with a high proportion of the resident population. The case of Fortaleza is also noteworthy for its high percentage of municipalities and national territorial area, comprising, respectively, 14.43% and 9.30% (Table 1).
Based on this regional area, two dimensions were selected for the analysis of population dis
-persion: a) the stock (resident population); b) the low (migration). The irst, which converges an established situation of spatial distribution, was obtained from two variables: 1st) the proportion of the population outside the core, given by the sum of the residents in the municipalities of each RI, divided by the population of the municipal seat of each APC; and 2nd) linear distance (Euclidean) of Average Weighted Center (CMP) to the seat of the municipal core of each APC. In this case it
is a measure that evaluates the distancing of the gravitational center of the spatial distribution of
the population of the core of each APC. The size of the low is also composed of two variables,
which are: 1st) the emigration ratio, given by the division of the number of immigrants and intra
--regional migrants, coming from the core of the APC and those bound to it, broken down according to origin and destination in other municipalities of the respective RI. Thus, this variable indicates the proportion that the migration proceeding from the core represents in the migration to the core; 2nd) The Distance Weighted Average of the migration vectors coming from the core of each APC
bound to the municipalities of each RI. This variable weight was deined by the number of mi
-grants in each migratory vector (the vector representing the migratory trajectories in the migration matrix of inter-municipal origin/destination) in the ive-year periods of 1986/1991, 1995/2000 and 2005/2010. This study used the migration obtained by the ixed date variable. According to Carvalho and Rigotti (1998), a ixed date migrant is deined as a person who resided in diferent locations at the beginning and the end of the ive-year period under consideration. The values for each of these variables were converted into an index (I_v^d), given by the following expression:
���= ��− ���� ����− ����
��=��������������������������� "�"
����=���������������������������� "�"
26
This procedure allowed the standardization of the unit and the scale of analysis of the varia
-bles. As the maximum and minimum values of reference were established considering the three
periods analyzed, it was possible both to establish benchmarks between the diferent RIs of each APC and evaluate changes in the time scale. The values between 0 and 1 represent, in that order, the situations of lesser and greater spatial dispersion in the three decades evaluated (1991, 2000 and 2010). They relect regional diferences and temporal changes that represent the growth or lack of growth in each variable. Aggregating the scores related to two variables of each dimension, obtained by a simple arithmetic average, allowed the proposal of two Indices of Spatial Dispersion of the Population, the ISDP, that evaluates the dispersal of the dimension of stock; and the IDEP that indicates the variations in the dimension of low.
27
Table 1 - Resident population, number of municipalities and the total area of the Regions of Inluence of the cores of the APCs, Brazil 2010
REGICs/APCs
Resident Population Municipalities Area (x 1000)
Nº % Nº % Km2 %
Belém 7.914.205 4,15 149 2,68 1.306 15,33
Belo Horizonte 13.668.431 7,17 560 10,06 369 4,33
Brasília 4.941.351 2,59 92 1,65 286 3,36
Cuiabá 3.001.572 1,57 133 2,39 815 9,57 Curitiba 16.669.382 8,74 695 12,49 295 3,47
Fortaleza 21.526.957 11,29 803 14,43 792 9,30 Goiânia 6.434.593 3,37 347 6,24 653 7,66
Manaus 3.775.687 1,98 72 1,29 1.612 18,93
Porto Alegre 10.651.632 5,58 490 8,81 269 3,15
Recife 16.262.589 8,53 523 9,40 252 2,96 Salvador 14.093.979 7,39 431 7,74 341 4,01
São Paulo 47.597.847 24,95 894 16,06 757 8,89
Rio de Janeiro 21.727.716 11,39 293 5,27 139 1,64
Porto Velho 2.489.858 1,31 83 1,49 629 7,39
Total 190.755.799 100,00 5.565 100,00 8.517 100,00
Source: IBGE, Demographic Census 2010. Own Organization
With adaptations and methodological applications, as proposed in this work, the RIs of the cores of the APCs in Brazil provide more than one important spatial area of regional analysis. While it may raise broader methodological and conceptual questions, both theoretical and methodological,
the RIs represent an approximate picture that relects the relations of interdependence that are esta
-blished in space, where the spatial movements of the workforce play a particularly important role,
especially at a time where the spatial redistribution process of the population is becoming more
rele-vant. Taking the municipality as the spatial unit of analysis, according to the political-administrative division in each period, including subsequent spatial clusters (regional aggregations), it is possible
to identify and map the indicators of the distribution and spatial dispersion of the population. The
results, while not conclusive and circumscribed in a speciic time interval (three census decades)
can be useful not only for the analysis of regional migration dynamics but also the preparation and
discussion of public policies, including those aimed at overcoming the regional inequalities which have long been characteristic of the Brazilian reality.
SPATIAL DISPERSION OF THE POPULATION IN BRAZIL: SOME EMPIRICAL EVIDENCE
When considering the results regarding the distribution of the population (variable stock), an
initial observation concerns the higher proportion of the population living outside the cores of the
APCs, except for the case of Brasilia, which shows values above 50% in the three decades. However,
when comparing the values in the three censuses it is apparent that the percentage of the population
living in the RIs only grew in the APCs of Belém, Cuiabá, Fortaleza, Goiânia, Porto Alegre, Recife, Rio de Janeiro and São Paulo. Although this increased participation of RI in regional stocks is, in principle, a general indicator of dispersion in these cases, it is only in the case of Brasília, Porto Velho and Rio de Janeiro that there was an increase in the distance arising from the displacement
of the gravitational center of the population concentration, represented by the weighted mean cen
28
distances less than 100 km (except for cases of the RIs of Fortaleza and Goiânia that are a distance superior to 200 km). These associated parameters indicate that a considerable part of the RIs of the APCs in the country have experienced a growth of the demographic weight in municipalities closest to major regional centers, including those located on the periphery of metropolitan areas.
In general, the results of the analysis of the low indicators (intra-regional migration), indi
-cate a more deined picture of population dispersion, although regional characteristics should be
observed. This fact can be observed when comparing the values of the migration ratio given by dividing immigrants in RIs coming from the core by the migrants of RIs headed to the core of each
APC. Except for the APCs of Porto Alegre, Recife, Rio de Janeiro and São Paulo, there has been a growth in the migration ratio, which shows the relative (and, in many cases, absolute) growth in the migration from the cores to their respective IRs. However, the case of São Paulo is noteworthy as it has the highest relative decline, even though there was a negative migration balance in exchanges involving the core of the APCs. In the ive-year period 2005/2010, for example, for each migrant bound to the core, four were moving in the opposite direction (to the municipalities of the RI).
Table 2 - Resident population in the Regions of Inluence (RIs), number and percentage of the Population of the Core of the APC and the Distance of the Core in relation to the Weighted Mean Center (WMC) - Brazil 1991, 2000
and 2010
RIs/APCs
Population of RI (in thousands)
Population of RI/
Population of Core (%) Distance Core => CMP (km)
1991 2000 2010 1991 2000 2010 1991 2000 2010
Belém 3.779 5.110 6.521 75,22 79,96 82,39 167,26 151,61 154,86
Belo Horizonte 9.053 10.299 11.293 81,76 82,15 82,62 79,39 71,38 67,88 Brasília 1.531 1.993 2.371 48,88 49,29 47,99 153,71 129,93 117,56
Cuiabá 1.615 2.000 2.450 80,04 80,54 81,64 124,27 133,87 143,47 Curitiba 11.670 13.317 14.917 89,87 89,35 89,49 155,21 141,85 134,16
Fortaleza 14.634 16.743 19.075 89,22 88,66 88,61 289,96 285,86 284,55
Goiânia 3.614 4.324 5.133 79,67 79,82 79,77 214,75 211,64 209,29
Manaus 1.188 1.607 1.974 54,01 53,34 52,27 127,57 128,50 122,86
Porto Alegre 7.816 8.780 9.242 86,08 86,58 86,77 113,72 106,45 100,45 Porto Velho 1.407 1.754 2.061 83,03 83,98 82,79 161,14 169,70 174,03 Recife 12.048 13.305 14.725 90,27 90,34 90,54 156,64 154,52 154,56
Rio de Janeiro 11.772 13.677 15.407 68,23 70,01 70,91 104,11 106,80 108,77 Salvador 9.638 10.613 11.418 82,28 81,29 81,02 89,23 83,13 79,78
São Paulo 26.722 32.141 36.344 73,48 75,49 76,36 146,85 144,92 146,42
Source: IBGE, Demographic Census 1991, 2000 and 2010. Own Organization
Nevertheless, the igures for the Weighted Standard Distance (WSD), derived from inter
29 Osasco, Taboão da Serra, Santo André and Cotia. The vast majority are located in the metropolitan
periphery or in surrounding areas. In the other APCs, the municipalities that received more than 10,000 migrants coming from the core in the same ive-year period were: Ananindeua (Belém), Contagem and Ribeirão das Neves (Belo Horizonte), Águas Lindas de Goiás and Valparaíso de Goiás (Brasília), São José dos Pinhais and Colombo (Curitiba), Caucaia (Fortaleza), Aparecida de Goiânia (Goiânia), Viamão (Porto Alegre), Jaboatão dos Guararapes (Recife), Lauro de Freitas and Camaçari (Salvador), Duque de Caxias, Nova Iguaçu and Niterói (Rio de Janeiro).
Table 3 - Number of Immigrants, Migration ratio and Weighted Standard Distance (WSD) of migration lows from the core of the APCs - Brazil 1986/1991, 1995/2000 and 2005/2010
RIs/APCs
Nº of Immigrants (I)
Migration Ratio
(MR) (I/MR) DPP of the Migration Vectors (km)
1986/1991 1995/2000 2005/2010 1986/1991 1995/2000 2005/2010 1986/1991 1995/2000 2005/2010
Belém 57.428 92.008 79.565 1,01 1,90 2,21 134,52 117,46 142,42 Belo Horizonte 168.843 194.723 159.872 2,05 2,26 2,23 66,96 69,45 80,46
Brasília 53.378 95.016 71.626 1,72 3,32 2,17 77,57 69,30 86,52
Cuiabá 16.686 29.918 26.784 0,81 1,47 1,78 209,76 191,18 176,04
Curitiba 99.890 132.740 129.275 1,09 1,34 2,04 116,05 115,99 131,73
Fortaleza 90.692 103.510 99.426 0,83 1,32 1,52 119,35 132,83 137,81
Goiânia 90.015 101.231 92.979 1,56 1,47 1,82 120,41 129,56 158,56
Manaus 13.118 30.885 34.106 0,53 0,83 0,81 303,29 334,79 273,10
Porto Alegre 109.120 100.611 83.808 1,84 1,48 1,50 91,58 90,55 97,10
Porto Velho 5.665 12.097 10.112 0,32 0,95 0,49 365,81 278,78 261,25
Recife 110.179 100.730 89.746 2,66 2,33 2,13 52,12 59,97 74,46
Rio de Janeiro 191.498 221.781 182.450 4,27 3,54 3,37 87,35 81,25 87,24
Salvador 64.608 91.711 100.547 0,74 1,11 1,49 125,11 120,62 110,95
São Paulo 618.097 677.161 512.493 7,16 5,71 4,40 136,58 123,18 116,28
Source: IBGE, Demographic Census 1991, 2000 and 2010. Own Organization
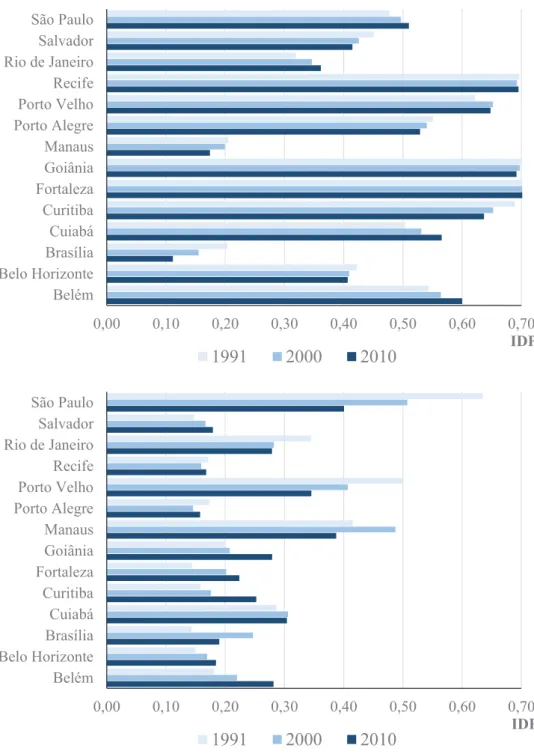
The analysis of the aggregated results of the Indices of the Spatial Dispersal of the Popula
-tion, shown in Figure 5, indicate a diferent picture. As regards the stock size (IDEPe), the RIs with highest dispersion are Fortaleza, Recife and Goiânia. These are regions with a high proportion of the population outside the core, although they involve metropolises with signiicant population volumes that have shown a rapid pace of population growth in recent decades. In a diferent situation, with lower dispersion levels, Manaus and Brasilia are signiicant. In the case of Manaus, the historical and geographical features of the region, with a large territorial extension, deine a high level of metropolitan primacy; there is also a low-level structuring of the urban network. When temporal variations are observed, the cases of Rio de Janeiro and Belém stand out. These are regions that
despite showing high levels of dispersion have experienced a spatial redistribution process of the
30
Figure 2 - Number of immigrants coming from the core of the APCs residing in the municipalities of each RI, ixed migration data 1986/1991
31
Figure 3 - Number of immigrants coming from the core of the APCs residing in the municipalities of each RI, ixed migration data 1995/2000
32
Figure 4 - Number of immigrants coming from the core of the APCs residing in the municipalities of each RI, ixed migration data 1986/1991
33
Figure 5 - Population Spatial Dispersion Index (IDEPe and IDEPf) of the RIs of the APCs - Brazil in 1991, 2000 and 2010
Source: IBGE, Demographic Census 1991, 2000 and 2010.
0,00 0,10 0,20 0,30 0,40 0,50 0,60 0,70 Belém
Belo HorizonteBrasília
Cuiabá Curitiba
FortalezaGoiânia
Manaus
Porto AlegrePorto Velho
Recife
Rio de Janeiro
Salvador
São Paulo
IDPe
1991 2000 2010
0,00 0,10 0,20 0,30 0,40 0,50 0,60 0,70 Belém
Belo HorizonteBrasília
Cuiabá Curitiba
FortalezaGoiânia
Manaus
Porto AlegrePorto Velho
Recife
Rio de Janeiro
Salvador
São Paulo
IDPf
34
The analysis of the low rate (IDEPf) identiies a diferent situation from that observed for the IDEPe. In view of the current migration dynamics in the region, the highest levels of dispersion correspond to the RIs of São Paulo, Manaus and Porto Velho. In the case of São Paulo, already renowned for its size, there has been a cooling of the dispersion trend. However, this does not mean that there is evidence of reconcentration. In fact, there is actually a growth in migration involving municipalities a short and medium distance away, whose higher weight interferes with the indicators of spatial dispersion. At the other end, the lowest dispersion values of migratory lows have been identiied in the RIs of Porto Alegre, Recife and Salvador. They are regional centers that still stand out for their high proportion in regional migration destinations. Part of these lows are the result of a rearrangement of the migration dynamic, including the redirection of traditional lows formerly concentrated towards the major metropolitan centers of the country, mainly São Paulo. At least in
part, these migratory lows have turned to the region itself, giving a new impetus to current intra
--regional lows.
FINAL CONSIDERATIONS
The debate about the spatial dispersion of the population has become recurrent in recent
ye-ars, due in part to the high explanatory power and the consequences inherent to the demographic
dynamics of the Brazilian population. There are many uncertainties about the prevalence of cer
-tain spatial distribution patterns of the Brazilian population. The belief in the supposed reversal of polarization or even the hypothesis of spatial de-concentration, as suggested by certain authors and proposed in the classical models of the regional economy, have proved inappropriate in the analysis of the Brazilian situation. The gradual relative decline in the economic and demographic weight of the main urban centers of the country, as well as the slowdown in population growth of the major metropolitan areas, require a deeper evaluation of new trends and patterns in the spatial distribution of the Brazilian population.
The last three decades of the previous century are central to the analysis of Brazilian popu
-lation dynamics. If the progressive decline in fertility rates was directly responsible for the sharp
slowdown in the pace of population growth in the country, internal migrations were critical in the
process of spatial redistribution of the population. Even if the metropolises and their Regions of
Inluence continue attracting signiicant contingents, the intensiication of migration lows has relected directly on the demographic growth of several urban centers outside the major Brazilian metropolitan regions, making the city network denser in each of their Regions of Inluence.
Based empirically on the stock size and population low, this paper presents an analysis of the distribution of the resident and regional migration population, with an emphasis on lows involving each of the RIs of the APCs in Brazil. The results show that there is not a general trend of increasing spatial dispersion of the population. Although the regional centers that make up the APCs cited
herein have mostly experienced a drop in the pace of population growth and losses related to spatial redistribution processes of the population they still exert high level of attraction on the population in each region. The summary table arising from the empirical results presented in this study lead
35 Finally, the possibilities and opportunities ofered to studies on the spatial mobility of the
population at the regional level are noteworthy. By providing a current picture of urban-regional organization in Brazil, the analysis of stock and lows of people assessed in the analysis established by the RIs of the APCs in the country, also allow an evaluation of the distribution of stocks and lows in a network perspective, considered either in a more speciic (urban network) sense or a broader (geographical network) one. In either case it provides an approximate summary of the relationship between the spatial distribution of population and regional organization.
ACKNOWLEDGEMENTS
The author wishes to thank the CNPq and FAPEMIG for their inancial support of the resear
-ch projects. Special mention is due to FAPEMIG for the provision of a resear-ch grant through the Pesquisador Mineiro Program.
BIBLIOGRAPHICAL REFERENCE
AZZONI, C. Indústria e reversão da polarização no Brasil. Ensaios Econômicos, São Paulo, IPE/USP, n.
58, 1986.
BRITO, F.; SOUZA, J. de. Expansão Urbana nas grandes metrópoles: o signiicado das migrações intrame -tropolitanas e da mobilidade pendular na reprodução da pobreza. São Paulo em Perspectiva, v.19, n.4, p.
48-63, out/dez. 2005.
CARVALHO, J.; RIGOTTI, J. I. R. Os dados censitários brasileiros sobre migrações internas: algumas sugestões para análise. In: XI Encontro Nacional de Estudos Populacionais da ABEP, 1998.
CHAMPION, A. G. Population Change and Migration in Britain since 1981: Evidence for Continuing Deconcentration, Environment and Planning A, October, n. 26: p.1501-1520, 1994.
CHAMPION, A. G. Recent change in the pace of population deconcentration in Britain, Geoforum, v. 18,
n. 4, p. 379-401, 1987.
DINIZ, C. C. Desenvolvimento poligonal no Brasil; nem desconcentração, nem contínua polarização. Nova Economia, Belo Horizonte, v. 31, n. 11, p. 35-64, set. 1993.
IBGE. Regiões de influênciadas cidades 2007 – REGIC 2007. Rio de Janeiro: IBGE, 2008.
LIPSHITZ, G. Spatial Concentration and Deconcentration of Population: Israel as a Case Study.
Geoforum. v. 27. N. 1, p. 87-96, 1996.
LOBO, C. Dispersão espacial da população nas Regiões de Inluência das principais metrópoles bra -sileiras. Tese (Doutorado em Geograia), Instituto de Geociências, Universidade Federal de Minas Gerais,
Belo Horizonte, 2009.
LOBO, C. et al. Expanded commuting in the metropolitan region of Belo Horizonte: evidence for reverse commuting. Revista Brasileira de Estudos Populacionais, 2015, vol.32, no.2, p.219-233.
LOBO, C. e MATOS, R. Migrações e a dispersão espacial da população nas regiões de Inluência das prin -cipais metrópoles Brasileiras. Revista Brasileira de Estudos Populacionais, 2011, vol.28, n.1, pp. 81-101.
LOBO, C. e MATOS, R. Dispersão espacial da população e do emprego formal nas regiões de inluência do Brasil contemporâneo. Cadernos Metrópole, São Paulo, v. 12, n. 24, pp. 309-330, jul/dez 2010. MARTINE, G. A redistribuição espacial da população brasileira durante a década de 80. Brasília: Ipea,
1994.
MATOS, R. Questões teóricas acerca dos processos de concentração e desconcentração da população no espaço. Revista Brasileira de Estudos de População, São Paulo, p. 35-58, 1995.
PACHECO, C. A. e PATARRA, N. Movimentos migratórios anos 80: novos padrões? In: PATARRA, N. (Org.). Migração, condições de vida e dinâmica urbana. Campinas: Unicamp, 1997, p. 25-72.
36
RICHARDSON, H. W. Polarization reversal in developing countries. The Regional Science Association Papers. Los Angeles, v. 45, p. 67-85, Nov. 1980.
RIGOTTI, J. I. R. Fluxos Migratórios e Distribuição Espacial da População na Região Metropolitana de Belo Horizonte na década de 70. 1994. 119f. Dissertação de Mestrado em Demograia - Universidade
Federal de Minas Gerais - Centro de Desenvolvimento e Planejamento Regional, Belo Horizonte. SANTOS, M. A natureza do espaço: técnica e tempo, razão e emoção. 2. ed. São Paulo:Hucitec, 1997.
SINGER, P. Economia política da urbanização. São Paulo: Hucitec, 1973.
TOWNROE, P.; KEEN, D. M. Polarization reversal in the state of São Paulo, Brazil. Journal of the Regional Studies Association. Cambridge, v. 18, n. 1, Feb. 1984.