química
www.scielo.br/ eq
Volume 35, número 3, 2010 Art igo/ Art icle
ADSORPTION ISOTHERM STUDIES OF BOD, TSS
AND COLOUR REDUCTION FROM PALM OIL MILL
EFFLUENT (POME) USING BOILER FLY ASH
IGWE, J.C.1*, ONYEGBADO C.O.2 AND ABIA A.A3.
1Department of Industrial Chemistry, Abia State University, P.M.B. 2000, Uturu, Abia State –Nigeria. 2Department of Chemical Engineering
3 Department of Pure and Industrial Chemistry, University of Port Harcourt, Choba Uniport, River State – Nigeria
*Corresponding Author E-mail: [email protected]. Phone: 234-803-675-2059
ABSTRACT: Palm oil is one of the two most important vegetable oils in the world’s oil and fats market. The extraction and purification processes generate different kinds of waste generally known as palm oil mill effluent (POME). Earlier studies had indicated the possibility of using boiler fly ash to adsorb impurities and colour in POME treatment. The adsorption treatment of POME using boiler fly ash was further investigated in detail in this work with regards to the reduction of BOD, colour and TSS from palm oil mill effluent. The amount of BOD, colour and TSS adsorbed increased as the weight of the boiler fly ash used was increased. Also, the
smal-ler particle size of 425µm adsorbed more than the 850µm size. Attempts were made to fit the
experimental data with the Freundlich, Langmuir and Dubinin-Radushkevich isotherms. The R2
values, which ranged from 0.8974–0.9898, 0.8848–0.9824 and 0.6235–0.9101 for Freundlich, Langmuir and Dubinin-Radushkevich isotherms respectively, showed that Freundlich isotherm gave a better fit followed by Langmuir and then Dubinin-Radushkevich isotherm. The sorption trend could be put as BOD > Colour > TSS. The apparent energy of adsorption was found to be 1.25, 0.58 and 0.97 (KJ/mol) for BOD, colour and TSS respectively, showing that sorption process occurs by physiosorption. Therefore, boiler fly ash is capable of reducing BOD, Colour and TSS from POME and hence could be used to develop a good adsorbent for POME treatment.
Keywords: Adsorption, Wastewater, Isotherm, Boiler fl y ash, POME.
INTRODUCTION
The palm oil is of tremendous economic and social importance in Nigeria. The palm oil in-dustry apart from being a major foreign exchange earner for Nigeria in the past has also been iden-tifi ed as a great source of water and land pollu-tion. According to Majid et al, (1999) [1], Palm oil mills produce crude palm oil and palm kernel as their main products. The milling process also generates considerable amounts of co-products/ waste such as empty fruit bunches (EFB), palm oil
The effl uent discharged from an oil mill is still objectionable and the situation in many countries is quite different and much attention has been given to the subject of effective disposal [2]. The quantity of POME produced is about 60% for every tonne of fresh fruit bunches (FFB) proces-sed [3]. Apart from the sludge water itself, which amounts to about 300 kg per tonnes of bunches milled (or about 1.5 tonnes per tonne of palm oil), there are also about 175kg of sterilizer condensate and between 40 and 140kg of effl uent from hydro cyclone or clay bath separators per tonne of bun-ches [4]. The total amount of effl uent is therefore more than half a tonne per tonne of bunches or 2.5 tonnes per tonne of oil produced in a typical mill [5]. Hence, an average of 30 tonne FFB per hour mill will generate about 18 tonnes of effl uent per hour. In milling 20 tonnes of bunches per hour, more than 200 tonnes of effl uent may be dischar-ged over 24 hours and this may contain up to a tonne of oil and 9 tonnes of dissolved or suspen-ded solids. This effl uent has a biochemical oxygen demand (BOD) of about 20,000 mg/L or 20% for 5 days, which is extremely high.
Fibre and shell are termed as by-products of the oil mill and they are used as boiler fuel to produce steam for electricity generation for the mill and domestic consumption within the mill complex. Boiler fl y ash is produced in palm oil mills from the burning of the fi ber and shell. Every tonne of FFB produces about 4kg to 6kg of boiler ash. This porous ash, which contains about 0.28% - 1.33% phosphorus, 1.02% - 4.31% potas-sium, 0.39% - 3.24% calcium and 0.29% - 2.60% magnesium [6], can be used as a soil conditioner. Currently, this under utilized waste is mainly used as landfi ll.
Adsorption of heavy metals from aqueous solution by fl y ash from palm oil mill and other sources has been reported [7-12]. In view of the maximizing waste utilization and with the pros-pect of Federal Environmental Protection Agency (FEPA) imposing more stringent BOD limits on palm oil mill, an adsorption method using boiler fl y ash may need to be introduced. Therefore, in this study, we investigated the use of boiler fl y ash for the reduction of biochemical oxygen demand (BOD), Total suspended solid (TSS) and colour
tion isotherms were used to correlate and model the adsorption studies.
MATERIALS AND METHODS
Materials
Samples of effl uent water were collected from a palm oil mill in Okigwe, Imo State Ni-geria. Boiler fl y ash was also collected from the same mill. All reagents used were of analytical re-agents grade and were used as purchased without further purifi cation.
METHODS
Sample Collection and Adsorbent Preparation
Samples of effl uent water were collected in different containers of about 5 liters in volume. The containers were properly washed and rinsed with the effl uent before collection to avoid con-tamination and dilution. The containers were la-beled showing time of collection and temperature at collection.
Boiler fl y ash was also collected from the same will. To do this, a large quantity was col-lected using polyethylene bags. The boiler fl y ash was fi rst washed with distilled water and then air--dried. The particle size distribution was deter-mined using a Fritsch sieve shaker. This properly sieved the boiler fl y ash into two particular mesh sizes of 425µm and 850µm for the purpose of the
experiment. Therefore, two samples of boiler fl y ash were obtained and placed in different sample containers and labeled according to their mesh si-zes (425µm and 850µm). The specifi c surface area
of the fl y ash was determined using the methylene blue absorption test (MBT) method described by Santamarina et al (2002) [13]. The moisture
con-tent of the sample was measured by heating the fl y ash in an oven at 135OC for two hours [1]. The fl y
ash was activated by soaking in dilute (2% v/v) HNO3, over night. It was then rinsed with distil-led water and air dried, ready for the experiments. The reason for soaking in nitric acid was to wash off soluble contaminants and activate the boiler fl y ash by opening up the pores in readiness for sorption process.
Determination of Specifi c Surface Area (SAA)
The specifi c surface area of the adsorbent was determined using the methylene blue
ab-sorption test (MBT) method [13]. 2.0g of each
adsorbent was suspended in 200mL of deionized water and 10ppm of methylene blue solution was added to the adsorbent suspension and agitated in a shaker for 2 h. There after, it was kept for 24 hr to reach equilibrium, after which 10ml aliquot was taken and centrifuged. The centrifuged ali-quot was then analyzed using a UNICAM – 87OO UV/Visible spectrophotometer to determine the amount of methylene blue that remained in solu-tion. Also, 20, 30, 40, 50, 60 and 70 ppm solutions of methylene blue were then added sequentially and the previous steps repeated. A graph of con-centration of methylene blue added versus the amount of absorbed methylene blue (not shown) was used to identify the point. The specifi c surfa-ce area was calculated from the amount of absor-bed methylene blue at the optimum point of cation replacement as follows:
Where;
mMB = Amount of methylene blue absorbed at the point of complete cation replacement.
Ms = Mass of adsorbent
Av = Avogadro’s number, 6.02 x 10²³
AMB =Area covered by one methylene blue (as-sumed to be 130Å2)
Sorption Experiments
Effect of weight of fl y ash
The adsorption experiments were con-ducted in a batch system by preparing various amounts of fl y ash (10, 30, 40 and 60g) of the two different mesh sizes in series of 300ml ter. The various mixtures of fl y ash and wastewa-ter were allowed to stand with continuous stirring for 60 mins contact time, at a constant temperatu-re of 30oC and pH of 6.4. After the contact time
of 60 mins had elapsed, the mixture was centrifu-ged at 3000 rpm and the supernatant analyzed for BOD, TSS, colour and pH by the same methods described below.
A control sample was prepared by fi ltering the wastewater without the fl y ash. The fi ltrates were then analyzed for BOD, TSS, and colour as described later. The reductions of these parame-ters as consequence of adsorption were calculated by difference in the initial concentrations and that remaining in the fi ltrates.
Effect of Initial Concentration
To investigate the effect of initial concen-tration of the wastewater on the adsorption pro-cess, various initial concentrations were obtained by diluting the wastewater with distilled water. Initial concentrations of 10%, 30%, 40%, 50%, 60% and 70% were used. 30 grams of the boiler fl y ash of 800µm size was put into 300ml wastewater
Analyses of Various Parameters
The pH of the solution was determined using pH meter (HACH 51750 – 60) [14]. The pH meter was fi rst standardized using a buffer solu-tion of about 7.0 and then the other solusolu-tions were analyzed for their various pH values.
All samples were analyzed for the other pa-rameters as described in the standard methods for the Examination of water and wastewater [15] and standard methods for water and effl uents analysis [16].
RESULTS AND DISCUSSION
The particle sizes of the fl y ash used were 450µm and 850µm. The specifi c surface area of the boiler fl y ash calculated from the methylene blue absorption test method was 241.4m2g-1 for
Figure 2: Influence of adsorbent dosage for adsorption of Colour (Hz), TSS (mg/g) and BOD
(mg/g) from palm oil mill effluent using boiler
fly ash of particle size 850μm.
0 200 400 600 800 1000 1200
0 20 40 60 80
Wt (g) of adsorbent
A
m
ount
a
ds
or
be
d
Colour
TSS
BOD
850µm and 280.6m2g-1 for 425µm. The fl y ash
was found to have moisture content of 1.7%.
Sorption Capacity
The experimental results for the adsorpti-ve removal of BOD, colour and TSS using boiler fl y ash are presented. The pH of the palm oil mill effl uent was found to be 6.4. The amount adsorbed was calculated from equation (2) below:
here qe is the amount adsorbed in mg/g for BOD and TSS and in Hz for colour adsorption; Co is the initial concentration and Ce is the residual amount (concentration) after sorption process
Figure 1 shows the amount adsorbed for BOD, colour and TSS from POME as weight (g) of boiler fl ay ash was varied for particle size of 425µm, while that for particle size of 850µm is
shown on Figure 2.
Figure 1: Influence of adsorbent dosage on adsorption of Colour (Hz), TSS (mg/g), and BOD
(mg/g) from palm oil mill effluent using boiler
fly ash of particle size 425μm.
0 500 1000 1500 2000 2500
0 20 40 60 80
Wt (g) of Bioler fly ash
A
m
ount
a
ds
or
be
d
Colour TSS
BOD BOD, both for 425From these fi gures, it can be seen that for µm and 850µm sizes of boiler
fl y ash, the amount adsorbed increased steadily as the weight of fl y ash was increased. For TSS there are little changes and for colour (850 m particle size), the amount sorbed decreased as the amount of fl y ash increased. Also, it can be seen that par-ticle size of 425µm gave higher sorption capacity than particle size of 850µm.
The amount adsorbed as initial concentra-tion increased for TSS, BOD and colour is shown on Figure 3. In each case, the amount adsorbed increased as the initial concentration of each of the parameters increased. The amount of BOD adsorbed was higher followed by colour and then TSS. The linear regression equations for each of the parameters and the regression coeffi cient are shown as equations 3, 4, and 5 for BOD, colour and TSS respectively. It could be seen that all the R2 values are high showing good correlation. The
R2 value for TSS was highest, followed by BOD
Figure 3: Influence of initial Concentration on adsorption of TSS (mg/g), Colour (Hz) and BOD
(mg/g) from Palm oil mill Effluent using Boiler
fly ash of 850μm particle size
0 200 400 600 800 1000 1200 1400 1600 1800
0 10000 20000 30000 40000 50000
Initial concentration
A
m
ount
a
ds
or
be
d
TSS
Colour
BOD
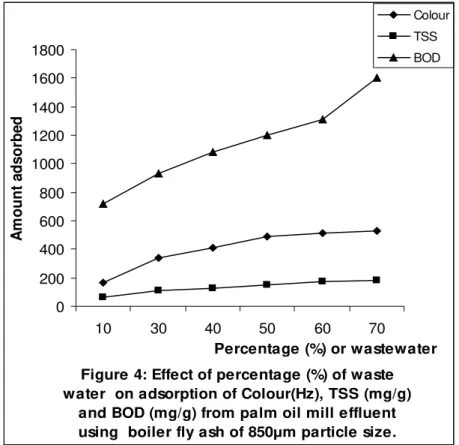
Figure 4: Effect of percentage (%) of waste water on adsorption of Colour(Hz), TSS (mg/g)
and BOD (mg/g) from palm oil mill effluent
using boiler fly ash of 850μm particle size.
0 200 400 600 800 1000 1200 1400 1600 1800
10 30 40 50 60 70
Percentage (%) or wastewater
A
m
o
u
n
t ad
so
rb
ed
Colour
TSS
BOD
The amount adsorbed against the percenta-ge of wastewater for BOD, colour and TSS from palm oil mill effl uent using boiler fl y ash is sho-wn on Figure 4. It could be seen that the amount adsorbed increased as percentage of wastewater was increased. The amount of BOD adsorbed was highest, followed by colour and then TSS.
In all, it is clear that the boiler fl y ash was capable of reducing the concentrations of BOD, TSS and colour from palm oil mill effl uent (POME). The adsorptive removal of these conta-minants could be explained based on the modes of sorption of materials or contaminants on ab-sorbents. The adsorptive removal of contaminants could be attributed to two main terms; intrinsic adsorption and coulombic interaction [17]. The coulombic term results from the electrostatic energy of interactions between the adsorbents and adsorbates. It can also be observed from the ad-sorption of cationic species versus anionic species on adsorbents [17]. The intrinsic adsorption of the materials is determined by their surface areas, which can be observed by the effect of different sizes of adsorbents. The smaller particle size of 425µm has a higher adsorption. Also, both factors
can interact, thereby infl uencing the adsorption capacity. The specifi c surface area (SAA) of an ad-sorbent is the ratio of its surface area to its mass [18]. It has been reported that the surface area has
a great effect on the sorption capacities of adsor-bent [19]. Thus, increase in specifi c surface area increases sorption capacity.
wa-stewater. Also, it has a fi xed range of values, that is, the pH scale.
Sorption Isotherm
When an adsorbent is in contact with the surrounding fl uid of a certain composition, ad-sorption takes place and after a suffi ciently long time, the adsorbent and the surrounding fl uid rea-ch equilibrium. Generally, an adsorption isotherm is an expression or diagram, which provides in-formation about the fraction of a surface that is covered by adsorbed molecules in equilibrium at constant temperature as a function of pressure or concentration [20]. Adsorption isotherms are des-cribed in many mathematical forms, some of whi-ch are based on a simplifi ed physical picture of adsorption and desorption, while others are purely empirical relationship intended to correlate the experimental data in simple equation with two or at most three empirical parameters, the more the number of empirical parameters, the better the fi t between experimental data [21]. Three isotherms; Freundlich, Langmuir and Dubinin–Radushkevich isotherms were chosen to analyze the adsorption process. The Freundlich and Langmuir isotherms are the earliest and simplest known relationships.
The Freundlich isotherm model was chosen to estimate the adsorption intensity. It is an empirical equation after Freundlich in 1926, used to describe the isotherm data by;
Where KF and n are empirical constants [22].
Equation (6) may be linearized by taking logari-thms as follows:
Where;
KF = Constant in Freundlich isotherm n = Freundlich exponent
Ce = Equilibrium liquid phase concentration Qe = Equilibrium solid phase concentration
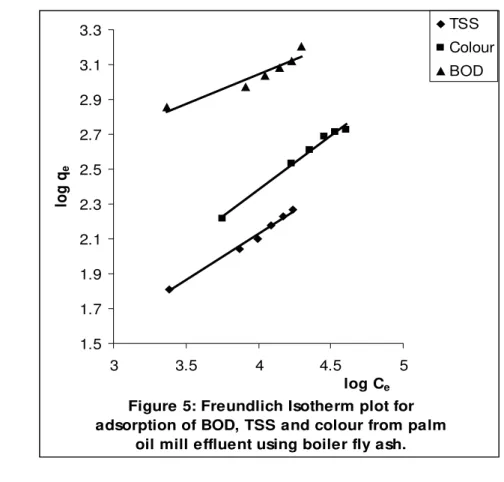
The plot of log Qe against log Ce is linear and constants KF and n were evaluated from the intercepts and slopes respectively. The Freundli-ch isotherm plots are shown on Figure 5 for TSS, BOD and colour. The regression equations and the
coeffi cient of regression (R2) are shown as
equa-tions 8, 9 and 10 for BOD, Colour and TSS res-pectively.
Figure 5: Freundlich Isotherm plot for adsorption of BOD, TSS and colour from palm
oil mill effluent using boiler fly ash.
1.5 1.7 1.9 2.1 2.3 2.5 2.7 2.9 3.1 3.3
3 3.5 4 4.5 5
log Ce
log q
e
TSS Colour
BOD
From these equations and R2 values, it
could be seen that the Freundlich equation gave a very good fi t to the adsorption process. With R2
value of 0.9898 for colour reduction, which is the highest, it means that the Freundlich isotherm fi ts the adsorption of colour more, followed by TSS and then BOD. The values of the Freundlich cons-tants KF and n were generated and are shown on Table 1. The Freundlich exponents (1/n) are all less than one showing that signifi cant adsorption takes place at low concentration but the increase in the amount adsorbed with concentration beco-mes less signifi cant at higher concentration and vice versa [22]. Also, KF and n determines the cur-vature and steepness of the isotherm [23]. Thus, the higher the KF value, the greater the adsorption
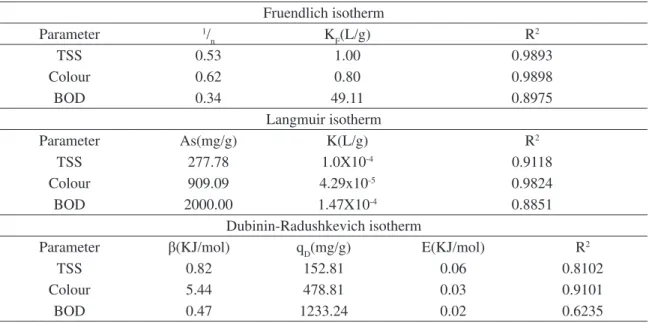
TABLE 1. Adsorption isotherm constants for Freundlich, Langmuir and Dubinin-Radushkevich isotherm for adsorption of BOD, Colour and TSS using boiler fl y ash.
Fruendlich isotherm
Parameter 1/
n KF(L/g) R
2
TSS 0.53 1.00 0.9893
Colour 0.62 0.80 0.9898
BOD 0.34 49.11 0.8975
Langmuir isotherm
Parameter As(mg/g) K(L/g) R2
TSS 277.78 1.0X10⁻⁴ 0.9118
Colour 909.09 4.29x10⁻⁵ 0.9824
BOD 2000.00 1.47X10⁻⁴ 0.8851
Dubinin-Radushkevich isotherm
Parameter β(KJ/mol) qD(mg/g) E(KJ/mol) R2
TSS 0.82 152.81 0.06 0.8102
Colour 5.44 478.81 0.03 0.9101
BOD 0.47 1233.24 0.02 0.6235
Figure 6: Langmuir Isotherm plot for adsorption of TSS, colour and BOD from palm oil mill effluent using
boiler fly ash
0 20 40 60 80 100 120
0 10000 20000 30000 40000 50000
Ce Qe
/Ce
TSS
Colour
BOD
The essential characteristics of the Langmuir isotherm can be expressed in terms of a dimensio-nless constant separation factor or equilibrium parameter, RL, which describes the type of isotherm [26] and is defi ned by the equation (11);
Where, Co is the initial concentration of the parameter. The parameter RL shows the shape of the isotherm according to Table 2. The RL values were calculated and plotted as shown on Figure 7. The
values of RL range from 0.2422 to 0.6911 of BOD; 0.3647 to 0.8009 for colour and 0.3636 to 0.8000
for TSS at various initial concentrations. From Figure 7, it means that the sorption process is favourable because the values lie between zero and one.
TABLE 2. R2 values and isotherms
RL values Type of isotherm
RL >1 Unfavourable
RL= 1 Linear
O<RL < 1 Favourable
RL=O Irreversible
The Langmuir equation was chosen for the estimation of maximum adsorption capacity cor-responding to complete monolayer coverage on the adsorbent surface. The Langmuir isotherm is represented by the following equation [24];
The linearized form of equation (11) could be written as;
Where;
Ce is the equilibrium concentration of the parameter; qe is the amount of parameter adsor-bed. The constants KL and aL are the Langmuir constant (L/g) and Langmuir isotherm constant (L/mg), respectively. The ratio of aL/KL represents the maximum adsorption capacity, Qmax. Another form of the Langmuir equation [25], shown below was used to model the adsorption data.
Where As is the sorbent binding capacity and K is the binding constant. The plots of Ce/ Qe against Ce gave straight lines and are shown
on fl y ash. The regression equations and the line-ar coeffi cient of regression (R2) are shown on the
plots. The plots and the R2 values show that the
Figure 7: Dimensionless separation factor (RL)
against initial concentration for BOD,Colour and TSS adsorption on boiler fly ash.
0 0.1 0.2 0.3 0.4 0.5 0.6 0.7 0.8 0.9
0 10000 20000 30000 40000 50000
Initial Concentration
RL
TSS
Colour
BOD
Figure 8: Dubinin-Radushkevich Isotherm plot for adsorption of TSS, colour and BOD from palm oil
mill effluent using boiler fly ash
0 1 2 3 4 5 6 7 8
0 0.5 1 1.5
[RT ln (1+1/Ce)]2
ln
q
e
TSS Colour
BOD
The Dubinin-Radushkevich isotherm was chosen to estimate the characteristic porosity of the fl y ash and the model is represented by equa-tion (15) [27];
Where β is related to the free energy of sorption per mole of the sorbate as it migrates to the surface of the adsorbent from infi nite distance in the solution and qD is the Dubinin – Radushke-vich isotherm constant related to the degree of sorbate sorption by the sorbent surface. The linear form of equation (15) is given as;
ln qe = ln qD - β 2 (16)
Where, is the Polanyi potential [28,29] which is related to the equilibrium concentration as;
= RT ln (1+1/Ce) (17)
The plots of ln qe against [RT ln (1 + 1/ Ce)]2 gave fairly straight lines and are shown on
Figure 8 for TSS, BOD and colour adsorption on fl y ash. The Linear regression equations and R2
values show that the isotherm model does not des-cribe BOD and TSS removal process very well (Table 1). The apparent energy of adsorption from the Dubinin–Radushkevich isotherm model can be computed using the relationship [27],
From the Dubinin–Radushkevich isotherm, the values of qD, which is related to the degree of sorbate sorption, shows that BOD has a higher value (1233.24), followed by colour (478.81) and then TSS (152.81). This also shows that the trend of sorption is BOD > colour > TSS. Also, from the value of β, the apparent energy (E) of adsorp-tion was calculated. The values of the energy 0.06, 0.03 and 0.02 (KJ/mol) for TSS, colour and BOD respectively showed that the sorption of BOD, co-lour and TSS are physiosorption process. This is because the values obtained are within the range for physiosorption. Thus, what takes place is phy-sical sorption without chemisorptions. The values of the Dubinin–Radushkevich isotherm constants are also shown on Table 1, with the R2 values and
the apparent energy of adsorption.
CONCLUSION
determina-tion (R2) for the three isotherms, we can compare
their fi tness to the experimental data as Freundlich > Langmuir > Dubinin-Radushkevich. From the results of this study, it means that boiler fl y ash can be used as an adsorbent to further reduce the con-centration of BOD, colour and TSS from POME. Therefore, because boiler fl y ash is a waste in the palm oil industry, this is a good step in the right direction to industrial waste management.
REFERENCES
[1] R.A. Majid, A.N Ma and E. Hisham, Palm Oil Research Institute of Malaysia (PORIM) Bulletin, 39, (1999), 1-47. [2] C.N.S. Hartley, The Oil palm. 3rd Ed. Longman Scientific and Technical U.K., (1988), pp. 14-17.
[3] B.J. Wood, A. review on current methods of dealing with palm oil mill Effluent, Malaysia University Press, Kuala Lumpur, (1989), pp. 19-32.
[4] A.N. Ma, Y Tajima, M. Asahi and J. Hannif, Palm Oil Research Institute of Malaysia (PORIM) Technology, 19, (1996), 1-8.
[5] K.L.Hoe and A.M. Dam, System for palm oil mil effluent Treatment, Ministry of primary industries in Malaysia, (1981), pp. 177-182.
[6] A.M. Rusnani and A.N. Ma, Physical properties of Boiler fly ash from various palm oil mill. PORIM Bulletin 38, (1999), 14-19.
[7] C.B. Behr-Andres and J.N. Hutzler, Journal of Environmental Engineering, 120 (6), (1994), 1488-1506. [8] M.A. Hashim, K.H. Chu, R. Chitgupa and A.N. Ma, Adsorption of copper by fly ash obtained from oil palm waste: paper presented at the 6th J.S.PS-VCC Seminar, Kyoto University Kyoto, Japan, 27-28 November, (1996).
[9] A. Mathur and D.C. Rupainwar, Asian Environ. 10(3), (1988) 19-25.
[10] K.K. Panday, G.U.R. Prasad, and V.N. Singh, Water Res. 19 (17), (1985), 873.
[11] T.T. Theis, and Wirth, J.L. Environ. Sci. and Technol., 11(12) (1977), 1096-1100.
[12] C.H. Weng and C.H. Huang, Journal of Environmental Engineering, 120 (6), (1994), 1470-1487.
[13] J.C. Santamarina, Klein; Y.H. Wang and E. Prencke, Can. Geotech. J. 39, (2002), 233-241.
[14] J.C. Igwe. Treatment of palm oil mill Effluent (POME) using Boiler fly ash. M.Eng. Thesis, Department of Civil and Environmental Engineering, University of Port Harcourt, River State Nigeria, (2008), pp. 1-163.
[15] APHA, Standard methods for the Examination of water and wastewater. 16th Edition. American Public Health
[16] C.M.A. Ademoroti, Standard methods for Water and Effluents Analysis. Foludex Press Ltd. Ibadan, (1996), pp 44-54.
[17] S. Gang and S. Weixing. Ind. Eng. Chem. Res., 37(4), (1998), 1324-1328.
[18] A.A. Abia, and E.D. Asuquo. Afr. J. Biotechnol., 5(16), (2006), 1475-1482.
[19] R. Qadeer and S. Akhtar. Turk. J. Chem., 29, (2005), 95-99.
[20] W.J. Moore. Basic Physical Chemistry. Prentice-Hall Inc. Eagle Wood U.S.A, (1986), p. 319.
[21] Motoyuki, S. Adsorption Engineering, Elsevier Sci. Publishers, (1990), pp. 5-61
[22] T. Hsisheng and H. Chien-To. Ind. Eng. Chem. Res., 37(9), (1998), 3618-3624.
[23] A. Akgerman and M. Zardkoohi. J. Chem. Eng. Data, 41, (1996), 185-191.
[24] I. Langmuir. J. Am. Chem. Soc. 38, (1916), 2221. [25] C.A. Eligwe, C.I.A. Nwoko and U.U. Egereonu. J. Chem. Soc. Nig., 24, (1999), 70-76.
[26] N. Ahalya, R.D. Kanamadi and T.V. Ramachandra. Electronic J. Biotechnol., 8(3), (2005), 258-264.
[27] M. Horsfall Jnr; A.I. Spiff and A.A. Abia. Korean Chem. Soc., 25(7), (2004), 969-976.
[28] A. Sari, M Tuzen, O. D.Uluozlu and M. Soylak. Biochem. Eng. J., 37, (2007), 151-158.