AR
TICLE
1 Laboratório de História, Políticas Públicas e Saúde na Amazônia, Fundação Oswaldo Cruz. R. Terezina s/n, Adrianópolis. 69065-001 Manaus AM Brasil. [email protected] 2 Faculdade de Educação Física e Fisioterapia, Universidade Federal do Amazonas. Manaus AM Brasil.
3 Escola Nacional de Saúde Pública, Fiocruz. Rio de Janeiro RJ Brasil. 4 Programa de Pós-Graduação em Saúde Coletiva, Universidade Federal do Rio Grande do Sul. Porto Alegre RS Brasil.
Primary Health Care in Brazil and the
Mais Médicos
(More Doctors) Program: an analysis of production indicators
Abstract This study analyzes the number of
medical appointments and referrals performed in primary health care in Brazil focusing on the Mais Médicos Program (More Doctors Program). It is a cross-sectional study on the work of physicians included, or not, to the Mais Médicos Program in 2014. Based on validation protocols, a unified database was created from two health informa-tion system databases – SIAB and ESUS. Abso-lute indicators were defined: the total of medical appointments per month; medical referrals and community health education activities. In ad-dition, other indicators were considered, such as weekly rates and productivity of appointments, in line with the profile of Brazilian municipali-ties. The mean of all appointments was 285 per month corresponding to an average of 14.4 ap-pointments/day. In the poorest municipalities, the figures for the Mais Médicos Program physicians were higher than national rates. The education-al activities provided by primary care teams that included a Mais Médicos Program professional were higher in Brazilian capital cities. The Mais Médicos Program achieved one of its main goals, which was to increase health access for vulnerable populations and to contribute towards the consol-idation of primary health care in Brazil.
Key words Primary health care, Mais Médicos
Program, Unified Health System, Health Evalu-ation, Indicators
Rodrigo Tobias de Sousa Lima 1
Tiotrefis Gomes Fernandes 2
Antônio Alcirley da Silva Balieiro 1
Felipe dos Santos Costa 1
Joyce Mendes de Andrade Schramm 3
Julio Cesar Schweickardt 1
Lima R Introduction
Primary health care has been responsible for or-ganizing access to health services in Brazil1 and for government programs, such as the Mais Médi-cos Program (More Doctors Program), which were designed with the aim of expanding cov-erage for the population and re-directing health practices2. The federal government’s initiative in creating the Mais Médicos Program involves a policy to develop and strengthen the Unified Health System (SUS). This policy was established as a result of the need to expand primary health throughout the whole country, which faced enormous difficulties, in finding professionals, especially physicians, both to work and to settle in remote areas3,4. Based on this perspective, the Federal government, by means of incentives de-signed to overcome the inequalities/unfairness in health care, has been directing its efforts towards ensuring that local demands are met, bearing in mind the continental dimensions of the country and the fair distributions of human and materi-al resources, that prioritize providing emergency medical primary health care in vulnerable areas, including those municipalities located in the in-terior of the country, in the outskirts of great ur-ban centers and in metropolitan regions, as well as in isolated regions such as the Amazon2,5.
Many studies have registered the extended access6-10, coverage11,12 and performance13,14 of the Family Health Strategy (FHS) in Brazil as a whole, although few studies have so far been con-ducted into the professional-outpatient produc-tion in relaproduc-tion to primary care resulting from the deployment of the Mais Médicos Program over the last three years. This being the case, it is important to understand the contribution this Program has made to ensure Brazilians have ac-cess to health services, as regards medical-care as-sistance for the health needs of the population in relation to primary health care work. In addition, it is necessary to analyze in detail access to health services within the parameters of a physician’s productivity in primary health care. Thus, this study aims to analyze the production of medi-cal appointments and referrals and educational health activities carried out in primary health care in Brazil by Family Health Strategy (FHS) teams in 2014, with special emphasis on the Mais Médicos Program.
Method
This is a cross-sectional study about medical work production rates in Brazilian primary care, from the time when the Mais Médicos Program was first established until 2014, a period that saw the entry of the third wave of professionals and the consolidation of this program in the country. The case study unit of analysis was the monthly production of the family health strategy teams with and without a professional from the Mais Médicos Program, whose working regime was a forty-hour week.
The analyses conducted used secondary data used by the Unified Health System: Primary Health Care Information System (SIAB), consid-ering tables for “Production”; “SSA2,” “Addition-al,” “sanitation,” as well as the SUS electronic da-tabase (E-SUS), made available via the Ministry of Health’s Primary Health Care Department. In order to consult this set of data, the ‘PHPMyAd-min’ free language web application was used, together with the MySQL database. An order of system provenance was established: starting with the SIAB and followed by the E-SUS. The key link that made it possible to complete this stage was the set of tables consisting of the municipal codes, health unit codes, coverage area codes and, finally, the year and month of production shown in the databases in question. A dichotomous variable was created based on the unification of the databases, so as to identify the monthly pro-duction of the team that did or did not include a professional from the Mais Médicos Program.
An inter-institutional scientific network was formed for the purpose of this research, which conducted meetings with the technical body at the Ministry of Health (MOH), workshops and regional meetings, in order to establish the pro-duction indicators that best express the work of a professional physician. For this, the study vari-ables were as follows: the total number of med-ical consultations per month - the sum total of consultations conducted with children, adoles-cents, adults and the elderly, as part of the pro-grams involving patients with hypertension and diabetes, leprosy and tuberculosis - the number of medical referrals made for specialist, emergen-cy and hospital treatment, the number of educa-tional health activities per FHS team, as well as the creation of rates for these variables.
e C
ole
tiv
a,
21(9):2685-2696,
2016
data related to primary health care. Total vari-ables and consultation rates were not considered during this stage: a) the monthly production of the team that presented a repeated production of equal value (including those with zero scores) for three consecutive months and/or during a pe-riod of four months over the course of the year 2014, accepting criteria that are more restricted than those foreseen in the resolution that advis-es the suspension of funding for those munici-palities that do not produce data for a period of 60 days1,15; b) production related to indige-nous areas. Also, for the ‘total number of medi-cal consultations,’ the criterion was the number of consultations from zero up to 640 consulta-tions, acknowledging the realistic possibility that a professional can receive thirty-two patients a day or twice the normal operating capacity per month. Thus, a proportion of 50.8% of the total number of medical appointments were analyzed. With regards to the variables for ‘team educa-tional services for groups,’ ‘medical referrals for specialist treatment,’ referrals for ‘hospitals’ and ‘emergencies,’ a number equal to zero or higher was accepted for the year 2014, since the aim of the study was to find out the proportion of some of the team mandatory reporting (categorical data), as well as the summary measures for these variables, when different from zero. Also, this be-ing the case, a proportion of 2.2%, 1%, 2.1% and 1.9%, respectively, of all the educational referrals and consultations, was eliminated from the anal-ysis. In order to be able to make a comparison between the two groups, rates of the same vari-ables were constructed, these being absolute val-ues related to the number of consultations, of re-ferrals and educational services provided and the denominators of the total population covered by the team during that month. Variable rates were also used for each variable, in that the denomina-tor was the number of individuals registered at the FHS multiplied by one thousand. For these rates, the criterion used was that the number of individuals registered should be between 2,000 and 6,000 per team, allowing for the extreme situations that occur in FHS designated areas, which have low and high demographic density, as is the case of Amazonas and in the major capital cities, respectively.
In addition, the ‘weekly production’ variable was created, which represents the total number of medical consultations in relation to the week-ly working hours of the FHS teams. For this, 32 and 40 hours per week were contemplated for the teams that did or did not have a Mais Médicos
Program professional, respectively. In the case of the teams that included a Mais Médicos Program professional, the remaining 8 hours would be employed for the purpose of study by undertak-ing an on-line course, in accordance with present legislation5. The municipalities and regions of the country defined as having a deficient health care profile, in line with the principles of equity ethics, in accordance with Inter-ministerial De-cree No. 1,369, of 8th July 2013, which defines priority SUS regions as those that are “of diffi-cult access, where it is diffidiffi-cult to provide physi-cians or where the populations are considered to be in a situation of greatest vulnerability”16. The criteria adopted were therefore as follows: a) To include municipalities that had 20% or more of their population living in extreme poverty based on data issued by the Brazilian Ministry of So-cial Development and Campaign to Eradicate Hunger, which can be accessed via www.mds. gov.br/sagi; b) To be one of the 100 municipal-ities (G100) with over 80 thousand inhabitants and with the worst human development indices (HDI); c) censor sector areas of extreme poverty that afflicts metropolitan regions so badly; d) as well as the outskirts of capital cities; e) in addi-tion, other locations, that are part of the remain-ing municipalities.
The following software was used: R and SPSS version 22.0 for Windows. Since there was no standard of normality or symmetry for the vari-ables between the groups, and because this in-volves a large number of samples, the statistical analysis was based on a calculation of 95% con-fidence medians and intervals (CI 95%). Pear-son’s Chi-Square test was used for categorical variables and the significance level adopted was 5%. Graphs showing tendencies were construct-ed, bearing in mind the average productivity of the total number of consultations for both types of teams (with and without a Mais Médicos Pro-gram professional). This study was approved by the Research Ethics Committee at the Federal University of Rio Grande do Sul.
Findings
anal-Lima R ysis. This represents a loss of 49.2% of the total
number of medical consultations, in that there was a greater loss of information from teams in poorer areas (55.1%) and a lower loss in capital cities (40.4%). Thus, the study analyzed a total of 68,876,670 monthly productions, of which 79.5% were produced by the Non-Mais Médicos Program professionals and 20.5% by the Mais Médicos Program professionals, of the 23,321 teams belonging to the 4,231 municipalities in Brazil.
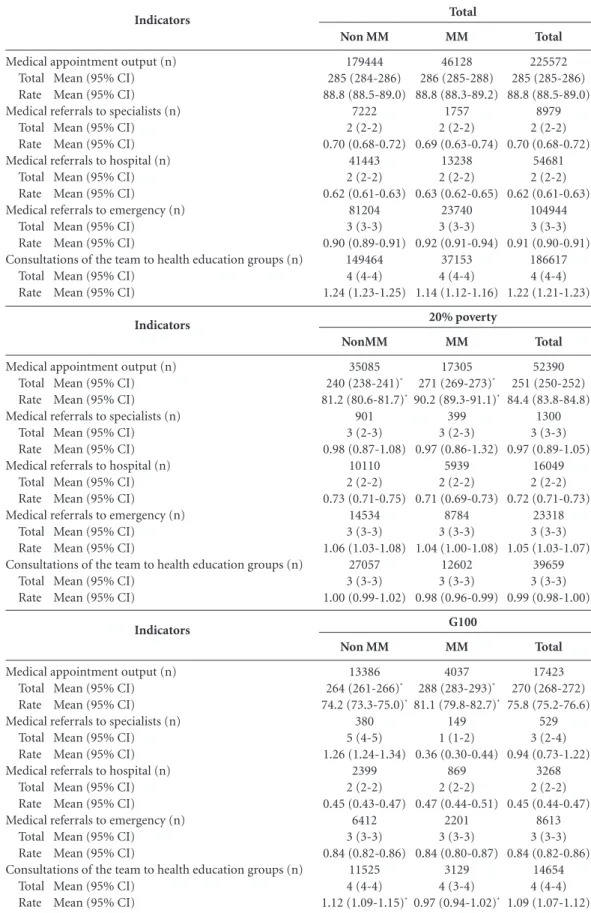
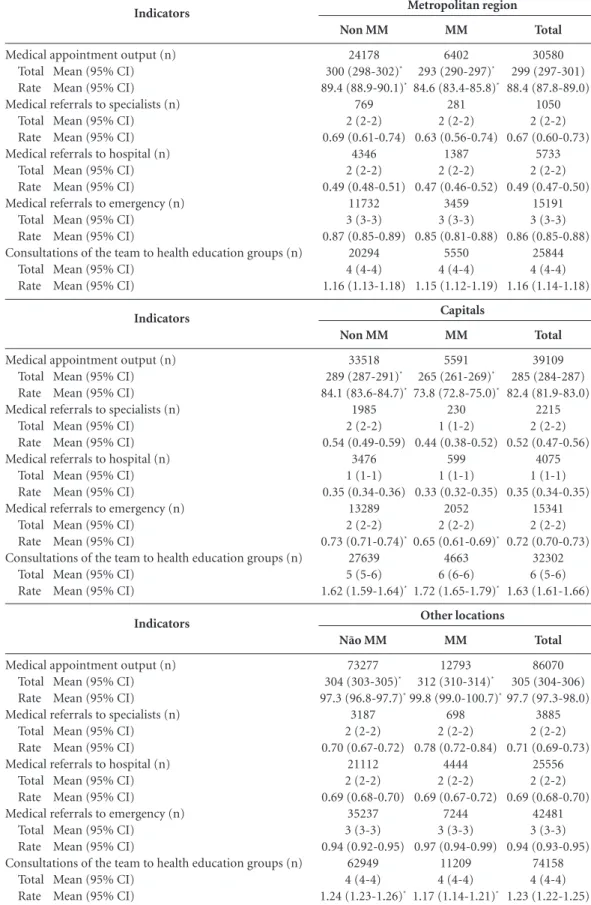
The results of the analyses conducted at a municipal level are shown on Tables 1 and 2 and in Figure 1.
The median of the total number of medical appointments produced in Brazil was 285 (CI 95%: 284-286) per month in 2014, which indi-cates an average of 14.4 appointments per day. These findings indicated a differentiated stan-dard in relation to the groups of municipalities studied, based on a comparison with the na-tional average. The median of the total number of medical consultations was lower in poorer regions and, in relation to the relative values of the registered population, municipalities with a low Human Development Index presented lower rates overall, if compared to the national median. Among the groups of teams, the Mais Médicos produced more in poorer regions, less HDI in other localities and less in metropolitan regions and in capital cities. It is worth mentioning that in the poorer municipalities, the Mais Médicos teams produced 31 more medical consultations per month and 24 fewer medical consultations per month in capital cities, when compared to the Non-Mais Médicos Program professionals.
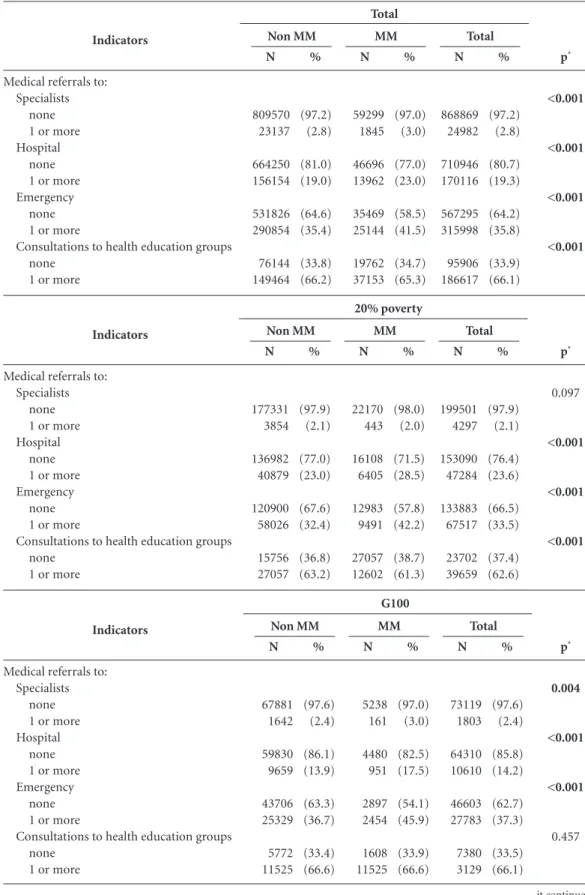
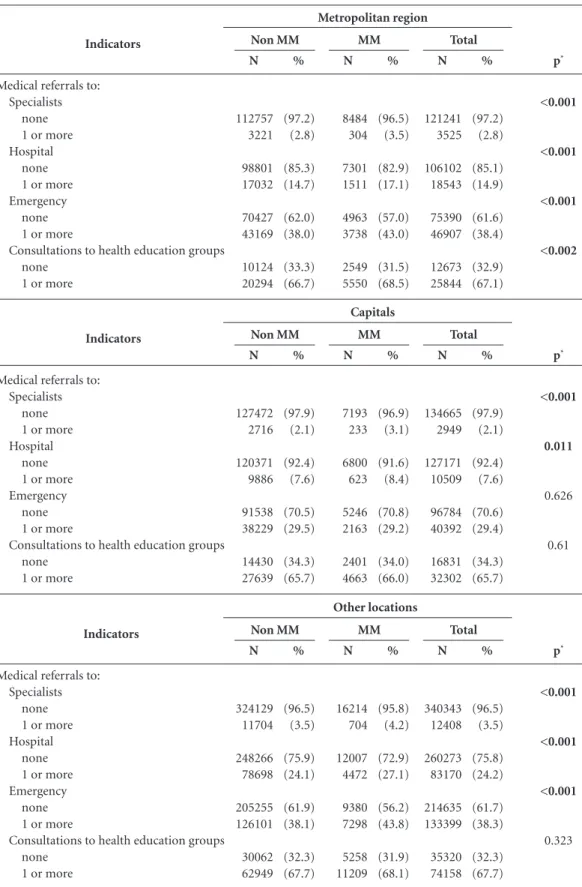
With regards to referrals to a specialist, hos-pital and emergency in Brazil, it was found that there had been 97.2%, 80.7%, and 64.2%, respec-tively, of non-referrals in this sampling. The Mais Médicos teams presented a significantly higher proportion of some type of referral to a spe-cialist, hospital and emergency in Brazil, except to specialists in the poorer regions and to emer-gency units in capital cities (Table 2). It may be observed in Table 1 that, assuming that the team has at least one referral for each particular vari-able, in general the medians and CI of referrals to a specialist, hospital and emergency involving the FHS was 2 (CI 95%: 2-2), 3 (CI 95%: 3-3) and 4 (CI 95%: 4-4), respectively. There was a significant difference in referrals made depend-ing on the different teams involved. With regards to the Mais Médicos Program, real differences in the mean were found only in the case of
special-ist referrals in capital cities, with the Non-Mais Médicos teams presenting higher values.
With respect to FHS team services to health educational groups, the whole sample showed 33.9% from zero care cases during the months of 2014. The greatest proportion of non-treat-ment for a Mais Médicos team was found among the poorest municipalities and where there was a higher proportion of Non-Mais Médicos teams between municipalities in the metropolitan re-gion, with no significant difference in the other categories (Table 2). Given that the team had registered at least one service (Table 1), the mean for serving the health educational group in the country was 4 (CI 95%: 4-4) per month - with a higher mean for capital cities (6; CI 95%: 5-6) and a lower one for poorer districts (3; CI 95%:3-3). Despite the significant statistical differences shown in Table 1 in relation to the Mais Médicos Program, in the case of this variable there was only a real difference in the mean between capital cities, where the Mais Médicos team performed more educational activities.
Figure 1 shows that the productivity of the total number of appointments per week pres-ents a similar pattern between the different teams during the course of the year, with lower averages for the month of December. It may also be ob-served that the Mais Médicos teams had greater weekly productivity, in comparison with the Non-Mais Médicos team during the course of the whole year, irrespective of the municipal category.
Discussion
e C
ole
tiv
a,
21(9):2685-2696,
2016
Table 1. Monthly medical and family health team output indicators, in accordance with the Brazilian municipal
profile in the year 2014.
it continues
Total
225572 285 (285-286) 88.8 (88.5-89.0)
8979 2 (2-2) 0.70 (0.68-0.72)
54681 2 (2-2) 0.62 (0.61-0.63)
104944 3 (3-3) 0.91 (0.90-0.91)
186617 4 (4-4) 1.22 (1.21-1.23) Indicators
Medical appointment output (n) Total Mean (95% CI) Rate Mean (95% CI) Medical referrals to specialists (n)
Total Mean (95% CI) Rate Mean (95% CI) Medical referrals to hospital (n)
Total Mean (95% CI) Rate Mean (95% CI) Medical referrals to emergency (n)
Total Mean (95% CI) Rate Mean (95% CI)
Consultations of the team to health education groups (n) Total Mean (95% CI)
Rate Mean (95% CI)
Non MM
179444 285 (284-286) 88.8 (88.5-89.0)
7222 2 (2-2) 0.70 (0.68-0.72)
41443 2 (2-2) 0.62 (0.61-0.63)
81204 3 (3-3) 0.90 (0.89-0.91)
149464 4 (4-4) 1.24 (1.23-1.25)
MM
46128 286 (285-288) 88.8 (88.3-89.2)
1757 2 (2-2) 0.69 (0.63-0.74)
13238 2 (2-2) 0.63 (0.62-0.65)
23740 3 (3-3) 0.92 (0.91-0.94)
37153 4 (4-4) 1.14 (1.12-1.16)
Total
Total
52390 251 (250-252) 84.4 (83.8-84.8)
1300 3 (3-3) 0.97 (0.89-1.05)
16049 2 (2-2) 0.72 (0.71-0.73)
23318 3 (3-3) 1.05 (1.03-1.07)
39659 3 (3-3) 0.99 (0.98-1.00) Indicators
Medical appointment output (n) Total Mean (95% CI) Rate Mean (95% CI) Medical referrals to specialists (n)
Total Mean (95% CI) Rate Mean (95% CI) Medical referrals to hospital (n)
Total Mean (95% CI) Rate Mean (95% CI) Medical referrals to emergency (n)
Total Mean (95% CI) Rate Mean (95% CI)
Consultations of the team to health education groups (n) Total Mean (95% CI)
Rate Mean (95% CI)
NonMM
35085 240 (238-241)*
81.2 (80.6-81.7)*
901 3 (2-3) 0.98 (0.87-1.08)
10110 2 (2-2) 0.73 (0.71-0.75)
14534 3 (3-3) 1.06 (1.03-1.08)
27057 3 (3-3) 1.00 (0.99-1.02)
MM
17305 271 (269-273)*
90.2 (89.3-91.1)*
399 3 (2-3) 0.97 (0.86-1.32)
5939 2 (2-2) 0.71 (0.69-0.73)
8784 3 (3-3) 1.04 (1.00-1.08)
12602 3 (3-3) 0.98 (0.96-0.99)
20% poverty
Total
17423 270 (268-272) 75.8 (75.2-76.6)
529 3 (2-4) 0.94 (0.73-1.22)
3268 2 (2-2) 0.45 (0.44-0.47)
8613 3 (3-3) 0.84 (0.82-0.86)
14654 4 (4-4) 1.09 (1.07-1.12) Indicators
Medical appointment output (n) Total Mean (95% CI) Rate Mean (95% CI) Medical referrals to specialists (n)
Total Mean (95% CI) Rate Mean (95% CI) Medical referrals to hospital (n)
Total Mean (95% CI) Rate Mean (95% CI) Medical referrals to emergency (n)
Total Mean (95% CI) Rate Mean (95% CI)
Consultations of the team to health education groups (n) Total Mean (95% CI)
Rate Mean (95% CI)
Non MM
13386 264 (261-266)*
74.2 (73.3-75.0)*
380 5 (4-5) 1.26 (1.24-1.34)
2399 2 (2-2) 0.45 (0.43-0.47)
6412 3 (3-3) 0.84 (0.82-0.86)
11525 4 (4-4) 1.12 (1.09-1.15)*
MM
4037 288 (283-293)*
81.1 (79.8-82.7)*
149 1 (1-2) 0.36 (0.30-0.44)
869 2 (2-2) 0.47 (0.44-0.51)
2201 3 (3-3) 0.84 (0.80-0.87)
3129 4 (3-4) 0.97 (0.94-1.02)*
Lima R
Table 1. continuation
* Statistically significant differences (CI do not tally). NOTE: MM: Team with medical professional of the Mais Médicos Program. Non MM: Team without medical professional belonging to the Mais Médicos Program. 95% CI: 95% Confidence Interval. NOTE: Rates per 1,000 inhabitants; the denominator being the total number of people registered per health team.
Total
30580 299 (297-301) 88.4 (87.8-89.0)
1050 2 (2-2) 0.67 (0.60-0.73)
5733 2 (2-2) 0.49 (0.47-0.50)
15191 3 (3-3) 0.86 (0.85-0.88)
25844 4 (4-4) 1.16 (1.14-1.18) Indicators
Medical appointment output (n) Total Mean (95% CI) Rate Mean (95% CI) Medical referrals to specialists (n)
Total Mean (95% CI) Rate Mean (95% CI) Medical referrals to hospital (n)
Total Mean (95% CI) Rate Mean (95% CI) Medical referrals to emergency (n)
Total Mean (95% CI) Rate Mean (95% CI)
Consultations of the team to health education groups (n) Total Mean (95% CI)
Rate Mean (95% CI)
Non MM
24178 300 (298-302)*
89.4 (88.9-90.1)*
769 2 (2-2) 0.69 (0.61-0.74)
4346 2 (2-2) 0.49 (0.48-0.51)
11732 3 (3-3) 0.87 (0.85-0.89)
20294 4 (4-4) 1.16 (1.13-1.18)
MM
6402 293 (290-297)*
84.6 (83.4-85.8)*
281 2 (2-2) 0.63 (0.56-0.74)
1387 2 (2-2) 0.47 (0.46-0.52)
3459 3 (3-3) 0.85 (0.81-0.88)
5550 4 (4-4) 1.15 (1.12-1.19) Metropolitan region
Total
39109 285 (284-287) 82.4 (81.9-83.0)
2215 2 (2-2) 0.52 (0.47-0.56)
4075 1 (1-1) 0.35 (0.34-0.35)
15341 2 (2-2) 0.72 (0.70-0.73)
32302 6 (5-6) 1.63 (1.61-1.66) Indicators
Medical appointment output (n) Total Mean (95% CI) Rate Mean (95% CI) Medical referrals to specialists (n)
Total Mean (95% CI) Rate Mean (95% CI) Medical referrals to hospital (n)
Total Mean (95% CI) Rate Mean (95% CI) Medical referrals to emergency (n)
Total Mean (95% CI) Rate Mean (95% CI)
Consultations of the team to health education groups (n) Total Mean (95% CI)
Rate Mean (95% CI)
Non MM
33518 289 (287-291)*
84.1 (83.6-84.7)*
1985 2 (2-2) 0.54 (0.49-0.59)
3476 1 (1-1) 0.35 (0.34-0.36)
13289 2 (2-2) 0.73 (0.71-0.74)*
27639 5 (5-6) 1.62 (1.59-1.64)*
MM
5591 265 (261-269)*
73.8 (72.8-75.0)*
230 1 (1-2) 0.44 (0.38-0.52)
599 1 (1-1) 0.33 (0.32-0.35)
2052 2 (2-2) 0.65 (0.61-0.69)*
4663 6 (6-6) 1.72 (1.65-1.79)*
Capitals
Total
86070 305 (304-306) 97.7 (97.3-98.0)
3885 2 (2-2) 0.71 (0.69-0.73)
25556 2 (2-2) 0.69 (0.68-0.70)
42481 3 (3-3) 0.94 (0.93-0.95)
74158 4 (4-4) 1.23 (1.22-1.25) Indicators
Medical appointment output (n) Total Mean (95% CI) Rate Mean (95% CI) Medical referrals to specialists (n)
Total Mean (95% CI) Rate Mean (95% CI) Medical referrals to hospital (n)
Total Mean (95% CI) Rate Mean (95% CI) Medical referrals to emergency (n)
Total Mean (95% CI) Rate Mean (95% CI)
Consultations of the team to health education groups (n) Total Mean (95% CI)
Rate Mean (95% CI)
Não MM
73277 304 (303-305)*
97.3 (96.8-97.7)*
3187 2 (2-2) 0.70 (0.67-0.72)
21112 2 (2-2) 0.69 (0.68-0.70)
35237 3 (3-3) 0.94 (0.92-0.95)
62949 4 (4-4) 1.24 (1.23-1.26)*
MM
12793 312 (310-314)*
99.8 (99.0-100.7)*
698 2 (2-2) 0.78 (0.72-0.84)
4444 2 (2-2) 0.69 (0.67-0.72)
7244 3 (3-3) 0.97 (0.94-0.99)
11209 4 (4-4) 1.17 (1.14-1.21)*
e C ole tiv a, 21(9):2685-2696, 2016
Table 2. Medical referral and health education group indicators from primary care in Brazil in the year 2014.
it continues 20% poverty G100 p* <0.001 <0.001 <0.001 <0.001 Indicators
Medical referrals to: Specialists
none 1 or more Hospital
none 1 or more Emergency
none 1 or more
Consultations to health education groups none
1 or more
N 809570 23137 664250 156154 531826 290854 76144 149464 % (97.2) (2.8) (81.0) (19.0) (64.6) (35.4) (33.8) (66.2) Non MM N 59299 1845 46696 13962 35469 25144 19762 37153 % (97.0) (3.0) (77.0) (23.0) (58.5) (41.5) (34.7) (65.3) MM N 868869 24982 710946 170116 567295 315998 95906 186617 % (97.2) (2.8) (80.7) (19.3) (64.2) (35.8) (33.9) (66.1) Total Total p* 0.097 <0.001 <0.001 <0.001 Indicators
Medical referrals to: Specialists
none 1 or more Hospital
none 1 or more Emergency
none 1 or more
Consultations to health education groups none
1 or more
N 177331 3854 136982 40879 120900 58026 15756 27057 % (97.9) (2.1) (77.0) (23.0) (67.6) (32.4) (36.8) (63.2) Non MM N 22170 443 16108 6405 12983 9491 27057 12602 % (98.0) (2.0) (71.5) (28.5) (57.8) (42.2) (38.7) (61.3) MM N 199501 4297 153090 47284 133883 67517 23702 39659 % (97.9) (2.1) (76.4) (23.6) (66.5) (33.5) (37.4) (62.6) Total p* 0.004 <0.001 <0.001 0.457 Indicators
Medical referrals to: Specialists
none 1 or more Hospital
none 1 or more Emergency
none 1 or more
Consultations to health education groups none
1 or more
Lima R
Table 2. continuation
* Statistical test used: Pearson’s chi-square test.
Capitals Other locations p* <0.001 <0.001 <0.001 <0.002 Indicators
Medical referrals to: Specialists
none 1 or more Hospital
none 1 or more Emergency
none 1 or more
Consultations to health education groups none
1 or more
N 112757 3221 98801 17032 70427 43169 10124 20294 % (97.2) (2.8) (85.3) (14.7) (62.0) (38.0) (33.3) (66.7) Non MM N 8484 304 7301 1511 4963 3738 2549 5550 % (96.5) (3.5) (82.9) (17.1) (57.0) (43.0) (31.5) (68.5) MM N 121241 3525 106102 18543 75390 46907 12673 25844 % (97.2) (2.8) (85.1) (14.9) (61.6) (38.4) (32.9) (67.1) Total Metropolitan region p* <0.001 0.011 0.626 0.61 Indicators
Medical referrals to: Specialists
none 1 or more Hospital
none 1 or more Emergency
none 1 or more
Consultations to health education groups none
1 or more
N 127472 2716 120371 9886 91538 38229 14430 27639 % (97.9) (2.1) (92.4) (7.6) (70.5) (29.5) (34.3) (65.7) Non MM N 7193 233 6800 623 5246 2163 2401 4663 % (96.9) (3.1) (91.6) (8.4) (70.8) (29.2) (34.0) (66.0) MM N 134665 2949 127171 10509 96784 40392 16831 32302 % (97.9) (2.1) (92.4) (7.6) (70.6) (29.4) (34.3) (65.7) Total p* <0.001 <0.001 <0.001 0.323 Indicators
Medical referrals to: Specialists
none 1 or more Hospital
none 1 or more Emergency
none 1 or more
Consultations to health education groups none
1 or more
e C
ole
tiv
a,
21(9):2685-2696,
2016
the expected number of primary care consulta-tions, which implies that an FHS physician’s out-put is below the expected average recommended by the Ministry of Health. The performance of a physician varies between 251 and 305 consul-tations per month in the poorer districts and in other areas of the country, respectively. According to Silva, Barbosa and Rocha, these findings show that the performance of a physician is influenced by the family health team, rather than by existing infrastructure, the time a physician has worked in an area or his qualifications as a doctor18. It is possible that, generally, it is difficult to attain the number of monthly consultations expected through primary health care work, which re-quires home visits, activities involving health ed-ucation and consultations by demand, which are either pre-scheduled or spontaneous, which may possibly influence the total number of consulta-tions given in the course of a month. It should also be remembered that this analysis included all the months of the year, including December, which is a period of low productivity.
In Brazil, the expansion of Primary Health care has been made possible by means of the Family Health Strategy (FHS) and the deploy-ment of the Mais Médicos Program has repre-sented an effective reduction in the inequalities of access to these services. According to our find-ings, there was a higher productivity of medi-cal consultation in the Mais Médicos teams in municipalities classified as being socially more vulnerable, which suggests that the aim of the program has been achieved, being a wide-rang-ing measure to combat inequalities of access to effective primary care5,7,8,11,19,20. This relationship is inverted in the case of municipalities located within metropolitan regions or in capital cities, which would indicate that in these places there are other care outlets, thereby acknowledging the complimentary value that the Mais Médicos Program represents within the ambit that of-fers primary health care services. It was possible to observe greater weekly output from the Mais Médicos teams in all areas of the study, especial-ly in the poorer municipalities and those which
Figure 1. Comparison of weekly productivity of the total of medical appointments in accordance with the profile
of Brazilian municipalities – 2014.
Graph of averages of Weekly Productivity – total/2014
60 70 80 90
Non MM MM
201403
201401 201402 201404 201405 201406 201407 201408 201409 2014010 2014011 2014012
A
ve
rag
e o
f
W
eekl
y P
ro
duc
ti
vit
y
Graph of averages of Medical Appointments – 20% poverty/2014
50 60 70 90
Non MM MM
201403
201401 201402 201404 201405 201406 201407 201408 201409 2014010 2014011 2014012
80
A
ve
rag
e o
f
W
eekl
y P
ro
duc
ti
vit
y
Graph of averages of Medical Appointments – G100/2014
60 70 80 90
Non MM MM
201403
201401 201402 201404 201405 201406 201407 201408 201409 2014010 2014011 2014012
A
ve
rag
e o
f
W
eekl
y P
ro
duc
ti
vit
y
Graph of averages of Medical Appointments – Metropolitan region/2014
70 80
100 Non MMMM
201403
201401 201402 201404 201405 201406 201407 201408 201409 2014010 2014011 2014012
90
A
ve
rag
e o
f
W
eekl
y P
ro
duc
ti
vit
y
Graph of averages of Medical Appointments – Capitals/2014
70 80
95 Non MMMM
201403
201401 201402 201404 201405 201406 201407 201408 201409 2014010 2014011 2014012
90
A
ve
rag
e o
f
W
eekl
y P
ro
duc
ti
vit
y
85
75
65
Graph of averages of Medical Appointments – Other locations/2014
70 80 100
Non MM MM
201403
201401 201402 201404 201405 201406 201407 201408 201409 2014010 2014011 2014012
90
A
ve
rag
e o
f
W
eekl
y P
ro
duc
ti
vit
Lima R had the worst HDI. This is due to the total hours
worked per week (32 hours) that dedicate near-ly one day a week to activities related to study, which suggests that it would be possible to in-clude periods of time for continued educational studies as part of the daily working routing of a Non-Mais Médicos team, in order to train in FHS work processes3,21,22. According to Ceccim and Merhy, ongoing education therefore becomes a strategy used to change the working process and for investment in care practices that aim to ar-ticulate learning in the workplace and, based on this work and what this produces, commitments in support of the health care needs of the popula-tion23. The weekly output of a Mais Médicos team reveals the possibility of implementing regular study periods or activities that reflect the work-ing world to enhance the quality of the Non-Mais Médicos teams without loss of performance.
Few medical referrals were registered for specialist care with peculiarities inherent to the system of regulation and the constitution of the care system network for each type of municipal profile. We found 2.8% of some type of referral to a specialist, 19.3% for hospital referrals and 35.8% for emergency referrals in the sampling of the Brazilian municipalities analyzed. Health regulations are understood to be “a set of medi-ate actions, which are interposed between the de-mands of users and their access to health services, translated into workflows, care protocols, exam-ination and consulting centers, as well as related work procedures”24, by means of central regula-tions, that involve the logic health care areas and issues. Primary health care referrals to specialized services still represent a considerable challenge for the SUS in municipalities that have a lower intermediate technological density. There is ev-idence of logistical difficulties given the physical distances that limit the access of users to health services, with non-existent ambulance services, as well as problems with accessing the regulatory services (SISREG) in the case of medical referrals. These two factors make it difficult for the pop-ulation living in smaller municipalities to have access to more complex health services, which generates a significant number of absenteeisms25. However, a high number of non-referrals can in-dicate problems related to filling in the required forms online, a fact that was not clarified by the analyses conducted in this study.
The fact that few emergency referrals are registered may indicate a more effective primary health system. In areas that are more dependent on primary health, the reduced number of
e C
ole
tiv
a,
21(9):2685-2696,
2016
Collaborations
FS Costa, AS Balieiro worked on the text, on the construction of the figures and tables. RTS Lima, TG Fernandes, JC Schweickardt, JMA Schramm, AA Ferla worked on the concept, on the text and final draft of this article.
which thereby prejudices the management of the system. This can be seen in poorer municipalities where access to emergency services and specialist care are not advantageous, especially as patients depend on ambulance transportation for long distances7,26. The fact is that in all cases efforts are made to promote equity in access to health ser-vices so as to ensure comprehensive health care that adjusts its offer of available care services ac-cording to the needs of the users.
We found that the number of educational ac-tivities conducted by the health teams is similar for both groups. In relation to the services that the teams provide for health education groups, the Non-Mais Médicos Program teams showed a higher monthly output, while the Mais Médicos teams carried out more educational activities in the capital cities and municipalities in general. These findings can be partly explained by the fact that physicians are more actively involved in outpatient care, in most cases, through scheduled or spontaneous consultations, even in primary care. Although educational activities are seen as a powerful health promotion instrument, there are still certain barriers that make it difficult to im-plement fully, since these activities have to com-pete with the time a physician still has available, after dealing with his outpatients, home visits and emergency work. We noted that the variable in question is the sum total of the actions promot-ed by the health team, which indicates that the community health agent has assumed, to a large extent, the responsibilities for educational activ-ities and, on the other hand, that the physician, independent from the group, does not interfere in the way a team carries out health educational activities for the benefit of the population.
Among the limitations of this study, we would highlight the inconsistencies of the data-base made available by the Ministry of Health. According to the report issued by the Federal Court of Auditors, duplication of production data was detected (number of medical consulta-tions, requests for tests and home visits), which showed several municipalities with identical pro-duction numbers in consecutive months in 2013, as well as the presence of monthly production data (for example, the number of medical con-sultations) that did not tally with the trends seen in the municipalities that were assessed. Bearing in mind the relevance of these findings, this study identified the same problems and developed a protocol to validate information that exists in the two main national primary care systems, so as to construct an integrated database using
production indicators for primary health care in Brazil. In this respect, the method used in the study also represented a significant finding, since they assess solutions found by control organs and return concise information to the health sector to help them prepare their planning schedule, as well as to help control, monitor, assess and audit health services. Nonetheless, the findings of this study point to the need for new studies about the working procedures of the medical professional together with his team, medical production by team and by municipality in the area of mater-nal-infant health care and for chronic non-com-municable diseases, studies to analyze health practices from the perspective of networks, it being up to social and political studies, based on problems detected in the course of the realities experienced, to attain, for the purpose of a crit-ical reflection, more effective actions in primary health care19,20.
Lima R
Brasil. Ministério da Saúde (MS). Portaria Interminis-terial de 19 de fevereiro de 2013. Estabelece critérios para definição das áreas e regiões prioritárias com ca-rência e dificuldade de retenção de médico integrante de equipe de saúde da família oficialmente cadastrada e das especialidades médicas prioritárias. Diário Oficial da União 2013; 19 fev.
Brasil. Ministério da Saúde (MS). Portaria nº 1.101, de 12 de junho de 2002. Estabelece os parâmetros de cobertura assistencial no SUS. Diário Oficial da União
2002; 12 jun.
Silva VAA, Barbosa ACQ, Rocha TAH. Desempenho dos médicos na saúde da família - uma análise a partir dos princípios ordenadores em um município
brasilei-ro. Rev. Adm. Pública 2015; 49(5):1237-1262.
Scheffer M. Programa Mais Médicos: em busca de res-postas satisfatórias. Interface (Botucatu) 2015; 19(54): 637-640.
Campos GWS. Mais médicos e a construção de uma política de pessoal para a Atenção Básica no Sistema Único de Saúde (SUS). Interface (Botucatu) 2015; 19(54):641-642.
Pinto HA, Sousa A, Ferla AA. O Programa Nacional de Melhoria do Acesso e da Qualidade da Atenção Básica: Reflexões sobre o seu desenho e processo de implanta-ção. Saúde em Debate 2012; 6(2):358-372.
Pinto HA, Sousa A, Ferla AA. Formulação e implemen-tação de políticas como pedagogias para a gestão: um ensaio a partir de três casos do Sistema Único de Saúde.
Saúde em Redes 2015; 1(1):81-94.
Ceccim RB, Merhy EE. Um agir micropolítico e peda-gógico intenso: a humanização entre laços e perspecti-vas. Interface (Botucatu) 2009; 13(Supl. 1):531-542. Nascimento AAM, Damasceno AK, Silva MJ, Silva MVS, Feitoza AR. Regulação em saúde: aplicabilidade para concretização do pacto de gestão do sus. Cogitare
Enferm 2009; 14(2):346-352.
Erdmann AL, Andrade SR, Mello ALSF, Drago LC. A atenção secundária em saúde: melhores práticas na rede de serviços. Rev. Lat. Am. Enfermagem 2013; 21(Spec.):131-139.
Viana ALD, Machado CV, Baptista TWF, Lima LD, Mendonça MHM, Heimann LS, Albuquerque MV, Iozzi FL, David VC, Ibañez P, Frederico S. Sistema de saúde universal e território: desafios de uma política re-gional para a Amazônia Legal. Cad Saude Publica 2007; 23(Supl. 2):S117-131.
Article submitted 05/03/2016 Approved 07/06/2016
Final version submitted 09/06/2016 16.
17.
18.
19.
20.
21.
22.
23.
24.
25.
26.
References
Brasil. Ministério da Saúde (MS). Política Nacional de Atenção Básica. Brasília: MS; 2011.
Brasil. Lei 12871, de 22 de outubro de 2013. Institui o Programa Mais Médicos. Diário Oficial da União 2013; 22 out.
Collar JM, Neto JBA, Ferla AA. Formulação e impacto do Programa Mais Médicos na atenção e cuidado em saúde: contribuições iniciais e análise comparativa.
Saúde em Redes 2015; 1(2):43-56.
Souza MLP. Apontamentos sobre as especificidades da supervisão acadêmica em área indígena no ambito do Programa Mais Médico para o Brasil: O caso do esta-do esta-do Amazonas. Tempus - Actas Saúde Coletiva 2015; 9(2000):191-197.
Oliveira FP, Vanni T, Pinto HA, Santos JTR, Figueiredo AM, Araújo SQ, Matos MFM, Cyrino EG. Mais Médi-cos: um programa brasileiro em uma perspectiva in-ternacional. Interface (Botucatu) 2015; 19(c):623-634. Macinko J, Lima Costa MF. Access to, use of and sa-tisfaction with health services among adults enrolled in Brazil’s Family Health Strategy: evidence from the 2008 National Household Survey. Trop. Med. Int. Heal-th 2012; 17(1):36-42.
Paim J, Travassos C, Almeida C, Bahia L, Macinko J. The Brazilian health system: history, advances, and challenges. Lancet 2011; 377(9779):1778-1797. Facchini LA, Piccini RX, Tomasi E, Thumé E, Silveira DS, Siqueira FV, Rodrigues MA. Desempenho do PSF no Sul e no Nordeste do Brasil: avaliação institucional e epidemiológica da Atenção Básica à Saúde. Cien Saude
Colet 2006; 11(3):669-681.
Lemões MAM, Thumé E, Tomasi E, Dilélio AS, Borges CLDS, Facchini LA. Caracterização das ações de regu-lação assistencial articulada à Atenção Primária à Saú-de em municípios do Sul e NorSaú-deste do Brasil: 2001 a 2004. Epidemiol. e Serviços Saúde 2013; 22(4):631-640. Malta DC, Santos MAS, Stopa SR, Vieira JEB, Melo EA, Reis ACC. A Cobertura da Estratégia de Saúde da Fa-mília (ESF) no Brasil, segundo a Pesquisa Nacional de Saúde, 2013. Cien Saude Colet 2016; 21(2):327-338. Santos LMP, Costa AM, Girardi SN. Programa Mais Médicos: uma ação efetiva para reduzir iniquidades em saúde. Cien Saude Colet 2015; 20(11):3547-3552. Costa FF, Calvo MCM. Avaliação da implantação da Es-tratégia Saúde da Família em Santa Catarina em 2004 e 2008. Rev. Bras. Epidemiol. 2014; 17(2):557-570. Almeida PF. Mapeamento e Análise dos Modelos de Atenção Primária à Saúde nos Países da América do Sul
- Atenção Primária à Saúde no Brasil. Rio de Janeiro:
Instituto Suramericano de Gobierno en Salud; 2014. Mendonça MHM, Martins MIC, Giovanella L, Escorel S. Desafios para gestão do trabalho a partir de experi-ências exitosas de expansão da Estratégia de Saúde da Família. Cien Saude Colet 2010; 15(5):2355-2365. Brasil. Ministério da Saúde (MS). Portaria 3.462, de 11 de novembro de 2010. Estabelece critérios para ali-mentação dos Bancos de Dados Nacionais dos Sistemas de Informação da Atenção à Saúde. Diário Oficial da
União 2010; 11 nov.
1. 2.
3.
4.
5.
6.
7.
8.
9.
10.
11.
12.
13.
14.