Data Journalism, Millennials
& Social Networks
2015
Advisor:
Ricardo Jorge Pinto
Statement of Originality
I hereby certify that I, Thomas Schulze have written the accompanying thesis by myself,
without contributions from any sources other than those cited in the text and
acknowledgements.
This applies also to all graphics, tables and images included in the thesis.
The paper is presented to the University Fernando Pessoa as part of the requirements for
degree of 2nd Cycle Master Degree in Journalism at the University Fernando Pessoa.
Signature: ID No.: 29451
Abstract
Data is a term that is currently making massive waves amongst media and news media.
With stories like the Iraq War Logs, it made its way onto the journalistic stage. Due to
that, the purpose of this thesis is to investigate the characteristics of data journalism and
its effects on journalism. Therefore, the related project is designed to make use of
current models in order to find out what it takes through practical use. Furthermore, the
conducted case study aims to determine the usage and acceptance by the audience of the
social network Twitter and in particular the Millennials.
The subject of the study was the produced visual data outcome and the feedback given
by citizens and especially consumers/ users of Twitter. The data for the study was
gathered through a quantitative image type analysis and the record of retweets and
favorites.
These data support the view that data journalism with its visual results appeal to the
audience and the characteristics of the Millennials. Additionally, it was concluded that
the basic attitude of journalists will not change but the tools and skills need to be
implemented in the newsroom and the work process of the storytelling journalist that, as
a result, will promote watchdog and citizen journalism.
Keywords: Data Journalism, Millennials, Social Networks, Watchdog Journalism,
Table of Content
Statement of Originality ... i
Abstract ... ii
Table of Content ... iii
List of Figures ... v
List of Tables ... vi
1. Introduction ... 1
1.1. Introduction ... 1
1.1.1. Motivation and purpose of research ... 2
1.1.2. Structure of the thesis ... 3
1.1.3. Research method ... 4
1.1.4. Research question ... 5
1.1.5. Research boundaries ... 6
2. Development ... 6
2.1. Data Journalism ... 6
2.1.1. Terminology ... 8
2.1.2. Precision journalism ... 11
2.1.3. Data journalism process ... 12
2.1.4. Open data ... 16
2.1.5. Problems of data journalism ... 18
2.1.6. History of data journalism ... 20
2.2. Visual communication - data visualization ... 28
2.2.1. Terminology ... 29
2.2.3. Visualization of data ... 32
2.2.4. Visualization process ... 34
2.2.5. Advantages of visualization ... 40
2.2.6. Problems of data visualization ... 41
2.3. Dark Horse Vietnam ... 44
2.3.1. Description ... 44
2.3.2. Process ... 45
2.4. Millennials ... 50
2.5. Social Network ... 52
2.5.1. Terminology ... 52
2.5.2. Twitter ... 53
2.5.3. News consumption – Social networks ... 56
2.5.4. Usage of Twitter ... 57
2.6. Use of data visualization on Twitter (Case Study) ... 59
2.6.1. Explanation ... 59
2.6.2. Analysis ... 60
2.6.3. Summary ... 81
3. Conclusion ... 82
3.1. Conclusion ... 82
3.1.1. What data journalism means for journalists ... 83
3.2. Advice ... 95
3.2.1. Integration Newsroom ... 95
3.2.2. Outlook and Perspectives ... 98
3.2.3. Suggestions future research ... 100
4. References ... 101
Images ... 115
4.2. Appendixes ... 118
Appendix 1: Work process – Schedule ... 118
Appendix 2: Manchester Guardian – Data Story ... 120
Appendix 3: Nightingale – Diagram of the causes of mortality ... 121
Appendix 4: Minard – French invasion of Russia ... 121
Appendix 5: Practical example - Trifecta Check up ... 122
Appendix 6: Types of commonly used visualization ... 123
Appendix 7: Dark Horse Vietnam – Article ... 125
Appendix 8: Twitter Glossary ... 126
Appendix 9: Visualization – Case Study ... 130
Appendix 10: Dataset - Die ZEIT ... 131
Appendix 11: Dataset - The Guardian ... 132
Appendix 12: Dataset - GuardianData ... 133
Appendix 13: Dataset - The New York Times ... 134
Appendix 14: Dataset - New York Times Graphics ... 135
List of Figures
Fig. 1: Data-Driven Journalism = Process ... 13Fig. 2: The inverted pyramid of data journalism ... 14
Fig. 3: Gathering data: a flow chart of tools and techniques ... 15
Fig. 4: Workflow - The Guardian ... 15
Fig. 5: Where did you get your news yesterday? ... 21
Fig. 6: Should journalists learn to code? ... 27
Fig. 8: Images versus Text ... 30
Fig. 9: Diagram of the causes of mortality ... 31
Fig. 10: French invasion of Russia ... 32
Fig. 11: Trifecta Checkup ... 34
Fig. 12: 8 Hats of Data Visualization Design ... 35
Fig. 13: Incomplete Data ... 42
Fig. 14: Same Data, different y-axis ... 42
Fig. 15: Cumulative graphs ... 42
Fig. 16: Ignoring conventions - misleading pie chart ... 43
Fig. 17: Ignoring conventions ... 43
Fig. 18: Ignoring conventions - bubble chart ... 43
Fig. 19: Anatomy of a tweet ... 55
Fig. 20: Comparison newsrooms ... 97
List of Tables
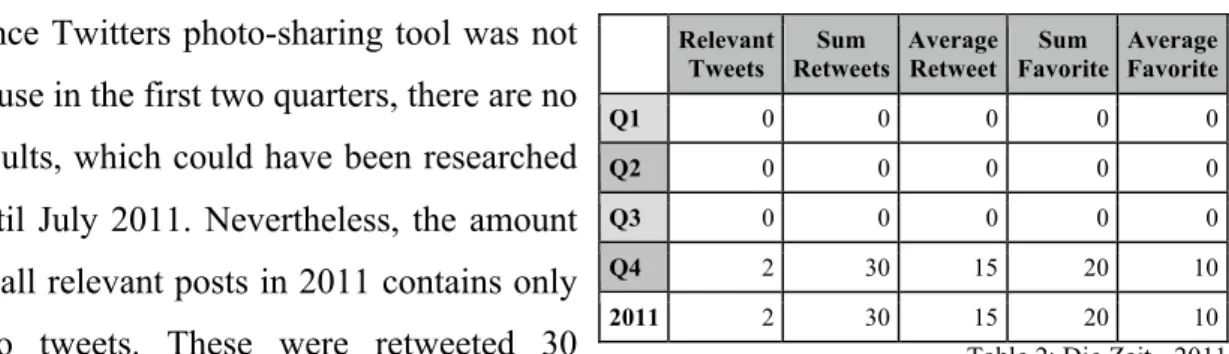
Table 1: Die Zeit - Overall ... 61Table 2: Die Zeit - 2011 ... 62
Table 3: Die Zeit - 2012 ... 62
Table 4: Die Zeit - 2013 ... 63
Table 5: Die Zeit - 2014 ... 64
Table 6: The Guardian - Overall ... 65
Table 7: The Guardian - 2011 ... 65
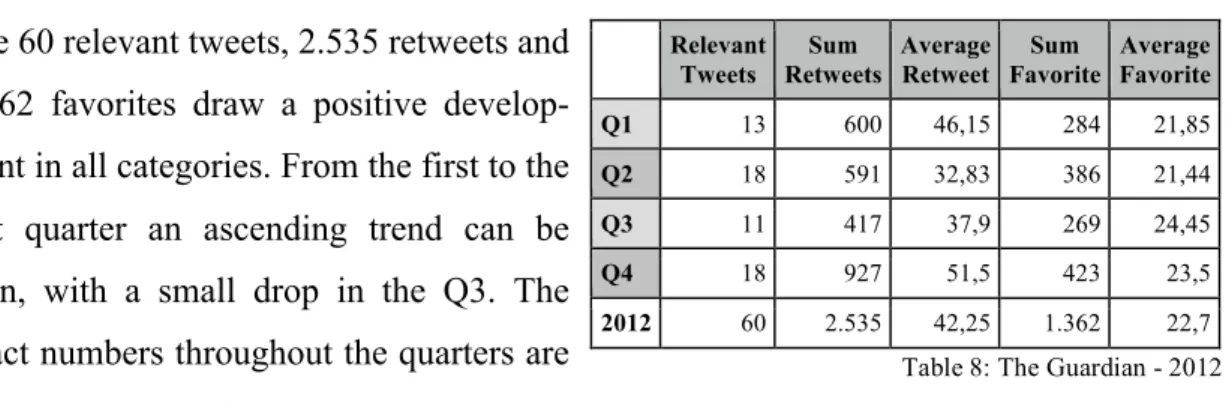
Table 8: The Guardian - 2012 ... 66
Table 9: The Guardian - 2013 ... 67
Table 11: GuardianData - Overall ... 69
Table 12: GuardianData - 2011 ... 69
Table 13: GuardianData - 2012 ... 70
Table 14: GuardianData - 2013 ... 71
Table 15: GuardianData - 2014 ... 72
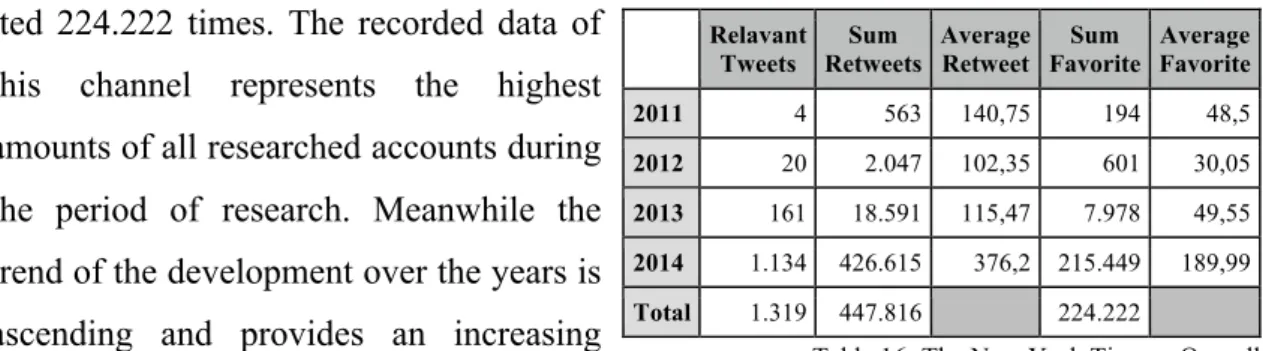
Table 16: The New York Times - Overall ... 74
Table 17: The New York Times - 2011 ... 74
Table 18: The New York Times - 2012 ... 75
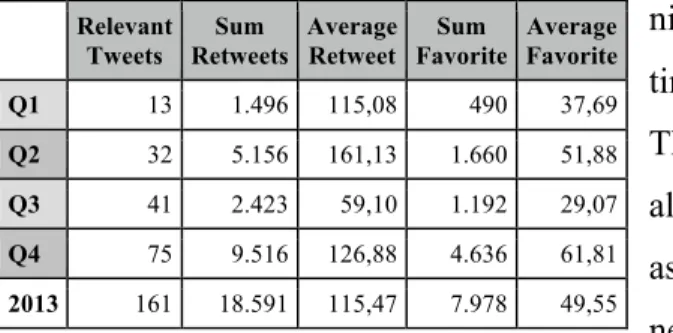
Table 19: The New York Times - 2013 ... 75
Table 20: The New York Times - 2014 ... 76
Table 21: New York Times Graphics - Overall ... 77
Table 22: New York Times Graphics - 2011 ... 78
Table 23: New York Times Graphics - 2012 ... 78
Table 24: New York Times Graphics - 2013 ... 79
1.
Introduction
“Journalists who master this will experience that building articles on facts and insights
is a relief.” (Gray, 2012, p.4)
1.1.
Introduction
The task of journalism and media is more than keeping the citizens informed. They play
a far more important role in the democratic societies by acting as a watchdog and
monitoring the activities of public institutions and processes. Already in 1922,
Lippmann discussed the role of media to form a public opinion stating that the news
media represents the primary source for the public perception of the global events. In
reference to this McCombs and Shaw (1972, p.176) supported the responsibility of mass
media with their theory of the Agenda-Setting and further pointed out that “mass media
have a significant impact on our focus attention” (McCombs, 1981, p.121). This
responsibility of news media needs a certain amount of credibility, which it lost over the
past. The Pew Research Center (2012) observed the development of the credibility of
news organizations.
Although, the study puts its focus on the U.S. market, it can be said that this process
also happens elsewhere and is a general phenomenon (Rosen, 2012), as for example in
Germany. To this conclusion comes a recent survey made by YouGov for the online
edition of the German newspaper Die Zeit (ZEIT ONLINE, 2014), which is about
Ger-man media and the conflict with Russia and revealed that the trust in GerGer-man news
me-dia is suffering as well. In detail, it points out that almost every second German (47%)
mistrusts the media, believing that news media is biased towards politics. While only
40% think media is objective and independent and 13% do not have an opinion on the
topic, or do not know whether they believe the news or not. Since this example is
fo-cused on a specific event, a survey by the think tank GfK Verein (2014) took a more
general approach looking at the trust in professional groups. The reportdrew a similar
picture and shows, only around four out of ten people (37%) trust journalists, and
institutions that should have a higher reputation to be a watchdog over government,
Furthermore, with the appearance of the World Wide Web, the amount of information
and data exploded and is rising every minute. For example, reading this first part takes
around one minute. During this minute an amount of 1.354.440 GB (Pennystocks, 2015)
was transferred over the Internet and the size is growing as you continue to read. To
make this huge number more tangible the storage of one IPod touch with 128 GB would
be filled with 18.2861 songs in 0,00567 seconds. To put differently, during the six months that it took to write this thesis, more than 2.8 billion IPods were filled with over
51 trillion songs, which theoretically results in a playlists that could run for almost 322
million years without playing a song twice.
So, resulting the massive increase of information journalists have to adapt to make use
of this big data, which has become increasingly important over the last two decades. A
new tool to work with this digital information is data journalism. It represents a
journal-istic approach, which uses data to create stories and supports them with tables or
visualizations. However, this new tool is challenging the traditional approaches to make
and present news, because as Troy Thibodeaux (2015), editor at the Associated Press
wrote “data journalism describes neither a beat nor a particular medium (…), but
rath-er an ovrath-erlapping set of competencies drawn from disparate fields.”
Before continuing with the thesis, the term (data) visualization in this paper is meant to
describe all forms of data visualization, which also includes for example more complex
infographics. To be more precise, all forms of visualization of data or visual elements to
show a hierarchy or to differentiate. It is important to distinguish since paintings or
photographs represent technically visualizations but are not meant and talked about.
1.1.1. Motivation and purpose of research
Conversations about data journalism easily show that the majority of people do not have
a clear idea about what it is and usually guess the components it consists of - data.
Data journalism is considered a rather young discipline, which is tightly connected to a
computational approach to journalism. Due to this young age, the data journalistic
pro-cess is still described very vaguely, this field is in need for guidelines and support for
journalist who are motivated to move and work in this field. However, data journalism
1
increased a lot in the past years and pioneers like The New York Times and The
Guardian even created specialized websites and accounts on social networks to cover
this fast evolving field. As a matter of fact, news media is trying to adopt and
imple-ment data journalism, which is currently very trendy, but represents a serious approach
to regain the credibility and trustworthiness of journalism and inform the readers in an
appealing way by making use of the characteristics of “precision journalism” (Meyer,
2002).
The importance of the Internet for data journalism was already mentioned but there is
another element, which is challenging journalism - social networks such as Twitter or
Facebook. In a study by Kwak, Lee, Park and Moon (2010) they conclude that
espe-cially news accounts on Twitter can be more powerful than traditional news media.
However, closely linked to social networks are in particular younger age groups like the
Millennials and Generation Z. Due to that, a second focus is put on the relation between
data journalism, social networks and Millennials. Hence, a research of the potential of
the social network Twitter as a tool for data journalism and the feedback from the
audi-ence regarding data journalistic products was the point of interest.
1.1.2. Structure of the thesis
The structure consists of the three main parts: introduction, development and the
conclusion that includes subchapters to simplify the reading experience and orientation.
Furthermore to increase the reading experience each chapter is summarized in a short in
the end of each chapter.
In the introduction, the reasons, approach, idea and motivation to do research in the
field and write about data journalism and data visualization, are stated. In fact, the field
of data journalism, as it is currently being used can be considered a young discipline,
the main body or development covers different parts and presents the basic facts and
knowledge that are necessary to understand the topic. The development, is divided into
1. Data journalism
• Theoretical framework
• Example of use - Dark Horse Vietnam
2. Current state of data journalism on social networks
• Theoretical framework
• Case study - data visualization on Twitter
Part 1 is a represents the theoretical framework to data journalism by presenting,
describing and explaining approaches and terms linked to data journalism and
visualiza-tion. In accordance to these models the example of use, the data story Dark Horse
Vietnam is put into practice and what this new form means for journalism.
Within part 2 the focus is put on social networks and the characteristics of the so-called
Millennials to provide the fundament for the case study. It considers the power of social
networks and mobile application and investigates the use of data visualizations on
Twitter by three pioneering newspapers in the field of data visualization.
The final stage of the thesis, the conclusion, picks up the main points and arguments to
close the circle in order to answer the research questions and give an outlook.
More-over, perspectives of data journalism are discussed and brought into perspective
accord-ing to findaccord-ings of this thesis and other sources.
1.1.3. Research method
The general research method to this thesis was similar to a journalistic story, by using
the strategy of concentric circles. That means relevant literature, important authors and
key player in the field of data journalism were investigated and used to build a
theoreti-cal framework for this thesis (Krämer, 1999, pp.33-48). Additionally, in order to reach a
conclusion for the thesis an inductive reasoning was used. The aim of the use was to
explore whether data journalism and its visual products offer a way to reach and involve
the audience, in particular Millennials. Due to that, the overall method used for this
the-sis is the concept of the grounded theory, which is all about data collection and analythe-sis.
The aim of this strategy is to construct a theory that is grounded in the data (Glaser &
ap-proach and its assumption that ideas emerge from data or information. Therefore,
differ-ent studies were taken into account, in order to examine the developmdiffer-ent and answer
the research questions. Meanwhile, the reasoning bases on three parts and observations
made during the research. The first part is the theoretical part, in which studies and
models are presented, while the second part puts the models to the test in the example of
use Dark Horse Vietnam. Finally, the third part explores the consumer but also the
producing side with the case study, which takes the theoretical framework into
consideration. The case study is a social network analysis about the use of data
visualization on Twitter by three different news media representatives. It furthermore is
a quantitative image type analysis that focuses on the visual data journalistic products.
The categorization into image types is a central component of this method (Grittmann,
2001, p.277) and the priority is put on the message of the image (Grittmann &
Ammann, 2009, p.144).
1.1.4. Research question
As a matter of the fact, that this thesis combines two projects, the approaches are two
different ones. The purpose of the first part is to gain an insight into the current state of
data journalism, while making use of the research results in a practical form. The aim
was to investigate required skills and knowledge in order to engage in data journalism.
Meanwhile, the focus of the second part is the attractiveness of images or more
specif-ically data visualizations in combination with their use by three major news companies
on the social network Twitter. The goal was to find out what the current state of the use
is, while the question was raised to what extend news companies already make use of
this possibility. In order to, find out if data visualizations can be used as a tool to spread
information and knowledge on social networks and appeal to the audience, the main
question was: How did the promotion and feedback of the visual results of data
journal-ism develop on Twitter over the last years?
Finally, the thesis presents various reasons why data journalism should be adopted by
journalists and news organizations. In addition, it will look at the role of Millennials in
connection to data journalism and its development. Furthermore, an outlook on the
1.1.5. Research boundaries
During the research and gathering of data different boundaries, problems and
difficul-ties appeared. The biggest obstacle that had to be overcome was to develop a reliable
parameter to filter out data visualization. Since, the case study focuses on visual content
the research happened mostly on a manual base. This procedure is prone to errors due to
a human error. As a result of this problem, the gathered data was double-checked. The
reason why no reliable API or search parameter could be developed was that the content
of images could not be filtered. Furthermore, some data visualizations were included
within the tweet as a Link.
2.
Development
In the following, the principles and models of data journalism are presented and
ex-plained to form a fundament and understand what data journalism is about and why it
matters (Part 1). Furthermore, the elements of the conducted case study are clarified; the
study is further described and finally analyzed (Part 2). In addition, the work process
with the different tasks was recorded and visualized and can be seen in the Appendix 1.
Part I
This part puts the focus on data journalism and provides the theoretical framework for a
better understanding of the term and to put the data story Dark Horse Vietnam into
prac-tice.
2.1.
Data Journalism
Data became an important element in our everyday life and is all-around, for example
when taking the metro, shopping online, using loyalty cards, paying by credit card or
simply visiting the doctor. In all of these cases, chances are high that, data is collected
and analyzed by software, which is why big data became significantly important to
understand customers, clients or patients. Moreover, the possession of such big data that
describes large and complex sets of data, means potential revenue for different
da-taset of all 51 trillion songs with information about Artist, Track, Album, Genre and
Duration of each song, which leads to a spreadsheet with more than 2562 trillion col-umns.
Nowadays, big data is also used in other areas for instance to support police forces to
predict when and where criminal activity is most likely to occur, but also intelligence
and secret services such as the German B.N.D.3 or the US American N.S.A.4 make use of big data as the example of WikiLeaks shows. Up until now, its publications are of
high public interest and show the significance of data these days. As a result of this
development, an urge for a specialization in journalism that is able to deal and process
such information with a journalistic sense appeared - data journalism.
Data journalism has already proved its right of existence for example when Julian
Assange’s WikiLeaks published the U.S. military logs of the war in Afghanistan (
Af-ghan War Diary or the Iraq War Logs). Another example is the origin of the still
ongo-ing N.S.A. surveillance scandal, which is part of the global surveillance disclosures
leaked by Edward Snowden and first published by The Washington Post and The
Guardian. In accordance to these revelations, WikiLeaks creator Julian Paul Assange
picked up this new situation for journalism and stated in an interview with the U.S.
American magazine The New Yorker that he wants “to set up a new standard: scientific
journalism” (Khatchadourian, 2010). The term means, referring to Assange, that
journalists should present and publish the data, which forms the fundament of the
re-search and story. He further emphasizes the imbalance of power in which the audience
is not able to verify the news or what they are being told, which leads to an abuse of the
power by the journalists amongst others. So, by giving the background information, the
audience can replicate, check and verify the data. This approach to journalism is
strongly related to Philip Meyer’s idea of precision journalism that is explained after the
terminology of data journalism.
2
256.337.444.571.434 columns
3
2.1.1. Terminology
Although, data journalism is often described as a quickly evolving and growing area
(Gray, 2012), it is not well defined yet. Due to this, many approaches to define data
journalism and opinions about what it is and which components it includes can be
found.
Certainly, the term data journalism seems rather simple to define and in a broad sense it
can be described as journalism done with data. For example Paul Bradshaw, author of
Scraping For Journalist and online journalist, said that data journalism is a matter of
approaching data and “(…) the compilation of data is what defines it as an act of data
journalism” (Bradshaw, 2011). Furthermore he states, “[d]ata can be the source of data
journalism, or it can be the tool with which the story is told - or it can be both” (Gray,
2012, p.3). So, it either begins with a question, which then needs data to be answered or
a dataset that needs to be investigated and questioned.
Also Steve Doig, the Knight Chair in Journalism of the Walter Cronkite School of
Journalism of Arizona State University, thought about the concept of data journalism
and described it as another way of gathering information, formulating that (Remington,
2012):
“It’s the equivalent of interviewing sources and looking at documents, except with data journal-ism you are essentially interviewing the data to let it tell you its secrets (…).“
The Citizens Campaign provided another, more general, definition by stating that
(Skowronski, n.d.):
“Data Journalism is when we use public data and statistics to tell a story. With the development of modern technology and an increase to access to information in a digital format - it is now possible
to extract more information from public data.”
In reference to one of the pioneers of data journalism and creator of The Guardian
Datablog, Simon Rogers (2013, pp.277-278), data journalism has a variety of styles
“from visualisations to long-form articles”, which means it can be presented in words or
in a graphical way. He further emphasizes that the fundament, which all data stories
have in common are numbers and statistics with the goal to create a story from that.
These approaches already show the difficulties of journalists and experts to clearly
de-fine data journalism. In fact, the same problem occurred when the associate professor
Mass Communication at the Texas State University) asked several journalists to define
the term at the International Symposium on Online Journalism in Austin, Texas. The
same Q and A showed that it was easier for the participants to name the elements and
process of data journalism, which are both important in order to understand data
journalism. According to Prof. Dr. Ralf Spiller and Prof. Dr. Stefan Weinacht (2014,
pp.411-433), the core features of data journalism are: “(…) the collection, analysis and
preparation of digitized information with the aim of a journalistic publication”. As a
matter of fact, Simon Rogers (2013, pp.308-309) describes and summarizes the
im-portant content and parts of data journalism, which in Open data journalism: how it can
work best:
1. Expose the data behind the story
Journalism should reveal something new about the world and be timely. By
that he means that the audience and people care to become part of the story.
2. Provide the key data people need
With all of the data available it is the journalists task to curate key numbers.
Research and selection of data is an essential part a journalist’s job and
combining these skills helps the audience to find what they are looking for.
3. Make it personal
The data should allow the user to see how it affects their lives. In particular,
when the data is very “granular” the journalist can bring it to life by
personal-izing it.
4. Anyone can do it
With all the free tools out there it is easy to visualize and analyze data. In the
end, the key skill is to know whether something is a story or not.
5. Make our data open
A journalist should publish the data in a format, which anyone can use.
6. “Do what you do best, and link to the rest”
As Jeff Jarvis said “There’s bound to be someone out there doing something
amazing - why not be open enough to embrace that?” (Rogers, 2012, p.309)
7. Free data now
Open data is important but real-time data became just as important for example
8. We’re not the experts
“We can’t be experts in every aspect of life - why not try and engage those who
are, so we can make them part of our process?” (Rogers, 2013, p.309)
9. Make big data accessible
It is the job of a data journalist to make the “big data” simpler, smaller and
understandable.
10. Engage
“At the end of the day, it’s all about the stories” (Ibid.)
These ten recommendations demonstrate the idea behind data journalism and the
re-quired elements to create a data story and work in the field of data journalism.
Addition-ally, data journalism is often strongly connected to graphics and visualizations but also
open data access. Although, the focus in this work is put on the visual approach of a
data story, it is not essential to a data story. In the end, the most important part is about
telling the story in the best way possible. That means, a news story can also be
pub-lished with the spreadsheets of numbers because the choice of storytelling tools,
de-pends on the story itself.
A huge benefit of using data, is in fact that it can enrich a story by giving insight and the
possibility for the audience to explore and/ or even interact with the sources, so they can
decide themselves which data they consider important and which not. Linked to this is
the advantage to use data in order to analyze complex situations like political debates
for example. The range of topics is huge, ranging from the financial sector over sports
to social subjects. For instance, the production of an interactive, personalized calculator
based on gathered data lets the citizens see how much of their taxes is spent on
healthcare, for example. According to that, and by referring to data and numbers which
is displayed in graphical ways, it helps to identify trends that otherwise might have
stayed hidden.
Summary
Data journalism represents a special form of investigation that uses data to develop
sto-ries. Moreover, it is a specialized way to treat data as an information source and
interro-gate the researched material based on statistics. In the following, the findings are
pres-ented in a visual, sometimes graphical or in an interactive way to engage the audience.
Furthermore, the term data journalism often goes along with open data journalism,
Neylan, Senior Designer at Microsoft, a unique insight “(…) and the result of the tools
that allow us to access, probe, poke, prod, dissect, visualize, and hopefully, make sense
of it” (Chiasson & Gregory, 2014, p.XII).
2.1.2. Precision journalism
Whenever reading or hearing about data journalism the term precision journalism is
called out and referred to. The reason is the similar idea and approach to journalism,
because the science sector merges powerful tools of data gathering and analysis. The
gained data represents the most verifiable way to investigate and display the “truth” in a
disciplined way. Hence, data journalism has an equal approach as precision journalism
when gathering facts and creating stories because according to Meyer, it is (2002,
p.235):
“(…) a way to expand the tool kit of the reporter to make topics that were previously inaccessible, or only crudely accessible, subject to journalistic scrutiny. It was especially useful in giving a
hearing to minority and dissident groups that were struggling for representation.”
Nevertheless, the idea of providing a good level of objective, scientific facts, in order to
stay credible, is not a recent thought. In 1922 already, Walter Lippmann (1965, p.216)
wrote “The more points, then, at which any happening can be fixed, objectified,
mea-sured, named, the more points there are at which news can occur”. With this statement,
he pointed out the importance and dependence of available objective facts and
journal-ism. This approach to journalism and the idea of precision journalism is connected to
Julian Assange’s vision of a new standard - scientific journalism. He supports and
ac-tively empowers the idea of working scientifically and provides information or data,
combining and putting them into context with journalistic storytelling skills.
Referring to Philip Meyer (2002, p.6), precision journalism was born in the 1970’s, with
the aim to move stories and journalism more towards scientific topics. The movement
was motivated and supported by the increasing availability of computers, which could
manage and process large amounts of data. Meyer also stated that this journalistic form
was a response to Tom Wolfe’s new journalism, which lacked objectivity and imposed
personal viewpoints on the reader.
As a result, the scientific methods proposed by Meyer provide an objective and precise
gath-ered by making use of these social science methods, represent the fundament of data
journalism because it includes practices for the data collection, documentation, analysis
and precise presentation of the findings. Due to that the gathered datasets and numbers
reach a higher credibility and accuracy and make a story less vulnerable and more
transparent.
Summary
With precision journalism an ongoing trend has been established that gives reporters the
chance to produce more fact oriented and less tenuous articles by using scientific
meth-ods. In order to produce stories, journalism can make use of tools from social science
and scientific research methods, which are accepted as truthful. This is the reason why
Meyer suggests, using and adopting scientific techniques and their “objectivity” to the
process of mass communication, to increase depth and accuracy in journalistic stories.
2.1.3. Data journalism process
The process and components of data journalism were already mentioned and
empha-sized in the terminology. This part takes a practical viewpoint and describes different
models and workflows to produce a data story. These were taken into account and used
to create the article Dark Horse Vietnam (Appendix 7).
When engaging in data journalism, it is important to know how to correctly deal with
data. The reason is that, considering Meyer (2002, p.6) it provides “(…) the essence of
precision journalism”, which results in quality data journalism. Meyer’s idea of putting
precision journalism into practice consists of two main phases: input and output phase.
The goal during the input phase is to collect and analyze data, while the output phase is
used to prepare the data for the “(…) entry into the reader's mind” (Ibid.). Furthermore,
he divided the two main phases in six smaller steps, in which he states how to deal with
data:
1. Collect it: You do not need to become a scientist but it is important to know
their tricks and methods to collect data.
2. Store it: Choose a computer rather than stacks of paper to store your data.
3. Retrieve it: By making use of the tools of precision journalism, every kind of
4. Analyze it: Find interesting anomalies, but look also for patterns, correlations
and implied causations.
5. Reduce it: Reducing the data is as important as the data collection, to show
what was included and what was left out.
6. Communicate it: “A report unread or not understood is a report wasted.”
(Meyer, 2002, p.7)
Steve Doig’s concept to tackle a data project is similar to Meyer’s idea of the process of
precision journalism. Doig gives three essential points, which need to be followed in
order to understand and work with the data before a journalist can deliver the data or
story. Referring to him (Gray, 2012, pp.153-156), the first step is to list questions and
ideas that should be looked at before the data is requested and researched. After that, the
collected data needs to be cleaned, since it still contains unnecessary data and will not
answer the questions asked before. The last step, is that the fact that data may have
undocumented features. He points out, that for example due to newly created codes
some elements might not be documented in the data dictionary. In this case, the data
dictionary, in this case represents an archive of all used components, their meaning and
description.
Mirko Lorenz presented a similar approach to the process of creating a data story. In a
presentation (Lorenz, 2010), which the information architect and journalist gave at the
7th Conference on Innovation Journalism, he pointed out five main points in the data
journalistic workflow process. Lorenz stated that the process starts with (1) digging into
the (big) data and the need to gather and clean it, in order to give it a structure to work
with. In the next step, (2) information should be mined and filtered to understand it and
find patterns or anomalies. After accomplishing that, (3) the visualization process
be-gins in which an adequate visual solution in a graphical or multimedia presentation has
to be chosen. In the final two phases, (4) the
prod-uct needs to connected to the classic storytelling to
appeal to the audience and ultimately (5) media
needs to be created, that provides a certain value for
the audience. In addition, to this process, Lorenz
(2010) also emphasized that each point has a certain
The graphic summarized the process in four major phases, which have an increasing
value to the public from Data to Filter over Visualize up to the Story.
Another, more detailed model of the data
jour-nalism process was published by Paul
Bradshaw, the Inverted pyramid of data
journalism (fig. 2). With the model, Bradshaw
supports the approaches described above by
giving five important stages to make a
compel-ling data story:
1. Compile: This is the fundamental and most important stage, since everything
rests on the collection of information. Compiling data can take multiple forms
and “(…) defines it as an act of data journalism.” (Bradshaw, 2011)
2. Clean: This step is needed to erase human errors and to convert the data into an
interchangeable format to make it usable to everybody.
3. Context: It is important to have a clear question that helps to ensure not to lose
focus and compile further data in order to contextualize them with the question.
4. Combine: Single datasets can offer a good story, but often a good story is the
result of two or more datasets combined.
5. Communicate: It is important to visualize the results of the previous steps on
for example charts, animations or infographics.
Step number five (communicate) leads to an extension of the model of the inverted
pyramid, which Bradshaw describes as the pyramid of the communication process. It is
still part of the model of the inverted pyramid and consist of six different types: (1)
Visualize, (2) Narrate, (3) Socialize, (4) Humanize, (5) Personalize and (6) Utilize.
Each of these types is explained more detailed in the chapter visualization process. In
addition to the model, Bradshaw published a flowchart that puts its emphasis on
“gathering data” (fig. 3). The graphic helps to identify the best ways of getting hold of
Also Simon Rogers (2013,
p.288-289) published a
model of the process to
create a data story, which
is based on his practical
experience at The
Guardian. This workflow
shows the steps that
hap-pen in their newsroom and
is displayed in fig. 4. The
flowchart by Mark
McCormick and Simon
Rogers describes and
dis-plays the cycles of creating a data journalistic story at The Guardian. Simon Rogers
(2011), summarized the points seen in the model and wrote in addition to the processes
in the visualized in the workflow:
• We locate the data or receive it from a variety
of sources, from breaking news stories,
govern-ment data, journalists' research and so on
• We then start looking at what we can do with
the data - do we need to mash it up with
an-other dataset? How can we show changes over
time?
• Those spreadsheets often have to be seriously
tidied up - all those extraneous columns and
weirdly merged cells really don't help. And
that's assuming it's not a PDF, the worst
for-mat for data known to humankind
• Now we're getting there. Next up we can
actu-ally start to perform the calculations that will
tell us if there's a story or not - and then sanity
check them to see if it just sounds wrong
• At the end of that process is the output - will it
be a story or a graphic or a visualization, and
After presenting the different models of the general process and real life practice
work-flows, it can be said the approaches, ideas and general mindset towards the process of
data journalism and precision journalism is very similar. In all models, reliable data is
the base, which needs to be put into perspective and into practice to create an appealing
data story.
Summary
Overall, the models have all a similar approach and follow similar steps to tackle data
and to create data stories. All of them start with gathering data, which is cleaned and
filtered so it can be put into context in order to create a data journalistic product to
communicate the story in the best and most appropriate way. It is crucial to keep the
story that needs to be told relevant by keeping it as a common thread throughout the
whole process. Nevertheless, all of the presented models and workflows might miss
specific tools and be incomplete. Due to this, the charts are constantly discussed,
up-dated and should be considered as approaches, which help to create a data journalistic
product.
2.1.4. Open data
The importance of open data to data journalism was mentioned briefly before when
referring to Simon Rogers model of open data journalism. It is essential because the
access to data, platforms or applications is needed to get and scrape information to
cre-ate a compelling data journalistic story.
The term open data combines a “(…) technological meaning and its philosophical
meaning - with a focus on raw, unprocessed information that allows individuals to
reach their own conclusions” (Robinson and Yu, 2012, p.189). They also added that in
the past scientist used this term in reference to unprocessed and raw data. The Open
Knowledge Foundation (n.d.) agrees with the approach of open data and defines it like
this: “Open data is data that can be freely used, re-used and redistributed by anyone -
subject only, at most, to the requirement to attribute and sharealike”. The Handbook
further summarizes the most important details in the following points and emphasizes
the importance of the compatibility of different systems and organizations to
interoper-ate with each other. As in the case of open data, it is the ability to work and interoperate
• available and accessible: The whole data must be available. Preferably by
downloading it in a convenient and modifiable form over the Internet.
• re-useable and redistributable: They should have permission to be re-used and
re-distributed and also enriched by mixing it with other datasets.
• universal participation: Absolutely everyone must be able to access and work
with the data. There should be no restrictions in non-commercial or
commer-cial use.
In practice, this means there are plenty of stories out there in data formats, and just like
Jonathan Stray of the Overview Project said: “You don’t need new data to make a
scoop”. This statement already shows the process of democratization that is currently
happening, and has happened over the last years. It further indicates the need to
democratize data by making it available and easily accessible for the citizens or
audi-ence. Thereby, the audience can assure that the data, which forms the basis of the
sto-ries, is not biased in order to reach a specific conclusion. In fact, the publication of the
used data is important to interact with the reader and get feedback or helpful tips.
Subsequently, this input by the audience, might lead to follow up stories, which
encour-ages readers and increases the chance that the readers return to consume more news
products and/ or provide new sources. Especially as students or teachers sometimes
have access to materials and can provide sources that are interesting to research and can
add value or a new angle to a story. Therefore, it is important to make the data used for
a story available and open. Currently, most of these sources are public and
govern-mental institutions, which are obliged to publish data so the citizens can access them.
One source for institutional data is for example Eurostat by the European Commission.
Other than that, the past also showed that insider can provide data, which are then
pro-cessed and published like the SIGACTS by WikiLeaks, for example.
Nevertheless, sometimes it happens that data cannot be downloaded from an open data
source or the institution of interest. In these cases, there are different other possibilities
to get the information and data, in case it was recorded. The easiest way is to simply ask
for the information at the public institution, which could keep the data of interest. If the
public or governmental institution recorded the wanted data, these datasets need to be
accessible for everybody and have to be published. This also can be forced by making
use of a Freedom of Information (FOI) request. A FOI of request can be separated in
was collected by a public body and (3) to authorities to collect data on your own
(Egawhary & O’Murchu, 2012).
Summary
In general, it can be said that the essential meaning of open is free and in connection to
open data, this means free access to information and knowledge, which can be used,
modified and shared amongst the users. Furthermore, it represents the foundation for
open data journalism and provides the components for the story.
2.1.5. Problems of data journalism
Data and precision journalism can also cause problems if done wrong because all too
often people and journalists just blindly believe data without questioning its quality.
Paul Bradshaw also addresses this point in the phase context, by stating that information
and data cannot always be trusted and further, “[l]ike any source, it should be treated
with skepticism; and like any tool, we should be conscious of how it can shape and
re-strict the stories that are created with it” (Gray, 2012, p.3). Moreover, he states the
information and data have a specific background, which is biased and follows an
objec-tive.
“So like any source, you need to ask questions of it: who gathered it, when, and for what purpose? How was it gathered? (The methodology). What exactly do they mean by that? You will also need
to understand jargon, such as codes that represent categories, classifications or locations, and
specialist terminology.”
Ben Goldacre (2008) presents the “cherry picking” in science and ways to support their
ideas of a wanted result of a case or trial, which shows that data is not completely
objec-tive. In fact, it is important to look at and approach data with a certain amount of
skepti-cism and look for its origin. Therefore, journalists need to check the data like they check
their sources and understand scientific methodologies.
However, there are other problems that can appear when looking at verification of data
sources. The main risks that Alejandro (2010, p.24) mentions for newsgathering and
distribution concern “(…) the accuracy, the need for verification and the loss of control
over the information”. In particular, when working with social media this problem
ap-pears when scraping data from social networks (Silverman, 2014, p.8). Up until now,
to get credible information. But, in recent years these organizations increasingly turn
towards the public as a source for information, opinions and perspectives. In order to,
achieve a virtuous and credible communication circle, journalists need to triangulate
different sources and verify conflicting information. The process, to verify information
from blogs or tweets is often crucial, especially during natural disasters, for instance.
Live reports posted during catastrophes are usually liable to misperception due to fear or
panic, which might pervade all sides and/ or perspectives (Silverman, 2014). In general,
social media leads to events but journalists have to track down the details the
old-fash-ioned way by getting in touch with institutions, for example. Just like in traditional
journalism, you need to ask the right questions to overcome most problems of data. This
approach was also supported by a presentation of the data journalist Henk van Ess,
when mentioned three main questions that should be asked. (1) What are the data rules
are? (2) What and why is something missing? And finally, (3) did they change the
rules?
These questions apply to the data provided by many institutions and companies. In van
Ess’s example (2013), he refers to a statistic and article (Erny, 2013), which shows the
decrease in train accidents in Switzerland. But this change is a result of a change in
definition of a train accident by the Swiss Ministry of Transport. To be more specific,
accidents in Switzerland are not listed when the minimal damage is lower than a
spe-cific counter value. This amount increased from 1975 to 2008 from 5.000 to 100.000
CHF, which consequently resulted in a massive decrease of train accidents from 2007 to
2008. This picks up and supports Bradshaw’s idea to question the information, in order
to understand the data and put it into context.
Unfortunately, the verification of data collides with a problem stated by Steve Doig
(Remington, 2012), which is that journalist all too often make mathematical mistakes,
for example when mixing up correlation and causation. In this case, it is important to
know or learn that correlation does not imply causation. He reasons these kinds of errors
with the “math-clumsiness” (Remington, 2012) of journalists and recommends reporters
and journalists to have a basic understanding of math, to find and tell a data story in the
correct way.
Summary
exam-to be questioned. As with every source it needs exam-to be verified and not all data auexam-tomat-
automat-ically implies facts. Due to that, it is crucial to be able to deal with data and have a
gen-eral understanding of scientific approaches. If this is achieved, the journalist is able to
stay credible by using reliable data.
2.1.6. History of data journalism
Journalism has been going through a continuous change over the last decades, not only
regarding types of media that are used but also in reporting and dealing with the
audi-ence. After the shift in media from newspaper to radio and to television, methods and
purposes of journalism needed to be adjusted and reinvented every time, to make them
suitable for each type. The role of the media has drastically changed in the recent years,
which will be picked up in the following parts that deal with the transition to digital
journalism and the resulting evolution of data journalism.
2.1.6.1. Transition to digital journalism
As mentioned, news media and press has changed throughout history and had to adjust
to the new forms of media that also changed its role. While in the past, the press and in
particular the printing press, saw its role as a gateway or gatekeeper that selects specific
topics, which were then printed (Lippmann, 1965, p.192). This role has changed today,
as a result of recent developments and the emergence of the Internet. Moreover, the web
2.0 and social networks also challenged traditional media as being a gatekeeper and sole
source of objectivity, quality and authority (Beckett, 2008). As Jennifer Alejandro
(2010) stated, the story about Michael Jackson’s death of is an example of
“(…) how social media has breached the gap between traditional media and the consumers (audi-ence). It proved that the gatekeeper role is no longer exclusive to journalists as the participatory
culture of social media about engaging the audience has broken down the wall of journalism
which separates the reader from the journalist”.
With the appearance of the Internet, another novelty occurred because the perception of
news media by the audience changed significantly, from passive to active and currently
a fragmented audience (Biocca, 1988). Furthermore, referring to Bardoel and Deuze
(2001, pp.91-103) the audience became better educated as producer and consumer of
active way. The increased availability of computer and Internet supported the audience
to become a producer and a consumer of news or content in general, which altered the
landscape of journalism and minimized the relevance of the gatekeeping model.
Hence-forth, journalists were no longer the filtering element that had to pass on information
that is worthy of discussion in the public sphere. As a matter of fact, the Internet
en-abled news way to interact, which changed the style of reporting but also opened up
new resources for research. Moreover, it brought up new tools for journalists to
communicate stories by producing images, videos or graphics and sharing them with a
global community. The new opportunity to present a story supported by multimedia
elements, brought a new narrative approach to tell a story in an appealing and engaging
way. Furthermore, the digital technology affected and changed the news industry like
the Pew Research Center (2012) report,
Trends in News Consumption: 1991-2012
shows (fig. 5). The survey shows, that news
media like print, radio and even TV are
becoming less attractive as a source for news
for the audience. Also mobile news are rising
and overtook print and radio news in 2012 as
news source. Due to the decline in print
editions and the circulation, some newspapers
partnered their print edition with an online
edition, while others focused fully on the
online edition, eliminating its physical
counterpart. Without getting into detail too much, this also affected the journalists since
they had to adjust the style of writing to the online and/ or print edition. When
presenting stories online, journalism no longer had to be linear and could break up the
story into smaller parts. This gave the audience the possibility to explore and consume
sections according to their interest. Subsequently, the web-centric approach became
increasingly important, resulting particularly in the mobile consumption of news. This
approach also resulted in a constant news flow because breaking news can be covered
and send out in a 24/7 news cycle.
Accordingly, to the development of mobile news consumption, it is also unavoidable to
get-ting increasingly important like a recent study on the use of smartphones in the U.S.
(Smith, 2015) showed. In particular the Millennials are heavy users of portable devices.
Wherever they go: 67% of this specific age group reportedly used smartphones to
ac-cess the Internet. That compares with 40 percent of baby boomers and just 20 percent of
silents. Furthermore, 82 percent said that they access the Internet with laptop computers
and 47 percent with tablets (up from 26 percent in 2012), both significantly higher than
older generations.
Nevertheless, the competition is huge when considering official websites of institutions
or organizations and especially the attention social networks and media gets form the
side of the consumers. In reference to the report mentioned before, 19% of all
Ameri-cans have acquired news through a social networking site. Correspondingly, to the
interactive nature of the web 2.0 and social media user started to produce and spread
content on their blogs, forums or through social networking sites. Modern, digital
journalism needed to adapt to this change by participating and working closer with the
audience than before. The social networks were not only a place to publish or share
news in order to pull user to the news site; it further became a source of news.
As a result of the immediacy of the social networks, journalism needed to adjust and
accelerate the traditional journalistic process because the audience expects live and
al-most real time updates on events and happenings (Alejandro, 2010). Furthermore, the
nature of the journalist has changed and the traditional roles such as photographer,
edi-tor or reporter are merging. So the digital journalist becomes a “one-man band”
(Alejandro, 2010, p.34) that combines all of the roles in the production of stories for
papers, websites, radio or TV.
The mentioned immediacy is further pushed forward due to the increase of news
consumption on mobile devices (Smith, 2015). The reason is that mobile computing, the
increase in connectivity and the powerful tools such as smartphones, tablets or phablets
changed the way to gather, store and deliver stories. Due to that, it is unavoidable to get
around ways to consume news on mobile devices and deliver live updates on events.
Summary
The major change resulting the emergence of the Internet is the changed role of the
journalist but it also provided new tools and possibilities, which now need to be dealt
cannot all be covered by this thesis and neither this chapter.
However, as stories and news become non-linear and new sources emerge, which are
easy to access through the Internet, journalism has changed and will change. Moreover,
news media organizations are no longer the monopoly of journalism and companies
such as Google or Twitter will engage in competition with journalism. Due to that news
companies try to adapt to this change and make use of the new opportunities of social
media and the web 2.0 offer but they also raise the chances to engulf them in a
profes-sional crisis.
2.1.6.2. Evolution of data journalism
The Internet was a real game changer to the news media and has revolutionized the way
information is published, stored and consumed. The emergence of the web and its
grow-ing importance also affected people’s everyday life. Nowadays, almost everythgrow-ing is a
collection of numbers - zeros and ones in binary codes. For example, the U.S. Postal
Service (Nixon, 2013) produces big data by photographing and keeping record of every
piece of paper mail from the outside. Another example, are electronic medical records
(Robertson, 2013) in the healthcare sector that contain the complete medical history of a
person or the mentioned mobile maps, which help people to navigate. In all of these
cases, a big amount of raw data is produced, which is continuously growing and
col-lected by different institutions. The development towards data journalism is closely
re-lated to the boost in information and technology over the past years, because the
digitalization of almost every process in everyday life is recorded and this huge chunk
of digital data and information offers new possibilities, which need to be explored.
The phenomenon of data journalism is not completely new and in the past, data
journal-ism was not related to and based on computers and the Internet, as it is today. This
proves the data story, published on the 5th of May 1821 by The Guardian (Manchester Guardian). The story is about the amount of students that received free education and
the poor children that lived in the city. The story gets supported with a table that shows
“(…) a list of schools in Manchester and Salford, with how many pupils attended each
one and average annual spending” (Rogers, 2013, p.60, Appendix 2). So, neither data
stories, nor the visualization of data are recent inventions like people such as Florence
which display the mortality of the British army in the east. The history of data
visualiza-tion is dealt with in a chapter 2.2.2. and describes the historical development in detail.
Although data journalism is not completely new, it experienced a boost in its growth
and importance due to the global interconnection by the Internet and the appearance of
computers and their high performance in information processing. Moreover, it affected
and changed the work and role of the journalist, because “[b]y using data, the job of a
journalist shifts its main focus from being the first ones to report to being the ones
tell-ing us what a certain development might actually mean” (Gray, 2012, p.4).
Further-more, the interactive characteristic of the Internet offers the possibility for everybody to
generate content, which consequently changed the involvement and relationship
be-tween journalist and the audience entirely. Before, the audience could only provide
feedback writing letters or getting in touch via telephone. The new situation resulted in
an increase of user-generated content from for example disasters like the Typhoon
Haiyan or prior to that, the Sumatra-Andaman earthquake, which resulted in a massive
tsunami in 2004.
In the following, the news and content were easier to access and distribute because
so-cial networks provided a network through which content could be shared and spread
quickly. This leads back to the point of interaction between audience and journalist
be-cause both are “just a click away” and can communicate almost instantly.
With the increase of popularity of user generated content and the user-based or citizen
journalism, the term and definition of a journalist also changed. The digital age and the
Internet provide a possibility to gather and collect news and information without having
to rely on individual journalists anymore, like the news site of Google. But, the
characteristics of the Internet did not only change the consumption and perception of the
audience, it also opened up a new resource for information and field to exploit. News
were not limited to physical distribution anymore and could be published online. This
novelty changed the way to communicate stories and put the journalist in a position to
use different ways or channels to mediate news. Multimedia approaches in which text,
videos, graphics and photos are used to tell a story like the recent example “SEAL Team
6: A Secret History of Quiet Killings and Blurred Lines” (Mazzetti et al., 2015) of The
New York Times shows. In addition, interactive applications added a new way to
A further change and advantage of the new virtual form to distribute made it possible to
measure and analyze the consumption of articles on the online appearance of the news
site. Furthermore, the social networks amongst other examples can be analyzed, like the
case of the 2011 UK Riots (Rogers, 2013, pp.245-267) shows, to give background
information on a current event. In addition, to these new possibilities and sources that
the Internet offers are databases, which contain big data and huge amounts of
infor-mation. This boost reinforced a more specialized form of journalism that was able to
cope and work with this new resource.
Another aspect that empowered the development of data journalism was the idea of
open data. In accordance to its progression data journalism experienced a push, when
the European Commission initiated the so-called PSI Directive - Directive 2003/98/EC
(European Commission, 2003, 2015). With the implementation, the member states
started to provide data and information openly for re-use, which could be used by
journalists to find stories and present them. By that journalists gained a new way to
edu-cate people, pass on knowledge and facts in form of datasets and visualizations. This
open data approach is considered a fundamental component in (open) data journalism.
In consequence to, the change of journalism, the described style of journalistic work and
the new resources, a revival of watchdog journalism was triggered. Because it is
“journalism that gives power to the people” (Ward, 2014), referring to Orlando Sentinel
editor Charlotte Hall. The Poynter Institute also refers to the conference Creating A
Watchdog Culture: Claiming An Essential Newspaper Role, at which they stated that
watchdog journalism is quality journalism, which needs to be better accessible and
more exploitable. The Internet enabled an easier accessibility and higher connectivity,
which also progressed data journalism further.
In the past days, data could only be published and accessed through books. Today, this
data is provided in tables or spreadsheets, which can be accessed and processed by
everybody with a computer and asking questions to the provided data. The increasing
popularity of the Internet changed journalism in many ways but did not affect the work
of journalists as drastically, considering a presentation by Simon Rogers (2015) on open
data journalism. He points out that the reporters main tasks and skills have not changed
at all by saying that the general work of a journalist is to, investigate, research, write