Dietary patterns during pregnancy and the
association with sociodemographic characteristics
among women attending general practices in
southern Brazil: the ECCAGe Study
Padrões alimentares na gestação e associação com
características sociodemográficas em mulheres
atendidas em unidades básicas de saúde no
Sul do Brasil: Estudo ECCAGe
Padrones alimentarios en la gestación y su asociación
con características sociodemográficas en mujeres
atendidas en unidades básicas de salud en el
sur de Brasil: estudio ECCAGe
1 Universidade Federal do Rio Grande do Sul, Porto Alegre, Brasil.
2 Universidade do Vale do Rio dos Sinos, São Leopoldo, Brasil.
3 Universidade Federal de Ciências da Saúde, Porto Alegre, Brasil.
Correspondência J. F. Hoffmann
Universidade Federal do Rio Grande do Sul.
Rua Ramiro Barcelos 2600, 4o andar, Porto Alegre, RS 90035-003, Brasil.
Juliana Feliciati Hoffmann 1 Maria Angélica Antunes Nunes 1 Maria Inês Schmidt 1
Maria Teresa Anselmo Olinto 2,3 Cristiane Melere 1
Silvia Giselle Ibarra Ozcariz 1 Caroline Buss 1
Michele Drehmer 1 Patrícia Manzolli 1 Rafael Marques Soares 1 André Poyastro Pinheiro 1 Suzi Camey 1
Abstract
The assessment of the relationship between food intake and sociodemographic factors is crucial for developing effective public health policies. The present study aimed to examine dietary pat-terns in pregnant women and the association between these patterns and sociodemographic characteristics. Pregnant women attending gen-eral practices in southern Brazil (n = 712) an-swered a questionnaire and a food-frequency questionnaire with 88 items. Three dietary pat-terns were identified using cluster analysis. The association between the dietary patterns and sociodemographic variables was analyzed using the chi-square test and adjusted standardized re-siduals (p < 0,05). The restricted pattern was as-sociated with lower maternal age, not living with a partner and being a non-working student. The varied pattern was associated with older mater-nal age, living with a partner, being employed and higher levels of education and income. The common-Brazilian dietary pattern included tra-ditional Brazilian food items and was associated with lower levels of education and income, being unemployed and being a non-student.
Pregnant Women; Diet; Food Habits
Resumo
A avaliação do consumo alimentar e das condi-ções sociodemográficas é crucial para o desen-volvimento de políticas públicas. Este estudo examinou os padrões alimentares em gestantes e sua associação com características sociodemo-gráficas. Gestantes (n = 712) atendidas em uni-dades básicas de saúde no sul do Brasil, respon-deram a um questionário sobre as características sociodemográficas e a um outro de frequência alimentar. Foram identificados três padrões ali-mentares por análise de cluster. Utilizando-se o teste qui-quadrado com resíduos ajustado ve-rificou-se a associação dos padrões alimentares com as variáveis sociodemográficas (p < 0,05). O padrão restrito foi associado com gestantes mais jovens, que não moram com o companheiro e só estudam; o padrão variado com mulheres mais velhas que moram com o companheiro, traba-lham e têm níveis de escolaridade e renda mais altos. Mulheres que não trabalham nem estu-dam e possuem níveis de renda e escolaridade mais baixos estiveram associadas ao padrão comum-brasileiro, caracterizado por alimentos tradicionais da população brasileira.
Introduction
The human diet involves the simultaneous intake of a variety of nutrients and foods that are highly correlated and may have synergistic and inhibi-tory properties 1,2. These interactions may hinder the detection of possible associations between specific foods and health outcomes 2,3. Dietary preferences are also influenced by cultural, social, economic and environmental determinants 4.
Research has demonstrated that healthy eat-ing habits dureat-ing pregnancy affect fetal devel-opment and contribute to prevent pregnancy complications 5,6 and the occurrence of diseases in adulthood 7. An appropriate diet helps
recov-ery from childbirth and favors breastfeeding 8. Additionally, pregnant women pay more atten-tion to diet and food choices than nonpregnant women 9; thus pregnancy is an ideal time to make
changes to dietary habits 10. Dietary patterns during pregnancy have been associated with nu-tritional intake, sociodemographic characteris-tics and outcomes for babies 8,11,12,13,14,15. Dietary
patterns rich in vitamins, minerals and proteins are associated with higher birth weight 13. Older women with a higher level of education are more likely to follow a healthy diet and prevalence of pregestational overweight is lower in this group
8,12,14. It has also been shown that increased par-ity, prepregnancy maternal overweight, being single and unemployed and smoking are factors associated with unhealthy dietary patterns dur-ing pregnancy 12,14.
A study carried out in the Southern Region of Brazil also pointed to a positive association be-tween diet and socioeconomic status, showing that women of higher socioeconomic status are more likely to follow a healthy diet 16. However, a study of a cohort of young adults demonstrated that, although socioeconomic status affected di-etary patterns, having a higher level of education or higher income was not a protective factor for healthy eating 17.
Comprehensive nutritional assessment and guidance are not routine during prenatal care in Brazil and medical professionals often lack a comprehensive understanding of the sociode-mographic factors that influence women’s eating habits during pregnancy, thus leading to con-siderable variation in nutritional advice given to pregnant women.
The use of dietary patterns attempts to re-duce the number of variables and provide a meaningful representation of the food nutri-ent combinations of total dietary intake. The analysis of dietary patterns is the ideal tool to identify nutritional risk and appropriate inter-vention 3 and two methods have been used to
identify dietary patterns: a priori and a poste-riori 1,18,19. The priori method scores dietary ad-equacy based on dietary guidelines, whereas the posteriori method uses a set of statistical tech-niques, such as principal component analysis and cluster analysis 1,18,19. Although studies of dietary patterns are becoming more and more common 18,19,20,21,22,23,24 and include pregnant women’s dietary patterns 25,26,27, we were unable to find any studies on dietary patterns in preg-nant women in Brazil.
The objectives of the present study were therefore to identify dietary patterns of pregnant women attending prenatal care in southern Bra-zil and examine the association between these patterns and sociodemographic characteristics.
Methods
Study design
The ECCAGE (Study of Food Intake and Eating Behavior during Pregnancy) is a cohort study
28,29,30,31,32 of 780 pregnant women based on data collected between June 2006 and February 2007. A total of 59 women (7.5%) refused to participate and nine (1.1%) interrupted the interview before completion, resulting in a final sample of 712 women (91.3%). Further details on the study pro-tocol have been published elsewhere 29.
Study participants were consecutively re-cruited from public general practice outpatient clinics and a public maternal and infant health care center located in two cities in southern Bra-zil. The following inclusion criteria were used: receiving pre-natal care at one of the outpatient clinics included in the study; and gestational age between 16 and 36 weeks. No exclusion criteria were used.
The project was approved by the Research Ethics Committee of the Rio Grande do Sul Fed-eral University and all study participants signed a written consent form.
Anthropometric and sociodemographic data
Nutritional status was assessed based on Body Mass Index (BMI). Pregestational weight was in-formed by study participants in response to the question “How much did you weigh before you got pregnant?”. Height was measured following the guidelines of the Brazilian Ministry of Health technical manual with individuals wearing light clothing and barefoot 33. The U.S. Institute of
(18.5 25.0kg/m2), “overweight” (25.0 30.0kg/ m2), and “obese” (BMI ≥ 30.0kg/m2).
The following sociodemographic data were investigated: age (≤ 19 years; 20 to 29 years; ≥ 30 years); family income in number of minimum wages (MW) (≤ 1 MW; 1.01 to 3 MW; ≥ 3.01 MW), considering a MW of US$ 250; cohabiting with a partner (Yes/No); occupational status (student; employed; student and employed; nonstudent and unemployed); years of schooling (≤ 4 years; 5 to 8 years; ≥ 9 years).
Dietary intake assessment
A semiquantitative Food Frequency Question-naire (FFQ), validated for use with pregnant women was administered. A relative validation of the 24-hour dietary recall and the FFQ resulted in a Pearson correlation coefficient of 0.17 for en-ergy intake (p < 0,05). The correlation coefficient ranged between 0.01 (vitamin E, p > 0,05) and 0.43 (vitamin C, p < 0,01) 35.
The FFQ assesses eating habits during preg-nancy and includes eight different options of intake frequency which were converted into the following equivalent values of daily intake: “more than three times a day” = 3; “twice to three times a day” = 2; “once a day” = 1; “five to six times a week” = 0.79; “two to four times a week” = 0.43; “once a week” = 0.14; “once to three times a month” = 0.07; “never/almost never” = 0. The food list comprised 88 items, and standardized portions were provided for each item as an op-tion to assess consumpop-tion. The home measures table 36 was used to define portion size in grams.
The Brazilian Food Composition Table (TACO, acronym in Portuguese) 37 was used to calcu-late the calorie content of each food item; where the TACO did not provide data on a particular food item (14 items) the Tucunduva Table was used 38. In the item “other alcoholic beverages” all alcoholic beverages, except for wine and beer, were considered. Energy intake was categorized into the following quartile values: Q1 = 2,514Kcal, Q2 = 3,356Kcal, Q3 = 4,572Kcal.
Identification of dietary patterns
Twenty-six food items consumed by less than 25% of the sample considered low consumption items and excluded from the FFQ are presented as supplementary data (http://www.mat.ufrgs. br/~camey/dietary_patterns/items_excluded. pdf). Maintaining these items would have led to the creation of a group of “nonconsumers” which in turn could lead to a mischaracteriza-tion of dietary patterns. Cluster analysis was performed to identify dietary patterns using the
k-means cluster option of the SPSS software, ver-sion 13.0 (SPSS Inc., Chicago, USA). The k-means algorithm is the most common non-hierarchical cluster technique in which group homogeneity is measured using the Euclidean distance. Each element of the sample is grouped with the cluster of greatest similarity. To compare the different variables several attempts were made to define the number of groups a priori. The number of groups resulting from this process ranged from two to five and three groups were finally estab-lished as best representing the dietary patterns endorsed by the sample.
We decided to use cluster analysis because this method has an advantage over principal component analysis which allows the division of the sample into mutually exclusive charac-terizeable groups 18. Furthermore, the concept of groups is more intuitive than the concept of factor loadings 39.
Variables included in the cluster analysis were measured as follows:
Crude variables were described using the traditional measure “consumption in grams per day” based on the number of portions consumed per day and the frequency of consumption and the weight (g) of each portion. The percentage of total energy intake (%TEI) for a particular food item is 100 times the ratio between energy intake (EI) of the food and the total energy intake.
Standardized variables consisted of the dif-ference between the value of the crude variable and its mean divided by its standard deviation: i.e, “standardized consumption in grams/day” and “standardized %TEI”.
Ranking variables: “consumption ranking in grams/day” and “ranking of the percentage of to-tal energy intake” (%TEI ranking). To define these variables for each of the food items cases were sorted in ascending order and each case was as-signed a number that indicated its position in this order. The person with the lowest consump-tion was assigned value 1 and the person with the second lowest consumption was assigned value 2, and so on. Cases which had the same value were assigned the value of the mean order.
For all food items, except margarine, garlic and onion, standardization and ranking were used to screen crude and standardized variables for extreme values for consumption. The value was considered extreme when it was above a threshold of 1.5 times the interquartile range (IR) of consumption in grams per day. Cases were dis-regarded if over 30% of the food items showed extreme values, resulting in the exclusion of 65 cases.
group size and those variables that produced patterns with groups with a very small number of individuals were disregarded. The criterion used for the remaining variables was interpretability of dietary patterns.
The distribution of the sample among the clusters according to city, occupational status, age, family income, cohabitation with a partner, level of education and pregestational BMI was compared using the chi-square test where ad-justed standardized residuals greater than 1.96 (α = 0.05) suggested a significantly higher than expected value, thus indicating a statistically sig-nificant positive association between variables 40.
Results
A total of 401 women (56.3% of the total sample, n = 712) lived in the city of Porto Alegre, capital of the State of Rio Grande do Sul, and the majority of the sample (78.5%) were married or lived with a partner. Average age was 24.6 years (SD = 6.4) and the average number of years of schooling was 7.6 years (SD = 2.7). Average family income was 2.6 MW (SD = 1.9) and average pre-gestational BMI was 24.2kg/m² (SD = 4.7). The following three distinct dietary patterns were identified based on the data obtained using the FFQ: restricted, varied and common-Brazilian.
The restricted pattern was characterized by a higher consumption of cookies, whole milk, yo-gurt, chips, finger foods, soft drinks, natural juice, chocolate powder and ice-cream. A large part of the foods in this pattern (42.4%) were not con-sumed by at least half of the women in this group and 9.1% of the food items were not consumed
by over 75% of the subjects, thus revealing the restrictive nature of this pattern, hence the name restricted.
The varied pattern, as the name suggests, comprised a large variety of items, including “grains, cereals and tubercles”, “bread, cakes and cookies”, “fruits” and “vegetables”. In addi-tion, it contained cheese, pizza, mayonnaise, sa-vory pastry, candies, chocolate bars, and sweet puddings.
With respect to the common-Brazilian pat-tern, most of the food items (60.6%) were not consumed by at least half of the participants and 12 foods were not consumed by at least 75% of the participants. These findings suggest that this group only consumes foods that are typical of the Brazilian pattern, hence the pattern’s name.
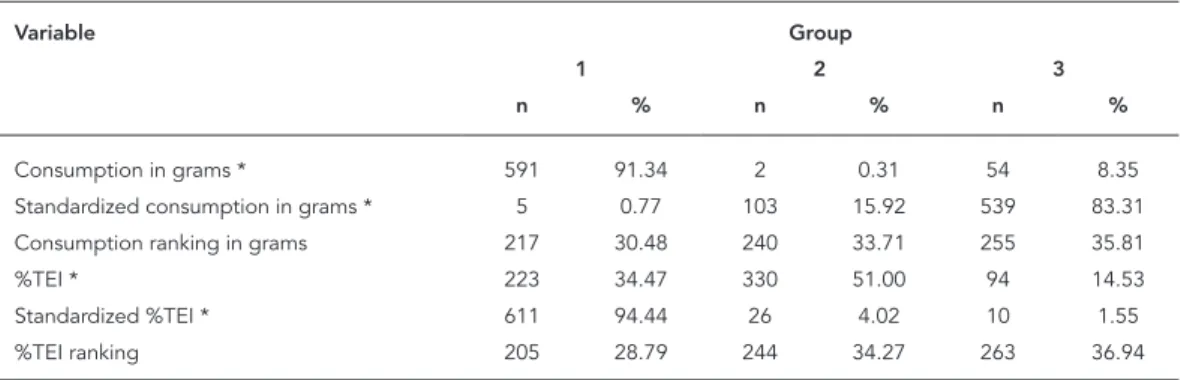
Table 1 shows the number of women in each dietary pattern group based on the six different variables used in the cluster analysis. A table including the food items included in each di-etary pattern identified by the cluster analyses is available as supplementary data (http://www. mat.ufrgs.br/~camey/dietary_patterns/cluster_ analysis.pdf). The most homogeneous groups in terms of group size occurred in patterns gener-ated by the %TEI ranking variable, resulting in more coherent dietary patterns and, therefore, better interpretability.
Table 2 shows the median, 25th and 75th per-centiles (P25 and P75) for %TEI by food type and dietary pattern. Twenty-eight food items in the restricted pattern were not consumed by at least 50% of the participants and six of these foods were not consumed by at least 75% of the women in this group. With respect to the varied pattern, on-ly nine food items were not consumed by at least
Table 1
Number and percentage of pregnant women in each dietary pattern group generated by the six different variables used in the cluster analysis.
Variable Group
1 2 3
n % n % n %
Consumption in grams * 591 91.34 2 0.31 54 8.35
Standardized consumption in grams * 5 0.77 103 15.92 539 83.31 Consumption ranking in grams 217 30.48 240 33.71 255 35.81
%TEI * 223 34.47 330 51.00 94 14.53
Standardized %TEI * 611 94.44 26 4.02 10 1.55
%TEI ranking 205 28.79 244 34.27 263 36.94
TEI: total energy intake.
Table 2
Description of the dietary patterns of pregnant women according to %TEI of each food item in TEI (n = 712).
Food groups/Foods Dietary pattern *
Restricted (n = 205) Varied (n = 244) Common-Brazilian (n = 263)
Median P25 P75 Median P25 P75 Median P25 P75
Grains, cereals and tubercles
Cassava 0.00 0.00 0.51 0.88 ** 0.37 1.61 0.00 0.00 1.00
Rice 3.57 2.23 5.84 4.55 2.58 6.95 6.33 ** 4.14 9.29
Boiled potato 0.14 0.00 0.72 0.71 ** 0.29 1.49 0.48 0.00 1.27
Beans 3.67 1.28 6.98 3.91 1.44 7.69 5.89 ** 2.73 10.49
Lentil 0.00 0.00 0.19 0.16 ** 0.00 0.34 0.00 0.00 0.22
Pasta 1.15 0.41 2.73 1.69 0.72 3.00 1.96 ** 0.87 3.43
Corn 0.00 0.00 0.22 0.00 ** 0.00 0.33 0.00 0.00 0.00
Popcorn 0.00 0.00 0.76 0.67 ** 0.00 1.69 0.00 0.00 1.06
Polenta 0.00 0.00 0.28 0.51 ** 0.18 1.01 0.00 0.00 0.70
Bread, cakes and cookies
Cookie 0.73 * 0.00 3.37 0.33 0.00 1.57 0.00 0.00 1.33
Salty pastry 0.26 0.00 2.31 0.49 ** 0.00 2.29 0.00 0.00 1.35
Cake 1.27 0.00 2.51 1.42 ** 0.00 2.74 0.00 0.00 1.98
French roll 12.51 6.12 18.16 8.18 1.71 15.70 13.63 ** 5.13 22.41 Homemade bread 0.66 0.00 4.16 1.68 ** 0.00 7.35 0.94 0.00 4.63
Fruits
Pineapple 0.00 0.00 0.11 0.00 ** 0.00 0.29 0.00 0.00 0.00
Banana 1.57 0.42 3.39 1.66 ** 0.63 3.40 1.40 0.00 3.15
Orange 1.27 0.16 4.16 2.31 ** 0.78 5.42 1.13 0.00 4.42
Lemon 0.00 0.00 0.00 0.00 ** 0.00 0.01 0.00 0.00 0.01
Apple 0.51 0.00 1.77 1.17 ** 0.38 2.52 0.31 0.00 1.40
Papaya 0.16 0.00 0.88 0.52 ** 0.00 1.79 0.00 0.00 0.00
Mango 0.16 0.00 0.52 0.18 ** 0.00 0.45 0.00 0.00 0.00
Watermelon 0.00 0.00 0.28 0.10 ** 0.00 0.60 0.00 0.00 0.00
Grape 0.00 0.00 0.94 0.00 ** 0.00 1.17 0.00 0.00 0.00
Vegetables
Lettuce 0.07 0.00 0.19 0.14 ** 0.06 0.27 0.09 0.01 0.26
Garlic 0.00 0.00 0.01 0.03 ** 0.00 0.06 0.03 0.00 0.06
Beet 0.02 0.00 0.12 0.10 ** 0.03 0.30 0.00 0.00 0.11
Onion 0.00 0.00 0.07 0.08 ** 0.04 0.13 0.10 0.02 0.14
Carrot 0.00 0.00 0.05 0.08 ** 0.02 0.21 0.00 0.00 0.06
Chayote 0.00 0.00 0.00 0.00 ** 0.00 0.04 0.00 0.00 0.00
Kale 0.00 0.00 0.00 0.13 ** 0.00 0.39 0.00 0.00 0.11
Cauliflower 0.00 0.00 0.00 0.09 ** 0.00 0.26 0.00 0.00 0.00
Cucumber 0.00 0.00 0.00 0.00 ** 0.00 0.01 0.00 0.00 0.00
Green pepper 0.00 0.00 0.01 0.01 ** 0.00 0.05 0.00 0.00 0.04
Cabbage 0.00 0.00 0.03 0.03 ** 0.01 0.08 0.00 0.00 0.04
Tomato 0.13 0.01 0.38 0.26 ** 0.11 0.48 0.24 0.08 0.59
Milk and dairy
Yogurt 1.14 ** 0.32 2.16 0.53 0.00 1.29 0.00 0.00 0.63
Whole milk 6.40 ** 1.60 10.42 5.18 0.38 8.78 3.61 0.00 8.40
Cheese 0.09 0.00 1.31 0.62 ** 0.11 1.47 0.00 0.00 0.40
Table 2 (continued)
Food groups/Foods Dietary pattern *
Restricted (n = 205) Varied (n = 244) Common-Brazilian (n = 263)
Median P25 P75 Median P25 P75 Median P25 P75
Meat, fish and eggs
Bone beef 0.00 0.00 0.32 0.00 ** 0.00 1.60 0.00 0.00 0.95
Boneless beef 3.02 0.97 6.02 3.30 1.48 6.00 3.56 ** 1.59 6.63
Pork 0.00 0.00 0.81 0.42 ** 0.00 1.06 0.00 0.00 0.53
Chicken 1.78 0.64 3.81 2.11 0.90 3.65 2.44 ** 1.00 4.51
Eggs 0.24 0.00 0.89 0.41 0.16 1.08 0.57 ** 0.00 1.32
Fish 0.00 0.00 0.00 0.31 ** 0.00 0.95 0.00 0.00 0.00
Sausage 0.00 0.00 0.19 0.23 ** 0.00 0.52 0.00 0.00 0.61
Offal 0.00 0.00 0.37 0.19 ** 0.00 0.72 0.00 0.00 0.32
Fatty food
Chips 1.48 ** 0.00 4.00 1.37 0.00 4.07 0.00 0.00 2.94
Mayonnaise 0.00 0.00 0.14 0.08 ** 0.00 0.22 0.00 0.00 0.16
Margarine 0.36 0.00 0.92 0.55 0.00 1.02 0.75 ** 0.00 1.20
Pizza 0.00 0.00 1.74 0.89 ** 0.00 1.87 0.00 0.00 0.00
Finger food 1.00 ** 0.00 3.88 0.00 0.00 1.32 0.00 0.00 1.58
Salty pastry 0.53 0.00 1.49 0.62 ** 0.00 1.31 0.00 0.00 0.82 Beverages
Coffee 0.12 0.00 0.63 0.54 0.06 0.89 0.75 ** 0.26 1.30
Soft drink 1.12* 0.00 3.42 0.68 0.00 1.77 1.31 0.00 3.77
Artificial juice 0.00 0.00 1.10 0.47 0.00 1.56 0.96 ** 0.00 2.94
Natural juice 1.60* 0.00 4.18 1.44 0.27 2.90 0.00 0.00 1.88
Sweets
Sugar 5.19 1.83 8.66 5.89 3.04 9.28 7.27 ** 4.02 10.79
Candy 0.00 0.00 0.18 0.00 ** 0.00 0.25 0.00 0.00 0.07
Chocolate bar 0.34 0.00 1.76 0.37 ** 0.00 1.22 0.00 0.00 0.32 Powder chocolate 0.99 ** 0.00 3.20 0.12 0.00 1.19 0.00 0.00 0.51 Sweet pudding 0.00 0.00 0.70 0.34 ** 0.00 1.13 0.00 0.00 0.00
Ice-cream 0.57 ** 0.00 2.19 0.36 0.00 1.15 0.00 0.00 0.37
P25: 25th percentile; P75: 75th percentile; TEI: total energy intake. * Groups resulting from cluster analysis using the %TEI ranking variable; ** Foods with higher mean %TEI ranking among the three dietary patterns.
50% of the women, and all foods were consumed by at least 25% of the participants. With regard to the common-Brazilian pattern, 40 foods were not consumed by at least 50% of the women, and 12 of these items were not consumed by at least 75% of the participants.
Table 3 shows the characteristics of the sample and the association between sociodemographic characteristics, energy intake and pregestational BMI and dietary patterns. The restricted pattern is associated with not living with a partner, younger age, being a nonworking student and high energy intake (above the 75th percentile). The varied pat-tern is associated with older age, cohabiting with a partner, being employed and having a higher family income and educational level. The com-mon-Brazilian pattern is associated with lower
family income and educational level, being un-employed, being a nonstudent and low energy intake (below the 25th percentile).
Discussion
The following three dietary patterns were iden-tified: restricted, varied and common-Brazilian. There was a significant association between the sociodemographic characteristics of study par-ticipants and dietary patterns.
Table 3
Sociodemographic characteristics and pregestational BMI by dietary pattern identified using the %TEI ranking variable (n = 712).
Characteristic Total sample Dietary pattern p-value
Restricted Varied Common-Brazilian
n % n % n % n %
Co-habiting with a partner
No 149 20.9 53 * 35.6 35 23.5 61 40.9 0.006
Yes 563 79.1 152 27.0 209 * 37.1 202 35.9
Family income (minimum wage = US$ 250)
≤ 1 127 17.8 32 25.2 37 29.1 58 * 45.7 < 0.001
1.01-3 370 52.0 105 28.4 111 30.0 154 * 41.6
≥ 3.01 215 30.2 68 31.6 96 * 44.7 51 23.7
Age (years)
≤ 19 181 25.4 85* 47.0 26 14.4 70 38.7 < 0.001
20 to 29 364 51.1 100 27.5 124 34.1 140 38.5
≥ 30 167 23.5 20 12.0 94 * 56.3 53 31.7
Level of education (years)
≤ 4 98 13.8 16 16.3 32 32.7 50* 51.0 < 0.001
5 to 8 352 49.4 104 29.6 110 31.3 138 39.2
≥ 9 262 36.8 85 32.4 102 * 38.9 75 28.6
Occupational status
Student 57 8.0 27 * 47.4 7 12.3 23 40.4 < 0.001
Employed 215 30.2 58 27.0 95 * 44.2 62 28.8
Student and employed 20 2.8 7 35.0 8 40.0 5 25.0
Non-student and unemployed 420 59.0 113 26.9 134 31.9 173 * 41.2 Energy Intake (Kcal) **
< 2,514 178 25.0 39 21.9 59 33.1 80 * 44.9 < 0.001
2,514 3,356 178 25.0 40 22.5 71 39.9 67 37.6
3,356 4,572 178 25.0 45 25.3 65 36.5 68 38.2
> 4,572 178 25.0 81 * 45.5 49 27.5 48 27.0
Pregestational BMI ***
Underweight 29 4.1 12 41.4 5 17.2 12 41.4 0.058
Normal weight 441 62.4 141 32 148 33.6 152 34.5
Overweight 154 21.8 34 22.1 60 39.0 60 39.0
Obese 83 11.7 18 21.7 30 36.1 35 42.2
BMI: body mass index; TEI: total energy intake.
* Significantly (p < 0.05) adjusted standardized residuals (positive);
** Energy intake was classified into four categories, according to quartile values: Q1 = 2,514Kcal; Q2 = 3,356Kcal; Q3 = 4,572Kcal; *** Pregestational BMI classified according to the Institute of Medicine 34.
A similar “high risk-high cost diet” pattern was observed by another study involving women in southern Brazil 24. Elsewhere in Brazil two studies involving a sample of inpatients and a sample of women have also identified similar patterns 22,23.
The varied pattern includes the greatest vari-ety of items and this was the only pattern in which all foods were consumed by at least 25% of wom-en. In Brazil, other studies involving samples of different population groups have found similar
“healthy” 23,24 or “cautious” 22 patterns. Research with pregnant women from Finland and England also identified “healthy” and “health conscious” varied patterns 1,2,3,4,5,6,8,9,10,11,19,41,42.
iden-tified this traditional pattern in the Brazilian population 17,20,21.
This study found no association between dietary patterns and pregestational BMI. Other variables, such as previous pregnancy and age may have influenced this association. The re-stricted pattern is associated with younger preg-nant women who do not live with a partner, and are nonworking students. This group reported higher energy intake and higher consumption of sweets and fatty foods, suggesting that little at-tention is given to eating habits, probably due to a lack of nutritional education. Other research conducted with women in southern Brazil has also indicated a trend of high risk-high cost di-etary patterns among younger women 16.
The varied pattern is characterized by old-er women who cohabit with a partnold-er, are em-ployed and have a higher income and educa-tional level, suggesting a more stable lifestyle and higher socioeconomic status. These findings are in agreement with other studies regarding preg-nant women and other population groups 8,12,16.
Health-related concerns also seem to be more prevalent in this group, since dietary intake in-cluded a large variety of healthy food items.
The common-Brazilian pattern was associ-ated with women who are non-students and un-employed and have a lower energy intake and lower income and educational level. Items such as rice and beans are inexpensive and are part of the basic food basket in Brazil. This explains the high intake of these items in low-income groups, corroborated by the fact that this pattern can be detected in all regions of the country regardless of cultural differences.
The use of the %TEI ranking variable enabled the identification of clearer patterns with greater coherence and avoided the need to exclude cas-es. Although not widely used in studies of dietary patterns, the use of this strategy by the present study proved to be effective. However, the most commonly used variable to describe consump-tion is %TEI and we therefore opted to pres-ent the medians of this variable to facilitate the understanding and comparison of results with other studies.
The use of standardized variables did not pro-vide satisfactory results. The use of this type of variable has been subject to discussion and it has been suggested that nonstandardized variables provide more realistic groups because standard-ization may result in a false influence from small-er food groups 19.
Different methods have been used for a pos-teriori dietary pattern analysis, such as cluster analysis or principal component analysis. Al-though both methods include subjective deci-sions inherent to each researcher, studies have shown that results are similar 18,43. It is noticeable that the patterns identified in the present study concur with published data. While some pat-terns may be replicated in different populations, others are specific to given cultures and ethnical and geographical differences, food preferences and availability lead to a diversity of dietary pat-terns. Such diversity may hinder the replication of results but does not impair the validity of the methods used 41.
Few studies have assessed the replicability and validity of principal component analysis and cluster analysis 19. In the present study, most of the food items with higher median %TEI corre-sponded to those identified using the %TEI rank-ing variable, suggestrank-ing that the observed pat-terns are valid.
One of limitations of this study is the use of the FFQ. Despite being previously validated for use in pregnant women, the Pearson correla-tion coefficient was low, suggesting that it may not have provided an accurate reflection of food intake.
Another limitation is that the study sample was not designed to be representative of preg-nant women in the cities studied. However, the sociodemographic characteristics of the study sample are comparable to those of the popula-tion of pregnant women seeking medical care in the Brazilian national public health system 44.
Resumen
La evaluación del consumo alimentario y de las condi-ciones sociodemográficas es crucial para el desarrollo de políticas públicas. Este estudio examinó padrones alimentarios en gestantes y su asociación con caracte-rísticas sociodemográficas. Las gestantes (n = 712) aten-didas en unidades básicas de salud en el sur de Brasil, respondieron a un cuestionario sobre características so-ciodemográficas y a un cuestionario de frecuencia ali-mentaria. Se identificaron tres padrones alimentarios por análisis de clúster. A través del test chi-cuadrado ajustado con residuos se verificó la asociación de los padrones alimentarios con las variables sociodemográ-ficas (p < 0,05). El padrón restringido fue asociado con gestantes más jóvenes, que no viven con un compañero y sólo estudian; el padrón variado con mujeres más vie-jas, que viven con compañero, trabajan y tienen niveles de escolaridad y renta más altos. Mujeres que no traba-jan ni estudian, y poseen niveles de renta y escolaridad más bajos, estuvieron asociadas al padrón común-bra-sileño, caracterizado por alimentos tradicionales de la población brasileña.
Mujeres Embarazadas; Dieta; Hábitos Alimenticios
Contributors
J. F. Hoffmann participated in data collection, analysis and interpretation, drafting of this article, critical revi-sion of the manuscript for important intellectual con-tent and in the final approval of the published version of this article. S. Camey contributed to in data analy-sis and interpretation, drafting of this article, critical revision of the manuscript for important intellectual content and in the final approval of the published ver-sion of this article. M. T. A. Olinto participated in study conception and data interpretation, critical revision of the manuscript for important intellectual content and in the final approval of the published version of this article. M. I. Schmidt, S. G. I. Ozcariz, C. Melere, C. Buss, M. Drhemer, P. Manzolli, R. M. Soares, M. A. A. Nunes, e A. P. Pinheiro participated in study conception, critical revision of the manuscript for important intellectual content and in the final approval of the published ver-sion of this article.
References
1. Schulze MB, Hoffmann K, Kroke A, Boeing H. An approach to construct simplified measures of di-etary patterns from exploratory factor analysis. Br J Nutr 2003; 89:409-19.
2. Hoffmann K, Schulze MB, Schienkiewitz A, Noth-lings U, Boeing H. Application of a new statistical method to derive dietary patterns in nutritional epidemiology. Am J Epidemiol 2004; 159:935-44. 3. Bailey RL, Gutschall MD, Mitchell DC, Miller CK,
Lawrence FR, Smiciklas-Wright H. Comparative strategies for using cluster analysis to assess di-etary patterns. J Am Diet Assoc 2006; 106:1194-200.
4. Krondl M, Coleman P. Social and biocultural de-terminants of food selection. Prog Food Nutr Sci 1986; 10:179-203.
5. Kaiser L, Allen LH. Position of the American Di-etetic Association: nutrition and lifestyle for a healthy pregnancy outcome. J Am Diet Assoc 2008; 108:553-61.
7. Bojar I, Wdowiak L, Humeniuk E, Błaziak P. Change in the quality of diet during pregnancy in compari-son with WHO and EU recommendations: envi-ronmental and sociodemographic conditions. Ann Agric Environ Med 2006;13:281-6.
8. Arkkola T, Uusitalo U, Kronberg-Kippilä C, Män-nistö S, Virtanen M, Kenward MG, et al. Seven dis-tinct dietary patterns identified among pregnant Finnish women: associations with nutrient intake and sociodemographic factors. Public Health Nutr 2008; 11:176-82.
9. Verbeke W, Bourdeaudhuij I. Dietary behavior of pregnant versus non-pregnant women. Appetite 2007; 48:78-86.
10. Rayburn WF, Phelan ST. Promoting healthy habits in pregnancy. Obstet Gynecol Clin North Am 2008; 35:385-400.
11. Northstone K, Emmett PM, Rogers I. Dietary pat-terns in pregnancy and associations with nutrient intakes. Br J Nutr 2008; 99:406-15.
12. Northstone K, Emmett P, Rogers I. Dietary patterns in pregnancy and associations with socio-demo-graphic and lifestyle factors. Eur J Clin Nutr 2008; 62:471-9.
13. Wolff CB, Wolff HK. Maternal eating patterns and birth weight of Mexican American infants. Nutr Health 1995; 10:121-34.
14. Cucó G, Fernández-Ballart J, Sala J, Viladrich C, Iranzo R, Vila J, et al. Dietary patterns and asso-ciated lifestyles in preconception, pregnancy and postpartum. Eur J Clin Nutr 2006; 60:364-71. 15. Esmaillzadeh A, Samareh S, Azadbakht L. Dietary
patterns among pregnant women in the west-north of Iran. Pak J Biol Sci 2008; 11:793-6. 16. Lenz A, Olinto MT, Dias-da-Costa JS, Alves AL,
Bal-binotti M, Pattussi MP, et al. Socioeconomic, de-mographic and lifestyle factors associated with di-etary patterns of women living in Southern Brazil. Cad Saúde Pública 2009; 25:1297-306.
17. Olinto MT, Willett WC, Gigante DP, Victora CG. Sociodemographic and lifestyle characteristics in relation to dietary patterns among young Brazilian adults. Public Health Nutr 2011; 14:150-9. 18. Hearty AP, Gibney MJ. Comparison of cluster and
principal component analysis techniques to de-rive dietary patterns in Irish adults. Br J Nutr 2009; 101:598-608.
19. Moeller SM, Reedy J, Millen AE, Dixon LB, Newby PK, Tucker KL, et al. Dietary patterns: challenges and opportunities in dietary patterns research an Experimental Biology workshop, April 1, 2006. J Am Diet Assoc 2007; 107:1233-9.
20. Sichieri R, Castro JF, Moura AS. Factors associ-ated with dietary patterns in the urban Brazilian population. Cad Saúde Pública 2003; 19 Suppl 1: S47-53.
21. Sichieri R. Dietary patterns and their associations with obesity in the Brazilian city of Rio de Janeiro. Obes Res 2002; 10:42-8.
22. Marchioni DM, Latorre MR, Eluf-Neto J, Wünsch-Filho V, Fisberg RM. Identification of dietary patterns using factor analysis in an epidemio-logical study in Sao Paulo. São Paulo Med J 2005; 123:124-7.
23. Scagliusi FB, Ferriolli E, Pfrimer K, Laureano C, Cunha CS, Gualano B, et al. Under-reporting of en-ergy intake is more prevalent in a healthy dietary pattern cluster. Br J Nutr 2008; 100:1060-8. 24. Alves AL, Olinto MT, Costa JS, Bairros FS,
Balbinot-ti MA. Dietary patterns of adult women living in an urban area of Southern Brazil. Rev Saúde Pública 2006; 40:865-73.
25. Okubo H, Miyake Y, Sasaki S, Tanaka K, Muraka-mi K, Hirota Y. Nutritional adequacy of three di-etary patterns defined by cluster analysis in 997 pregnant Japanese women: the Osaka Maternal and Child Health Study. Public Health Nutr 2011; 14:611-21.
26. Crozier SR, Robinson SM, Godfrey KM, Cooper C, Inskip HM. Women’s dietary patterns change lit-tle from before to during pregnancy. J Nutr 2009; 139:1956-63.
27. McGowan CA, McAuliffe FM. Maternal dietary pat-terns and associated nutrient intakes during each trimester of pregnancy. Public Health Nutr 2012; 12:1-11.
28. Buss C, Nunes MA, Camey S, Manzolli P, Soares RM, Drehmer M, et al. Dietary fibre intake of preg-nant women attending general practices in south-ern Brazil: the ECCAGE Study. Public Health Nutr 2009; 12:1392-8.
29. Nunes MA, Ferri CP, Manzolli P, Soares RM, Dreh-mer M, Buss C, et al. Nutrition, mental health and violence: from pregnancy to postpartum cohort of women attending primary care units in South-ern Brazil – ECCAGE Study. BMC Psychiatry 2010; 10:66.
30. Drehmer M, Camey S, Schmidt MI, Olinto MT, Giacomello A, Buss C, et al. Socioeconomic, de-mographic and nutritional factors associated with maternal weight gain in general practices in south-ern Brazil. Cad Saúde Pública 2010; 26:1024-34. 31. Soares RM, Nunes MA, Schmidt MI, Giacomello
A, Manzolli P, Camey S, et al. Inappropriate eating behaviors during pregnancy: prevalence and asso-ciated factors among pregnant women attending primary care in Southern Brazil. Int J Eat Disord 2009; 42:387-93.
32. Manzolli P, Nunes MA, Schmidt MI, Pinheiro AP, Soares RM, Giacomello A, et al. Violence and de-pressive symptoms during pregnancy: a primary care study in Brazil. Soc Psychiatry Psychiatr Epi-demiol 2010; 45:983-8.
33. Departamento de Ações Programáticas Estratégi-cas, Secretaria de Atenção à Saúde, Ministério da Saúde. Pré-natal e puerpério: atenção qualificada e humanizada. Brasília: Ministério da Saúde; 2006. (Série A. Normas e Manuais Técnicos).
34. Institute of Medicine. Weight gain during pregnan-cy: reexamining the guidelines. Washington DC: The National Academy Press; 2009.
36. Pinheiro ABV, Lacerda EMA, Benzecky EH, Gomes MCS, Costa VM. Tabela para avaliação de consumo alimentar em medidas caseiras. 5a Ed. São Paulo: Editara Atheneu; 2004.
37. Núcleo de Estudos e Pesquisa em Alimentos, Uni-versidade Estadual de Campinas. Tabela brasileira de composição de alimentos. v. II. 2a Ed. Campi-nas: Universidade Estadual de Campinas; 2006. 38. Philippi S. Tabela de composição de alimentos:
suporte para decisão nutricional. 2a Ed. Brasília: Manole; 2002.
39. Newby PK, Tucker KL. Empirically derived eating patterns using factor or cluster analysis: a review. Nutr Rev 2004; 62:177-203.
40. Callegari-Jacques SM. Bioestatística: princípios e aplicações. Porto Alegre: Editora Artmed; 2003.
41. Hu FB, Rimm E, Smith-Warner SA, Feskanich D, Stampfer MJ, Ascherio A, et al. Reproducibility and validity of dietary patterns assessed with a food-frequency questionnaire. Am J Clin Nutr 1999; 69: 243-9.
42. Slattery ML. Defining dietary consumption: is the sum greater than its parts? Am J Clin Nutr 2008; 88:14-5.
43. Hearty AP, Gibney MJ. Dietary patterns in Irish adolescents: a comparison of cluster and princi-pal component analyses. Public Health Nutr 2011; 13:1-10.
44. Kroeff LR, Mengue SS, Schmidt MI, Duncan BB, Favaretto AL, Nucci LB. Correlates of smoking in pregnant women in six Brazilian cities. Rev Saúde Pública 2004; 38:261-7.
Submitted on 04/Apr/2012
Hoffmann JF, Camey S, Olinto MTA, Schmidt MI, Ozcariz SGI, Melere C, Buss C, Drhemer M, Manzolli P, Soares RM, Nunes MAA, Pinheiro AP. Dietary patterns during pregnancy and the as-sociation with sociodemographic characteristics among women attending general practices in southern Brazil: the ECCAGe Study. Cad Saúde Pública 2013; 29(5):970-980.
http://dx.doi.org/10.1590/0102-311XER010414
A revista foi informada sobre um erro na ordem de autoria do artigo e no nome de um dos auto-res, não detectado em tempo pelos autores por ocasião da revisão da prova de prelo. A ordem e nomes corretos são:
The journal has been informed of an error in the order of the article’s authorship and in one author’s name, undetected in time by the authors during their revision of the proof. The correct or-der and names are:
La revista fue informada sobre un error en el or-den de autoría y en el nombre de un de los auto-res, no detectado a tiempo por los autores durante la revisión de la prueba. El orden y el nombre co-rrectos son:
Juliana Feliciati Hoffmann 1
Maria Angélica Antunes Nunes 1
Maria Inês Schmidt 1
Maria Teresa Anselmo Olinto 2,3
Cristiane Melere 1
Silvia Giselle Ibarra Ozcariz 1
Caroline Buss 1
Michele Drehmer 1
Patrícia Manzolli 1
Rafael Marques Soares 1
André Poyastro Pinheiro 1