RBCDH
Licence Creative Commom CC
Physical education in schools, sport activity
and total physical activity in adolescents
Educação física escolar, atividade desportiva e atividade
física total em adolescentes
Priscila Missaki Nakamura1,2
Inaian Pignatti Teixeira1,2
Camila Bosquiero Papini1,2
Natalia de Lemos1
Murilo Eduardo Santos Nazario2
Eduardo Kokubun1,2
Abstract– Less than half of adolescents reach the recommended 300 minutes per week of physical activity (PA). Physical education classes and sports participation provide opportunities for adolescents to accumulate more time for PA practice; however, little is known about the inluence of these variables on the level of total physical activity of adolescents. he aim of this study was to investigate the association between the prac-tice of physical education (PE) in schools and sports activities (SA) with the pracprac-tice of total PA of adolescents. he study was cross-sectional and involved 467 adolescents of high school (15.8 ± 0.9 years-old) from the city of Rio Claro, in the State of São Paulo. Participants completed the Physical Activity Questionnaire to Older Children (PAQ-C) and questions related to the practice of PE and SA in schools. We performed a logistic regression with p<0.05 using SPSS. Girls had lower prevalence of PA than boys, 9.4% and 26.8%, respectively. Boys who did not participate of PE classes (OR=0.25, 95% CI=0.09-0.66) and SA in schools (OR=0.34, 95% CI=0.12-0.95) were less likely to be active in PA than boys who practiced these activities. he participation in PE classes or engagement in some SA were positively associated with the practice of total PA in boys.
Key words: Adolescents; Physical activity; Physical education.
Resumo – Menos da metade dos adolescentes atingem a recomendação de 300 minutos por semana de Atividade Física (AF). As aulas de Educação Física e participação de esporte proporcionam oportunidades para os adolescentes acumularem mais tempo para a prática de AF, entretanto, pouco se sabe sobre a inluência dessas variáveis no nível de AF total dos adolescentes. O objetivo do estudo foi veriicar a associação entre a prática de Educação Física Escolar (EFE) e Atividades Desportivas (AD) com a prática de AF total em adolescentes. O estudo foi transversal e participaram 467 adolescentes do Ensino Médio (15,8 ± 0,9 anos) da cidade de Rio Claro-SP. Os participantes preencheram o Physical Activity Questionnaire to Older Children (PAQ-C) e questões relacionadas com a prática de EFE e AD. Foi realizada a Regressão Logística com p<0,05 através do SPSS. Meninas apresentaram menor prevalência de AF do que os meninos, 9,4% e 26,8% respectivamente. Meninos que não realizaram EFE (RO=0,25; 95% IC= 0,09-0,66) e AD na escola (RO=0,34; 95% IC=0,12-0,95) apresenta-ram menores chances de serem ativos na AF total do que os meninos que praticaapresenta-ram essas atividades. A participação das aulas de EFE ou a prática de alguma AD foram associadas
1 Universidade Estadual Paulista. Núcleo de Atividade Física, Espor-te e Saúde. Rio Claro, SP. Brasil 2 Universidade Estadual Paulista. Departamento de Educação Física. Rio Claro, SP. Brasil
Physical education and sport activity Nakamura et al.
INTRODUCTION
he regular practice of physical activity (PA) in adolescence may contribute to a healthy lifestyle both in this period and in adulthood, reducing the incidence of noncommunicable diseases1-3. Several diseases in adults are
associated with conditions or behaviors that began during youth, includ-ing the lack of PA4.
he enough practice of PA, in adolescence, is associated with the weight loss, the improvement in metabolic parameters, lowering blood pressure and insulin resistance, as well as the psychological well-being, the predisposition to maintain PA during adulthood, the decreased risk for cardiovascular disease and, consequently, an increase in life expectancy1,2.
Despite this evidence, the prevalence of PA among adolescents is very low. In Brazil, less than half (43.1%) of adolescents reach the recom-mended 300 minutes per week of PA5. One of the main reasons for this low
prevalence is due to the fact that adolescents have little opportunity to be active in a safe and independent way, especially in large cities, where the urbanization process is fast6. herefore, physical education (PE) classes and
participation in sports activities (SA) that are held inside schools contribute to adolescents accumulate more PA practice time7,8.
In Brazil, according to the 2010 Census, there are approximately 13 million adolescents between 14 and 17 years-old; 60% of them (8 million) are enrolled in high school9. According to Law No. 9.394/96 of December
20th, 1996, the PE in high school is a mandaroty component of the
educa-tion curriculum.
hus, the PE and SA are able to reach a large proportion of adoles-cents, since they spend a large portion of their day at school10. It may
also inluence the level of total physical activity through the activities ofered during classes, as well as turning PA into something pleasurable. However, the inluence of the PE and SA practices in schools for the level of total PA has not been fully elucidated. So, the aim of this study was to investigate the association between the PE and SA in schools with the practice of total PA in adolescents of the city of Rio Claro, in the State of São Paulo,Brazil.
METHODOLOGICAL PROCEDURES
Place and Population of the study
he study was conducted in the city of Rio Claro, which is located in the administrative region of Campinas (São Paulo, Brazil). he city has 19 high schools; seven of them are private and 12, public ones11. he project was
ap-proved by the Ethics Committee of the University Estadual Paulista Júlio de Mesquita Filho - Biosciences Institute of Rio Claro, under Protocol No. 5927,
from the decision of the Research Ethics Committee (REC) No. 19 in 2008.
already inished high school.
Sample
To establish the sample of the present study, we observed the School Census of the National Institute for Educational Studies and Research11,
conducted in 2007, in which the city of Rio Claro had 7,339 enrollments (5,663 in public schools and 1,676, in private ones). he sampling process was by conglomerate and occurred in two stages. In the irst stage, we listed all the private and public schools in Rio Claro (São Paulo), and then we quantiied the number of students in each school and listed all classes of all grade schools. Ater this procedure, there was a rale among schools. In the second stage, it was conducted a rale of the classrooms of the selected schools, and all students of the class in the sample were interviewed.
he sample size calculations took into account the sampling error of 5%, with the prevalence of physical activity in 50%. he sample was estimated at 384. As the sampling was performed by conglomerates, the number of individuals was doubled. he inal sample was estimated at approximately 768 adolescents.
he average number of students per class was calculated by dividing the enrollments of high school adolescents by the total number of classes (7,426 enrollments / 204 classes), totaling 37 students per class. Ater that, the number of students to be interviewed (768) was divided by the average number of students per class (37), resulting in 21 classes to be interviewed. At the end of the data collection, 25 classes were questioned, in order to cover any losses and refusals.
Procedures
he pilot study lasted two weeks and was held in a city school that was not included for the sample. It consisted in the inal questionnaire testing, the manual and organization of ield work.
One questionnaire was completed by adolescents, and the other, by parents or guardians who reside with the adolescent to asses the socioeco-nomic status. For questions about ecosocioeco-nomic level, we used the questionnaire suggested by the Brazilian Association of Research Firms (BARF) made in 200712. he guidelines, proposed by the BARF grouped people into classes
A (high), B, C, D and E (low) according to the estimate of the purchasing power of urban citizens and families.
To measure the level of PA during the adolescent´s leisure time, it was used the PA questionnaire for kids called the Physical Activity
Question-naire – Children (PAQ-C)13. his questionnaire investigates the level of
partici-Physical education and sport activity Nakamura et al.
pation in SA. Each question has values from 1 to 5, and the inal score is obtained by averaging the questions 1 to 7, 9 and 13. he PA classiication level is measured by the following scores: a) 1 and 2 – physically inactive; b) 3 to 5 – physically active, based on scores suggested by Crocker et al.13
and Kowaslki et al.14, used by Silva and Malina15.
Kowalski et al.14 showed that the PAQ-C has internal consistency values
between 0.79 and 0.89, and test-retest reliability between 0.75 and 0.82. he validity was investigated by correlating the scores of the PAQ-C compared with the PA level results (r=0.63), with the PA questionnaire of Godin and Shephard (r=0.41), with the Caltrac accelerometer (r=0.39) and a test bank for the assessment of cardiorespiratory itness (r=0.28).
To verify the practice of PE in schools, it was used a question from the PAQ-C (the participation in PE classes) and another on class attendance. To investigate the practice of sports activities in schools, students answered the following question: a) Do you participate in any school sport, training staf in your school,with a physical education teacher? (Yes and No)
To calculate the Body Mass Index (BMI), all students had their weight and height measured according to the anthropometric standardization of Lohman et al.16. he BMI classiication was obtained using the procedure
suggested by the Center for Disease Control (CDC), that considers the age and gender of adolescents. For this calculation, it was used a spreadsheet available at the CDC website http://apps.nccd.cdc.gov/dnpabmi/.
Data Collection and Management
Data collection was conducted by ive interviewers, who participated in a 30 hours training. he directors of the selected schools were invited to attend a meeting with the team executing the project; the aim was to present the importance, objectives and methodology of the study. Ater obtaining the direction´s consent, the physical education teachers were invited to attend a further meeting on the project’s goal, its importance and the questions in the questionnaire. he students included in the study, as well as their parents, were informed about the project and invited to participate by sign-ing an Informed Consent Form (ICF). Questionnaires were self-answered, and the average completion time was 20 minutes. he assessment of weight and height was performed by the interviewers themselves on the same day that the questionnaire was applied. he ield work began in February and ended in August of 2009.
Statistical Analysis
he Logistic Regression Analysis was performed to verify which factors are associated with the practice of total PA. We assessed the socioeconomic status and BMI among adolescents, because the study of Adegoke et al.17
demon-strated an association of these variables with the practice of PA in adolescents. To make the inal model of the adjusted logistic regression, only the variables that had p<0.2018 remained. he regressions were performed
as-RESULTS
he study had the participation of 15 schools (10 public and 5 private), from a predicted number of 16 (10 public and 6 private). Of these 16, there was refusal of three private schools; two of them were replaced by new private ones. he third was replaced by another private school, however the school also refused to participate in the study. As all schools in Rio Claro (19) were already joining the work, it was decided to select another school that was already participating in the study and, then, a new class was raled.
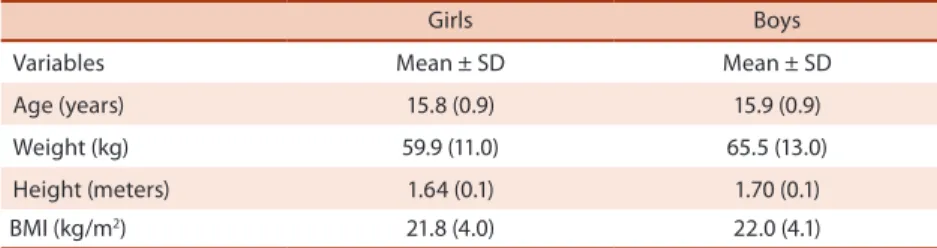
883 students were interviewed, and 467 of them showed the Consent Forms that were included among the samples of the present study. Of these 467 students (15.8 ± 0.9 years-old), 254 (54%) are girls (15 ± 0.8 years-old) and 213 (46%) are boys (15.9 ± 0.9 years-old) (Table 1).
Table 1. Characteristics of the 467 adolescents, presented as mean and standard deviation (SD), according to gender (girls and boys)
Girls Boys
Variables Mean ± SD Mean ± SD
Age (years) 15.8 (0.9) 15.9 (0.9)
Weight (kg) 59.9 (11.0) 65.5 (13.0)
Height (meters) 1.64 (0.1) 1.70 (0.1)
BMI (kg/m2) 21.8 (4.0) 22.0 (4.1)
he remaining students were classiied as “non-responders students” and corresponded to 47% of the sample (416 students). Most students in this group did not have the authorization of the responsible (79.6%; 331 students) ater the researchers returned ive times to schools in order to collect data. Among other reasons, there are: 5.8% (24 students) transferred, 5.5% (23 students) who are 18 years-old, 2.4% (10 students) dropouts, 2.2% (9 students) did not contribute, 1.5% (6 students) did not have their parents´ authorization, and 3% (13) for other reasons.
he prevalence of PA was only 17.38%, and girls had a lower preva-lence (9.4%) compared with boys (26.8%). According to the analyses, girls who did not participate in PE classes (OR=0.24, CI=0.08-0.66) and, thus, without a frequency during classes (OR=0.11, 95% IC=0.01-0.94) had a lower prevalence of performing total PA when compared with girls who performed these activities. However, these associations did not remain in the adjusted analysis (Table 2).
Physical education and sport activity Nakamura et al.
Table 2. Odds ratio estimates, unadjusted and adjusted, between total PA practice with individual and economic characteristics, the participation and attendance in physical education classes, and participation in sports activities at school. Girls data (n=254)
Variable Unadjusted OR (95% IC) pa Adjusted OR (95% IC) pb
Age (years)
14-15 1
16-17 1.43 (0.59-3.48) 0.43
BMI (kg/m2)
Normal 1 1
O-O 2.24 (0.89-5.62) 0.08 2.07 (0.75-5.70) 0.16
Economic status
A1, A2, B1 and B2 1
C 0.63 (0.23-1.73) 0.37
D and E 1.21 (0.41-3.60) 0.73
Participation in PE classes
Yes 1 1
No 0.24 (0.08-0.66) 0.06* 0.36 (0.12-1.08) 0.07
Frequency of PE classes (week)
0 0.11 (0.01-0.94) 0.04* 0.23 (0.02-2.08) 0.19
1 0.62 (0.25-1.53) 0.29 0.67 (0.25-1.78) 0.42
≥ 2 1
Sport activity at school
Yes 1 1
No 0.18 (0.05-0.65) 0.00* 0.40 (0.89-1.85) 0.24
O-O=Overweight-Obesity; OR=Odds Ratio; a=Chi-squared; b=Adjusted Logistic Regression; * statistic signiicance.
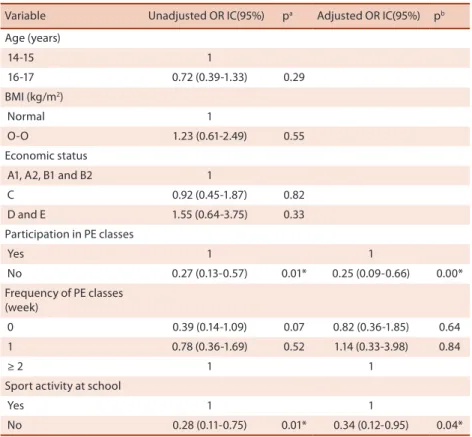
Table 3. Odds ratio estimates, unadjusted and adjusted, between total PA practice with individual and economic characteristics, the participation and attendance in physical education classes, and participation in sports activities at school. Boys data (n=213)
Variable Unadjusted OR IC(95%) pa Adjusted OR IC(95%) pb
Age (years)
14-15 1
16-17 0.72 (0.39-1.33) 0.29
BMI (kg/m2)
Normal 1
O-O 1.23 (0.61-2.49) 0.55
Economic status
A1, A2, B1 and B2 1
C 0.92 (0.45-1.87) 0.82
D and E 1.55 (0.64-3.75) 0.33
Participation in PE classes
Yes 1 1
No 0.27 (0.13-0.57) 0.01* 0.25 (0.09-0.66) 0.00*
Frequency of PE classes (week)
0 0.39 (0.14-1.09) 0.07 0.82 (0.36-1.85) 0.64
1 0.78 (0.36-1.69) 0.52 1.14 (0.33-3.98) 0.84
≥ 2 1 1
Sport activity at school
Yes 1 1
No 0.28 (0.11-0.75) 0.01* 0.34 (0.12-0.95) 0.04*
he present study aimed to investigate the association of total PA with the practice of PE and participation in SA at school among adolescents in Rio Claro (São Paulo, Brazil). he hypothesis of this study was that the practice of PE and practice of SA are positively associated with the practice of total PA.
he main results were that girls had lower prevalence of total PA than boys, and boys who practiced PE and participated in SA inside school were more likely to be active during leisure time than those adolescents who had not practiced such activities.
Our results show a prevalence of PA of 17.38% among adolescents, being lower among girls (9.4%) compared with boys (26.8%). he lower prevalence of PA in girls complies with the indings of Silva et al.15 and
Smith et al.20, who also used the PAQ-C questionnaire.
Silva et al.15 conducted a study with 325 adolescents from public schools,
in the city of Rio de Janeiro, and veriied that only 6% and 15% of girls and boys, respectively, were classiied as active people. In the work of Silva et al.20, it was showed that, of 774 adolescents living in the city of Aracaju,
10.7% and 24% of girls and boys, respectively, were classiied as active. he National Survey of Student Health (PeNSE, acronym in Portu-guese)21 evaluated data of 618,555 adolescents in the 9th grade of elementary
school from all the state capitals and Federal District. It was concluded that 43.1% of adolescents reached the recommendation of 300 minutes per week of physical activity, and the girls (31.1%) had lower prevalence of PA when compared with boys (56.2%). he cohort study conducted by Trilk et al.22,
which evaluated 957 girls in the 6th and 8th grades, found that during the 8th
grade girls increased sedentary time and decreased time for the practice of PA. he adolescents in this study who did not participate in the PE classes had lower chances of performing total PA than those who participated in classes. his result is consistent with the indings of Ceschini et al.23, which
evaluated more than 3,500 students from public schools aged between 14 and 19 years-old in the city of São Paulo. he authors found that students who do not participate in physical education classes at school (OR=1.39; 95% CI=1.29-1.53) were more likely to be inactive (<300 min/wk) than those who participated in PE classes. However, in our study, the efect of participation in PE, ater the adjusted analysis, remained only for boys. his may have occurred because the boys have higher participation in PE classes (n=134; 63%) than when compared with girls (n=128; 51%). Furthermore, boys (22%) presented a frequency of two days – or more – in PE classes greater than compared to girls (20%). he higher frequency of the boys´ participation in classes is consistent with the result of PeNSE20, which found
that 50% of boys and 47% of girls attend more than twice the PE classes. Pate et al.24 emphasize the importance of school and reinforce the idea
that, due to the change in lifestyle of adolescents, in the 21st century, the
Physical education and sport activity Nakamura et al.
adolescents of engaging in any relevant PA25. It is also worth mentioning
that, in addition to the numerous beneits of PA in this phase of life, such as the cardiorespiratory and muscular itness, the bone health and normal values of metabolic biomarkers26, the active behavior in this stage of life
can be transferred to adulthood27,28.
Our results also showed that adolescents who did not participate in sports activities presented less chances to be active than those who practiced some SA. he importance of practicing activities – inside and outside the school – is recognized by the Ministry of Health20 and CDC, which sets a
goal for 2020 that 90.8% of adolescents, aged between 12 and 17 years-old, get involved in these activities29. However, in this study, ater the adjusted
analysis, only boys remained positively associated with participation in sports activities. his result is consistent with indings by Mandic et al.8,
which evaluated 1,837 adolescents (14 ± 1.2 years-old) from the city of Otago and found that boys spend more time performing SA than girls, and boys that participated in these activities had longer PA than boys who did not perform them. he authors concluded that the participation in SA is able to increase PA levels in adolescents.
A major limitation of the study was the sample loss occurred when students were invited to participate in the survey and lack of information about the sample. his sample loss occurred because they did not return the Consent Form signed by a guardian. hus, caution is needed when generalizing the results of this study to the adolescent population in the city of Rio Claro due to possible sampling bias. Another limitation of the work refers to the instrument used to evaluate the level of PA in adolescents (PAQ-C). Besides being exposed, as any other questionnaire, to recall bias, it does not allow to identify the precise time (minutes or hours) spent with activities in schools, during transportation and in leisure time. However, the questionnaire is easy to apply, and it can be used in large samples.
CONCLUSION
he present study veriied that it is plausible to assume that PE classes and SA, developed inside the school, may increase the total level of PA, especially for boys. Additionally, the prevalence of total PA in adolescents was only 17.38%, and girls presented a lower prevalence.
REFERENCES
1. Downey AM, Frank GC, Webber lS, Harsha DW, Virgilio SJ, Berenson GS,
Imple-mentation of “heart smart”. A cardiovascular school health promotion program. J Sch Health 1987;57(3):98-104.
2. Hayman lL, Williams CL, Daniels SR, Steinberger J, Paridon S, Dennison BA,
4. Hallal PC, Victora CG, Azevedo MR, Wells JC. Adolescent physical activity and health: a systematic review. Sports Med 2006;36(12):1019-30.
5. Hallal PC, Knuth AG, Cruz DKA, Mendes MI, Malta DC. Prática de atividade física
em adolescentes brasileiros. Ciênc Saúde Coletiva 2010;15(2):3035-42.
6. Popkin BM, Gordon-Larsen P. he nutrition transition: worldwide obesity dynamics
and their determinants. Int J Obes 2004;28:S2-S9.
7. Slingerland M, Borghouts L. Direct and indirect inluence of physical
education-based interventions on physical activity: a review. J Phys Act Health 2011;8(6):866-78.
8. Mandic S, Bengoechea EG, Stevens E, de la Barra SL, Skidmore P. Getting kids
active by participating in sport and doing it more oten: focusing on what matters. Int J Behav Nutr Phys Act. 2012;12;9:86.
9. Instituto brasileiro de geograia e estatística. Sinopse dos resultados do censo 2010. Característica da população [Internet]. Brasília (Brasil): IBGE. 1937. Available from: <http://www.ibge.gov.br/home/estatistica/populacao/censo2010/caracter-isticas_da_populacao/tabelas_pdf/tab5.pdf. [2011 Jan 18].
10. Marcus BH, Williams DM, Dubbert PM, Sallis JS, King AC, Yancey AK, et al.
Activity intervention studies: what we know and what we need to know a scientiic statement from the American Heart Association council on nutrition, physical activity, and metabolism (subcommittee on physical activity); council on cardio-vascular disease in the young; and the interdisciplinary working group on quality of care and outcomes research. Circulation 2006, 114:2739-52.
11. Instituto nacional de estudos e pesquisas educacionais Anísio Teixeira- INEP.
Dados do sistema de estatísticas educacionais (edudatabrasil). Ensino médio, Brasília, 2011.
12. ABEP. Associação Nacional de Empresas de Pesquisa. Critério de classiicação
econômica Brasil. São Paulo: Associação Nacional de Empresas de Pesquisa. 2007.
13. Crocker PR, Bailey DA, Faulkner RA, Kowalski KC, Mcgrath R. Measuring general
levels of physical activity: preliminary evidence for the physical activity question-naire for older children. Med Sci Sports Exerc 1997;29:1344-9.
14. Kowalski KC, Crocker PRE, Faulkner RA. Validation of the physical activity
questionnaire for older children. Pediat Exerc Medic 1997;9:174-86.
15. Silva RCR, Malina RM. Nível de Atividade Física em Adolescentes do Município
de Niterói, Rio de Janeiro, Brasil. Cad Saúde Pública 2000;14(4):1091-7
16. Lohman TG, Roche AF, Martorell R. Anthropometrics Standardization Reference
Manual. Abridged Edition. Illinois: Human Kinetics Books, 1991.
17. Adegoke BO, Oyeyemi AL.Physical inactivity in Nigerian young adults: prevalence
and socio-demographic correlates. J Phys Act Health 2011;8(8):1135-42.
18. Speed,F.M; Hocking ,R.R. he use of the R-notation with unbalanced data. Am
Statist 1976;30(1):30-3.
19. Bauman AE, Reis RS, Sallis JF, Wells JC, Loss RJF, Martin BW. Correlates of
physical activity: why are some people physically active and others not? Lancet 2012;380:258-71.
20. Silva DAS, Lima JO, Silva RJS, Prado RL. Nível de atividade física e
compor-tamento sedentário em escolares. Rev Bras Cineantropom Desempenho Hum 2009;11(3):299-306.
21. Instituto Brasileiro de Geograia e Estatística-IBGE. Pesquisa Nacional de Saúde
do Escolar (PENSE). Rio de Janeiro-RJ. Available from: <http://www.ibge.gov.br/ home/estatistica/populacao/pense/pense.pdf> [2011 jul 21].
22. Trilk JL, Pate RR, Pfeifer KA, Dowda M, Addy CL, Bibisl KM, Sztainer DN, Lytle
LA. A cluster analysis of physical activity and sedentary behavior patterns in middle school girls. J Adoles Health 2012;51:292-8.
23. Ceschini FL, Andrade DR, Oliveira LC, Júnior JFA, Matsudo VKR. Prevalência de
Physical education and sport activity Nakamura et al.
Corresponding author
Priscila Missaki Nakamura Av: 3 A, 1007 Cidade Nova CEP: 13506-790 - Rio Claro, SP. Brasil. E-mail: [email protected]
24. Pate RR, Davis MG, Robinson TN, Stone EJ, McKenzie TL, Young JC. Promoting
Physical Activity in Children and Youth A Leadership Role for Schools A Scientiic Statement From the American Heart Association Council on Nutrition, Physical Activity, and Metabolism (Physical Activity Committee) in Collaboration With the Councils on Cardiovascular Disease in the Young and Cardiovascular Nursing. Circulation 2006,114:1214-24.
25. Mckenzie TL, Feldeman H, Woods SE; Romero KA, Dahlstrom V, Stone EJ, et al.
Children’s activity levels and lesson context during third-grade physical education. Res Q Exerc Sport 1995;66(3):184-93.
26. United States department of health and human services. Physical activity guidelines advisory committee report. Washington; 2008 October. 61p. Report No.: U0036.
27. Azevedo MR, Araújo CR, Cozzensa da Silva M, Hallal PC. Tracking of physical
activity from adolescence to adulthood: a population based study. Rev Saúde Pública 2007;41(1):69-75.
28. Gordon-Larsen P, Nelson MC, Popkin BM. Longitudinal physical activity and
sedentary behavior trends: adolescence to adulthood. Am J Prev Med 2004; 27(4):277-83.
29. Center of Prevention and Control Disease. Health people, 2020 [Internet].