!
!
!
!
!
Financial Linkages in European Equity and Debt Markets
Author: Nicolas Klare
Student ID: 2520
A work project carried out as part of the master in Finance, under the
supervision of:
Miguel A. Ferreira
Saturday, 31 December 2016
! ! ! ! ! ! ! ! ! ! ! !
! ! ! ! ! ! ! ! ! !
Abstract!
This paper studies financial market linkages in Europe throughout the lifetime of the Euro. In considering the national equity and sovereign debt markets of the seven biggest economies in Europe, I find important developments in cross-country as well as cross-asset linkages. There is evidence for a revival of country-specific risk, causing a differentiation between riskier “peripheral” Euro area countries (Italy, Spain) and presumably safer “core” countries (Germany, the Netherlands). As a consequence, a “flight to safety” phenomenon can be observed. Interestingly, there is evidence that these “flight to safety” capital flows partially revert themselves in periods of relative stability in European financial markets.
!
Table of Content
List of Tables ... IV! List of Figures ... IV!
1! Introduction ... 1!
2! Literature Review ... 2!
3! Research Hypothesis ... 7!
4! Data ... 9!
5! Methodology ... 11!
5.1! Domestic Cross-Asset Linkages ... 11!
5.2! Cross-Border Linkages ... 11!
5.3! Extreme Co-Movements ... 12!
6! Preliminary Diagnostics ... 14!
6.1! Structural Break Test ... 14!
6.2! Vector Autoregression Model ... 16!
7! Empirical Results ... 18!
7.1! Domestic Cross-Asset Linkages ... 18!
7.2! Cross-Border Linkages ... 22!
7.2.1! Equity Market ... 22!
7.2.2! Sovereign Debt Market ... 25!
7.3! Extreme Co-Movements ... 28!
7.3.1! Equity Shocks ... 28!
7.3.2! Sovereign Debt Shocks ... 31!
8! Limitations and further Research ... 37!
9! Conclusion ... 37!
10! Appendix ... 40!
List of Tables
Table 1: Identified Negative Shocks in Time Series!...!14!
Table 2: Estimated Break Points in Regressions!...!16!
Table 3: Lag Length suggested by SBIC Information Criterion!...!18!
Table 4: National Cross-Asset VAR Subsample 02-07!...!19!
Table 5: National Cross-Asset VAR Subsample 08-11!...!21!
Table 6: National Cross-Asset VAR Subsample 12-16!...!21!
Table 7: Cross-Country Equity VAR!...!25!
Table 8: Cross-Country Sovereign Debt VAR!...!27!
Table 9: VAR Model (1) including Equity Shock Dummies Subsample 02-07!...!29!
Table 10: VAR Model (1) including Equity Shock Dummies Subsample 08-11!...!30!
Table 11: VAR Model (1) including Equity Shock Dummies Subsample 12-16!...!31!
Table 12: VAR Model (1) including Sovereign Debt Shock Dummies Subsample 02-07!...!32!
Table 13: VAR Model (1) including Sovereign Debt Shock Dummies Subsample 08-11!...!34!
Table 14: VAR Model (1) including Sovereign Debt Shock Dummies Subsample 12-16!...!35!
Table 15: Overview of main Findings!...!36!
Table 16: Performance of the Financial Market!...!40!
Table 17: Annualized Standard Deviation of the Financial Market!...!40!
Table 18: Equity Correlation Matrix!...!41!
Table 19: Sovereign Debt Correlation Matrix!...!42!
! List of Figures Figure I: Performance of the National MSCI Equity Indices!...!10!
Figure II: Yield on 10-Year Government Bonds!...!10!
Figure III: Identified Equity Shocks based on 5% Negative Residuals!...!43!
Figure IV: Identified Sovereign Debt Shocks based on 5% Positive Residuals!...!43! !
1! Introduction
The financial turmoil throughout the last decade has sparked a discussion about the potential impact financial market integration has on the stability of the global financial system. The collapse of Lehman Brothers in 2008 and the subsequent outbreak of the global financial crisis has illustrated how increasingly integrated and thus complex global financial markets have become. While the global economy has partially recovered since the bankruptcy of Lehman Brothers in the U.S., the European Union has been identified more recently as one of the biggest threats to the stability of the global financial system. Being an economic and monetary union with the highest degree of integration among individual countries in the world, Europe serves as an example of what challenges might come from further global financial integration.
Recently, the discussion about financial stability gained further controversy through the market interventions of Central Banks around the world. The decision by the European Central Bank (ECB) to drastically cut the key policy rate as of 2008 and to subsequently
launch asset purchase programs caused major distortions in European financial markets. The
interest rate on the main refinancing operations (MRO), which is the main determinant of the
liquidity provided to the European financial system, dropped from 3.75% in 2008 to 0.00% in
2016. The cut of interest rates in combination with ECB’s asset purchases lead to a potential
decoupling of economic fundamentals and sovereign yields. While the average debt-to-GDP
ratio increased from 68.5% in 2008 to 90.4% in 2015 (Eurostat, 2016), the Euro area
benchmark bond, representing the average yields on 10-year government bonds, has
The developments after the introduction of the Euro illustrate that essential factors
affecting financial markets and accordingly also their interdependences in the Euro area have
changed. Therefore, it is of interest to analyse potential structural changes in linkages between
European financial markets. Despite its pioneering role in extreme market integration there has not been any comprehensive study describing the development of financial market interdependencies in Europe throughout the lifetime of the Euro, including the major Euro area economies and asset classes. The underlying paper aims to fill this gap in the academic literature and thus tries to enhance the understanding of extreme financial market integration. The two financial markets considered in this paper are the equity market and the sovereign
debt market in the seven biggest economies in the Euro area. Both linkages within asset
classes as well as across asset classes are considered.
The remainder of the paper is organized as follows. Section 2 provides an overview of
the most relevant literature on financial market linkages and of the effect of ECB’s
unconventional policy on asset prices. Section 3 states the research hypothesis and lays out
the authors expectations. Section 4 introduces the data sample, while section 5 describes the
methodology and estimation strategy. Section 6 and 7 present the main results. In section 8 a
brief overview of the empirical limitations as well as of possible further extensions of the
underlying paper is given. Finally, section 9 concludes.
2! Literature Review
As one of the first scholars, Eun and Shim (1989) conduct an in-depth analysis of the interdependence structure of national stock markets. Focusing on global equity markets, they use a vector autoregressive (VAR) model and detect substantial interactions among markets. More specifically, they find that innovations in the U.S. stock market rapidly transmit to other global stock markets, whereas no other foreign market can significantly explain movements in U.S. stocks. More than fifteen years later, Baele (2005) uses a regime switching framework to model volatility spillover in order to investigate the extent to which regional integration and globalization has led to increasing interdependencies among equity markets. He finds that in both Europe and the U.S. spillover intensity substantially increased in the 1980s and 1990s. This development is especially pronounced for Europe. Focusing on structural changes in European markets, he shows that economic integration in the second half of the 1980s increased spillovers more strongly than the introduction of the monetary union in the 1990s. The fact that the liberalization of European capital markets was more important in bringing national stock markets closer together relative to the introduction of the Euro is further supported by Sigel, Lundblad, Harvey and Bekaert (2011). According to their paper, becoming a member of the European Union significantly reduces equity market segmentation between member countries, whereas the subsequent adoption of the Euro has minimal effects on further integration.
In a series of papers Diebold and Yilmaz (2009; 2011; 2012) develop a framework based on a VAR model to analyse spillovers in different asset classes. Their research describes the increased importance of European financial markets for global financial stability. Twenty years after Eun and Shim (1989) had ascertained the global dominance of the U.S. stock market, Diebold and Yilmaz show that European equity markets have become key contributors in transmitting shocks to global financial markets.
premiums, liquidity patterns and other global financial market variables and to a lesser extent by country-specific macroeconomic fundaments.
A new set of papers published after the collapse of Lehman Brothers start to focus on possible changes in interdependence structures caused by the global financial crisis. Claeys and Vašíček (2012) are among the first to conduct a more in-depth analysis of linkages among European sovereign bond markets. They observe that spillovers among sovereign yields have significantly increased since 2007, while there is still heterogeneity across countries. Furthermore, and in line with previous findings, their finding indicates that spillovers are more important than domestic factors in determining yields in the Euro area. Caceres, Guzzo and Segoviano (2010) use a methodology developed by Segoviano (2006) to estimate spillover coefficients between countries in the Euro area. They show that the surge in global risk aversion has significantly influenced sovereign spreads. After 2008 investors started focusing more strongly on country-specific risk factors, partially revoking the previously observed convergence of interest rates. Moreover, the authors estimate spillover coefficients for each country in the Euro area and find that the gravity centre of spillovers shifted from countries that were initially more affected by the financial crisis, namely Ireland, Austria and the Netherlands, to countries with weaker long-term fundamentals, like Spain, Portugal and Greece.
So far, not much academic efforts have been concentrated on studying the linkages between different asset classes. As one of the first scholars Hartman, Straetmans and De Vries (2004) study extreme co-movements within and between stock and bond markets. In considering the G-5 countries1, they attempt to answer the question of whether different markets crash jointly. They show that simultaneous crashes in stock markets are about twice as likely as in bond markets, while stock-bond co-crashes are as frequent as the flight to safety from stocks to
!!!!!!!!!!!!!!!!!!!!!!!!!!!!!!!!!!!!!!!!!!!!!!!!!!!!!!!!
bonds. Furthermore, they find evidence that extreme cross-country linkages are as strong as linkages within countries, illustrating a potential drawback of international financial market integration.
Ehrmann, Fratzscher and Rigobon (2005) examine financial transmission channels between asset classes in both the U.S and the Euro area using a VAR model. Contrary to Hartman et al. (2004) they find evidence that asset prices react strongest to other domestic asset price shocks. Although weaker, international spillovers both within and across asset classes are also significant. In a more detailed analysis Garcia and Tsafack (2011) investigate interdependences between pairs of countries, namely U.S./Canada and Germany/France. In line with Ehrmann et al. (2005), they find that cross-country interdependences within the same asset classes are stronger than linkages between stocks and bonds in the same country. Also using a VAR framework, Diebold and Yilmaz (2012) analyse possible structural changes in volatility spillovers across U.S stock, bond, foreign exchange and commodities markets. In their study they show that cross-market volatility spillovers were rather limited until Lehman Brothers collapsed in 2007. As the financial crisis intensified so did volatility spillovers, especially those originating from the equity market. Looking at stock markets, sovereign CDS spread and exchange rates Grammatikos and Vermeulen (2012) examine the sensitivity of financials and non-financials in the Euro Area to the crisis development in the US and to sovereign debt problems in Europe. They confirm the finding of structural changes around 2007 and 2011.
linkages between low interest rates and bank risk-taking. He observes that periods of low interest rates over an extended time cause an increase in the willingness of banks to take risks. According to him this is due to two reasons: through a search for yields triggered by decreasing returns on bonds; and by the impact interest rates have in the valuation process of cash flows, which in turn modifies how banks measure risk.
As the ECB has launched a series of different asset purchase programs since 2010, the most recent literature dealing with monetary transmission channels focuses on the impact of these programs on asset prices. Fratzscher, Duca and Straub (2014) show that ECB’s bond purchases under the Securities Markets Programme (SMP), which was the first asset purchase program, were efficient in decreasing bond spreads between “peripheral” and “core” Euro area countries. While lowering market fragmentation in European bond markets it also lifted equity prices in Europe. These findings are in line with Szczerbowicz (2015) who shows that ECB’s asset purchases fed through into other asset classes. Her results indicate that the covered bond purchases diminished sovereign spreads, while sovereign bond purchases reduced covered bond spreads. Independently, Pattipeilohy, Van den Endm Tabbae, Frost and De Haan (2013), Eser and Schwaab (2013), and Ghysels, Idier, Manganelli and Vergota (2014) find similar results.
3! Research Hypothesis
The versatile developments since the introduction of the Euro illustrate that essential
factors affecting financial markets and accordingly also their interdependences in the Euro
area have considerably changed. The underlying research question is, how linkages between
national European equity and sovereign debt markets have changed throughout the lifetime of the Euro. The first question the paper tries to investigate is whether structural linkages between the two asset classes exist on a national level, and, more importantly, whether these interdependences have changed over time. As already mentioned there is evidence that the set of factors separately influencing equity and sovereign debt markets have altered, thus raising suspicion that possible linkages between these two asset classes have also changed through time. Two reasons for structural changes in the linkages between national equity and sovereign bond markets can be expected: First, after the outbreak of the European sovereign debt crisis investors started to focus more strongly on country-specific risk. This lead to increasing sovereign spreads primarily in “peripheral” Euro area countries, while only marginally affecting those in “core” countries. Consequently, the country-specific risk and return profile of sovereign debt relative to domestic equity has altered. Second, ECB’s asset purchases have been aimed at covered and sovereign bonds, thus directly affecting their prices. As mentioned in the literature review these measures have also inflated equity prices, but only indirectly through different transmission channels. Accordingly, it can be expected that domestic interdependencies between sovereign bonds and stocks have changed.
The second question the paper tries to answer is whether the extent of cross-border linkages within the considered asset classes, as well as between the two different asset classes have changed throughout the life time of the Euro. Did financial market integration in Europe continue after the introduction of the Euro? Or has the financial turmoil throughout the last
decade led to a segregation between different national financial markets. In general, the
second question investigates the extent to which movements in equity or debt markets in one
seven European countries. Again, it is of special interest whether this interdependencies changed throughout time.
4! Data
In order to answer the research question the paper analyses the linkages among equity and sovereign debt market in each of the seven biggest economies in the Euro area, namely Germany, France, Italy, Spain, Netherlands, Belgium and Austria. Therefore, two different asset classes are considered: equity, proxied by the respective national equity index; and sovereign debt, proxied by the respective 10-year government bond. For the purpose of estimation, the equity indices are taken in logarithms. For the government bonds this is not necessary, since the yield is already expressed in percentage. The underlying data covers the entire lifetime of the Euro and thus starts on the 1st of January 2002 and ends on the 13th of June 2016, representing 3637 trading days. Due to the large number of countries and the relative long sampling period the data is retrieved from two different sources to ensure that the time series in in each asset class are consistent with each other. The national MSCI equity indices are retrieved from Datastream, while the yields on 10-year government bonds are retrieved from Bloomberg as the generic government bond yields.
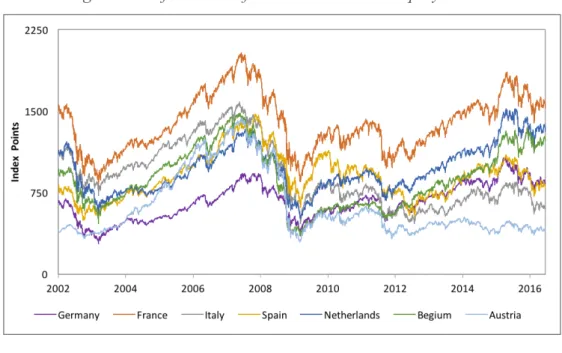
Figure I and II display the performance of the national equity and sovereign debt markets, respectively. As can be seen in Figure I, despite their different starting levels in 2002 the national stock markets display similar patterns: a period of rising equity prices between 2003 and 2007, a collapse of stock markets around the bankruptcy of Lehman Brother in 2008, and a subsequent recovery of the markets until 2015. Furthermore, it seems that equity markets have been less volatile until the outbreak of the financial crisis. In general, Figure I already indicates the possible existence structural breaks in national stock markets.
the performance observed across countries is very similar, but subsequently diverges. While most sovereign yields continue to fall, the yield spreads in Italy, Spain and partially in Belgium increase between 2009 and 2013. This development indicates that investors seem to start to differentiate between European sovereign debt markets. As of 2013 European government yields tend to converge again among European countries. When comparing the equity and sovereign debt market it can be seen that the collapse of Lehman Brothers and the subsequent outbreak of the financial crisis mainly caused equity markets to crash and only subsequently spilled over to European sovereign debt markets.
Figure I: Performance of the National MSCI Equity Indices
Figure II: Yield on 10-Year Government Bonds
5! Methodology
To analyse the linkages between the relevant financial markets a vector autoregression (VAR) framework is used. First advocated by Sims (1980) a VAR models interdependencies between economic time series and thus describes the dynamic structure of the included variables. These models are multivariate extensions of standard autoregressive models, meaning that every independent variable in the system of equations itself is modelled as a depended variable. By doing so the model accounts for all possible interdependences between the considered financial markets and thereby disentangles their individual effects.
5.1!Domestic Cross-Asset Linkages
To analyse linkages between asset classes on a national level, I follow a similar approach to Arezki and Sy (2011). For each of the seven countries a separate VAR model of the following form is estimated:
!!!!!!!!!!!!"# = % + β("#)(+ ⋯ + β+"#)++ ,# (1)
where Y. is a 2×1 vector storing the two different financial markets, c and β2!(i = 1. … . p)
are, respectively,!2×1 and 2×2 coefficient matrices and p represents the optimal lag-length. The error process ε. = ε(... … . ε:.. is a 2×1 zero mean white noise process with covariance matrix E ε.ε.< = Σ> that is ε.~(0, Σ>). In order to investigate whether there are structural changes in the possible linkages between the two financial market, the data is tested for structural breaks. If there are statistically significant breakpoints between 2002 and 2016, one can split the data according to these breakpoints into subsamples. Then, for each of these subsamples an individual VAR is estimated following model (1).
5.2!Cross-Border Linkages
markets of one asset class, c and β2!(i = 1. … . p) are, respectively,!7×1 and 7×7 coefficient
matrices. After setting up the VAR model the procedure is similar to the one used for the domestic cross-asset linkages. If structural breaks are detected, for each of the subsample an individual VAR is estimated.
5.3!Extreme Co-Movements
to extend the asset purchase program to include Euro area government bonds. This decision immediately decreased European sovereign yields.
The identification of extreme movements in both the equity and debt market is based on the residuals of model (1). As residuals measure the difference between the observed value and the model’s prediction, highly negative or highly positive residuals imply unexpected movements in the underlying variable. In model (1) this implies that on these trading days the variable cannot be explained by its own lag or by the lag of the other domestic asset class. For each financial market a dummy series is created, based on the most extreme residuals. To determine which residual can be considered as extreme the paper initially considers a 2%, 5% and 10% cut-off criterion. Based on the frequency and distribution of the identified shocks under the three different cut-off criterions, the paper opts for the 5% cut-off criterion. Since the paper analyses negative events, 5% of the most negative residuals in the equity market are identified as shocks. Based on these identified shocks a dummy variable for each market is created. Each time a shock is identified the dummy variable is equal to 1, otherwise it is 0. For the sovereign bond market, the dummy construction works exactly the opposite way. Since the yield is inversely related to the price of the underlying bond, an increase in the yield corresponds with a decrease in the bond price. Therefore, 5% of the most positive residuals are in this case identified as shocks. As can be seen in Figure I and II provided in the Appendix, the identified shocks in both the equity and sovereign debt market are well distributed throughout the whole sample. The dummy identification based on 2% of most extreme residuals leads to a clustering of shocks, while the 10% cut-off criterion identifies too many shocks.
Table 1: Identified Negative Shocks in Time Series
Sample
Total Observations
Shocks in Equity regression
Shock in Sovereign Debt regression
2002-2007 1508 75 75
2008-2011 1009 50 50
2012-2016 1118 56 56
According to theory, a single event on a financial market is processed as follows:
"# = CDED+ ,# (3)
If the coefficient (CD) associated with the dummy ED is significant it indicates co-movement in
the markets. Because of the large number of individual dummies, a single dummy EF is
created for each asset class. The dummy variable ED is equal to 1 each time a shock is
identified in the respective market, and 0 otherwise. Consequently, for each country there are two dummies: an equity shock dummy and sovereign debt shock dummy. The dummy variable is included in model (1) and the VAR takes the following form:
"# = % + β("#)(+ ⋯ + β+"#)++ CDED+ ,# (4)
where "# is again a vector storing the two financial markets. Using this specification will lead
to unbiased estimations of the average effects of cross-border shocks. Additionally, the model disentangles the effects of the structural linkages between the national equity and sovereign debt markets and the impact of cross-border shocks.
6! Preliminary Diagnostics
6.1!Structural Break Test
dates in the sample. The idea behind these tests is to compare the maximum sample test with what could be expected under the null hypothesis of no break (Quandt, 1960; Hansen, 1997). Consequently, it tests whether the model’s performance can be improved by introducing a structural break. For a more detailed analysis, the break test is performed on the individual regressions of the VAR and not on the entire VAR model. This implies that for each asset class a separate breakpoint, if existent, is estimated.
As can be seen in Table 2, the Wald test indicates that in each regression there is at least one statistically significant break point. Overall, there is evidence for two general structural breaks in the data sample: one around 2008 and the other one around 2011. The estimated breaks in the national equity markets are extremely consistent across countries. The test implies structural changes in the 3rd quarter of 2008 for all countries. The structural changes in the sovereign debt market are not as clear those in the equity markets but still identify one common break point. With the exception of sovereign debt in Italy and Spain, the 10-year government yields seem to exhibit a structural break around the end of 2011. However, the Wald test only indicates the most significant structural break in the tested regression, implying that there may be additional, but less significant break points. This means that the seven equity markets may also experience a break in 2011 and the sovereign debt markets one in 2008. The indicated breaks in the two asset classes may not surprise. While the collapse of Lehman Brother in 2008 mainly caused equity markets to crash, the outbreak of the European sovereign debt crisis in 2011/2012 affected sovereign debt markets.
Table 2: Estimated Break Points in Regressions
Equity Regression Sovereign Debt Regression
Estimated break point (observation)
Implied break data
Estimated break point (observation)
Implied break data
Germany 1680 Q3-2008 2337 Q2-2011
France 1680 Q3-2008 2561 Q1-2012
Italy 1680 Q3-2008 3020 Q1-2014
Spain 1661 Q3-2008 3028 Q1-2014
Netherlands 1680 Q3-2008 2337 Q2-2011
Belgium 1619 Q2-2008 2496 Q4-2011
Austria 1679 Q3-2008 2496 Q4-2011
As a result of the structural break test, the underlying sample is split into three separate subsamples. The first subsample spans the period from 2002 until the end of 2007 and represents the introduction of the Euro. The second subsample covers the years 2008 to 2011 and includes the bankruptcy of Lehman Brothers and the subsequent outbreak of the global financial crisis. Finally, the last subsample starts in 2012 and ends in June 2016. This period is mainly characterised by the deepening of the European sovereign debt crisis and ECB’s ultra-loose monetary policy. For each of these subsamples a separate VAR model is run, thus there are three models for each of the seven countries, leading to a total of twenty-one VAR models.
6.2!Vector Autoregression Model
non-stationary they are kept in levels, allowing for the possibility of long-run cointegration.2 Turning to the specification of the VAR models, the paper starts with model (1) and subsequently specifies model (2). To check for cointegration relations, firstly the seven VAR models (1) covering the entire sample from 2002 until 2016 are analysed. The Johansson test leads to accept that in Germany, France, Spain and the Netherlands there exists at least one cointegration relationship. Consequently, in these four countries there is evidence for long-run relationships between the two asset classes. The fact that only some countries exhibit cointegration relationships is a further sign of heterogeneity among the seven countries. Furthermore, it confirms the suspicion of possible country grouping according to structural similarities. As mentioned in section 4.1. Germany, France and the Netherland seem to enjoy some similar characteristics.
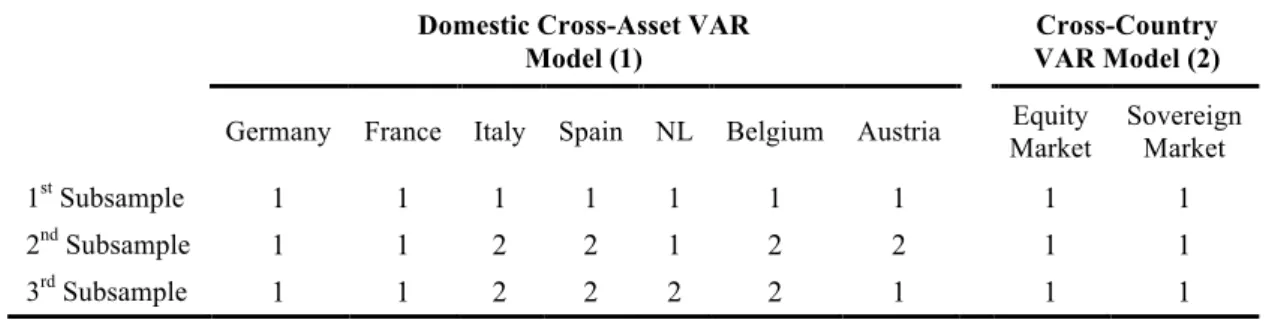
After completing the preliminary diagnostics for the full sample model (1), the appropriate lag length has to be determined for each twenty-four VAR models. While the Schwarz Bayesian Information Criterion (SBIC) exclusively suggest one lag for the first subsample (2002-2007), it advocates for two lags in several countries in the second (2008-2011) and third subsample (2012-2016). In the second subsample Italy, Spain, Belgium and Austria and in the third subsample Italy, Spain, Netherlands and Belgium call for two lags (see Table 3). For easier comparison between the models the lag length in all models for the second and third subsample will be fixed to two, even though this will not always lead to the most parsimonious model. The VAR models for the first subsample are estimated using one lag.
Turning to the cross-country VAR model (2), the same steps have to be completed to ensure the right specification of each model. As we have two asset classes and three subsample, there are a total of six VAR models. Contrary to model (1) for all these VAR models the SBIC information criterion suggests one lag. It seems that cross-border linkages !!!!!!!!!!!!!!!!!!!!!!!!!!!!!!!!!!!!!!!!!!!!!!!!!!!!!!!!
within the asset class lose their significance faster than domestic cross-asset linkages. Furthermore, the Johansson test shows that each of the VAR models (2) exhibits various cross-border cointegration relationships.
Table 3: Lag Length suggested by SBIC Information Criterion
Domestic Cross-Asset VAR Model (1)
Cross-Country VAR Model (2)
Germany France Italy Spain NL Belgium Austria Equity Market
Sovereign Market
1st Subsample 1 1 1 1 1 1 1 1 1
2nd Subsample 1 1 2 2 1 2 2 1 1
3rd Subsample 1 1 2 2 2 2 1 1 1
7! Empirical Results
7.1!Domestic Cross-Asset Linkages
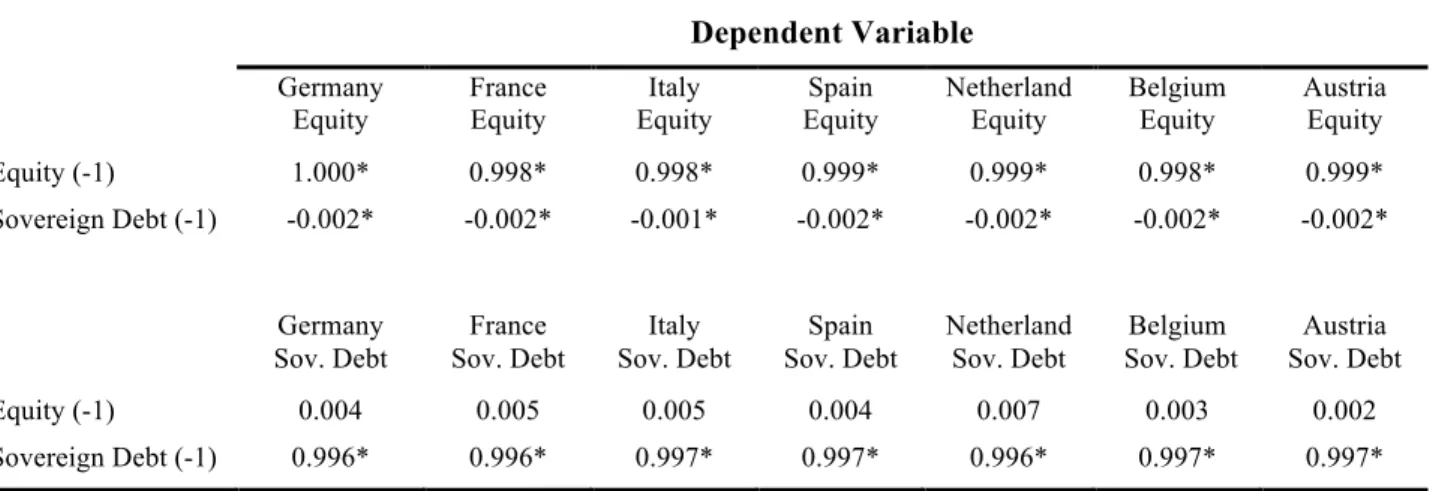
innovations originating from the sovereign debt market, whereas the equity market does not influence government yields. This is somewhat surprising, as one might expect that the equity market is the more dominant financial market due to its higher liquidity.
Table 4: National Cross-Asset VAR Subsample 02-07
Dependent Variable Germany Equity France Equity Italy Equity Spain Equity Netherland Equity Belgium Equity Austria Equity
Equity (-1) 1.000* 0.998* 0.998* 0.999* 0.999* 0.998* 0.999*
Sovereign Debt (-1) -0.002* -0.002* -0.001* -0.002* -0.002* -0.002* -0.002*
Germany Sov. Debt France Sov. Debt Italy Sov. Debt Spain Sov. Debt Netherland Sov. Debt Belgium Sov. Debt Austria Sov. Debt
Equity (-1) 0.004 0.005 0.005 0.004 0.007 0.003 0.002
Sovereign Debt (-1) 0.996* 0.996* 0.997* 0.997* 0.996* 0.997* 0.997*
Turning to the second subsample, comprising the collapse of Lehman Brothers and the subsequent outbreak of the global financial crisis, there are some interesting changes to observe. Contrary to the first subsample, Table 5 displays some heterogeneity among the seven countries. Furthermore, the two lag model specification implies that determinants have a longer lasting effect in some markets. Starting with the autoregressive coefficients, it can be seen that while the second lag in all national equity markets is still insignificant, the second autoregressive lag in the sovereign debt market is significant. Looking more closely at the magnitude of the sovereign debt autoregressive coefficients, these market seems to be trending. Whereas the first lag is positive and above one, the second lag is negative, which indicates that an increasing (decreasing) yield today will tend to further rise (fall) on the subsequently day.3
A second interesting finding is that the stock market takes on a more dominant role. While the national equity market starts to influence the sovereign debt market in most !!!!!!!!!!!!!!!!!!!!!!!!!!!!!!!!!!!!!!!!!!!!!!!!!!!!!!!!
3
!Plugging in different yields in the model confirms that all national sovereign debt markets are trending, except the French one!
countries, the influence of sovereign debt on equity markets turns mostly insignificant. The more dominant role of stock markets is not surprising, considering that the collapse of Lehman Brothers and the subsequent financial crisis mainly caused equity markets to crash and only subsequently spilled over to European sovereign debt markets around 2011. This reasoning implies that, due to the extremely negative performance of equity markets between 2008 and 2011, the stock index starts to influence the domestic sovereign yield.
Looking at the general performance of sovereign debt markets during this period shows the divergence of yield spreads. Italy and Spain are the only countries exhibiting increasing yields on government bonds (see Table 15 in the Appendix). In all other countries the yield on public debt continues to decrease as in the first subsample. The rising yield in Italy and Spain represents an important development due to two reasons: First, European sovereign debt markets have not experienced any considerable yield increases for a long period. Second, this yield increase in southern Europe happened despite the fact that the ECB started lowering its key interest rate as of 2008 and launched their first asset purchase program in 2010. This confirms the hypothesis that in the Italian and Spanish sovereign debt market the increased awareness of country-specific risk by investors dominated the effects of monetary policy. Moreover, the fact that sovereign yields in all other countries further decreased, even though economic and financial fundamentals in these countries did not significantly change, shows that ECB’s monetary policy has partially led to a decoupling of sovereign bond prices and their fundamentals.
among countries increases, indicating that the process of European integration has slowed down or even reverted. To investigate this issue further, it is of interest to analyse how cross-border linkages between the countries have changed over time.
Table 5: National Cross-Asset VAR Subsample 08-11
Dependent Variable Germany Equity France Equity Italy Equity Spain Equity Netherland Equity Belgium Equity Austria Equity
Equity (-1) 0.981* 0.934* 1.006* 1.009* 0.960* 1.034* 1.020*
Equity (-2) 0.010 0.056 -0.014 -0.021 0.033 -0.038 -0.025
Sovereign Debt (-1) 0.011 0.027* 0.000 -0.015 0.015 0.010 0.054*
Sovereign Debt (-2) -0.012 -0.028* -0.001 0.013 -0.016 -0.013 -0.054*
Germany Sov. Debt France Sov. Debt Italy Sov. Debt Spain Sov. Debt Netherland Sov. Debt Belgium Sov. Debt Austria Sov. Debt
Equity (-1) -0.199 -0.338* -0.197 -0.233* -0.397* -0.300* -0.387*
Equity (-2) 0.194 0.340* 0.188 0.232* 0.396* 0.308* 0.390*
Sovereign Debt (-1) 1.099* 1.070* 1.125* 1.188* 1.114* 1.233* 1.156*
Sovereign Debt (-2) -0.102* -0.078* -0.127* -0.197* -0.117* -0.247* -0.162*
Table 6: National Cross-Asset VAR Subsample 12-16
! ! Dependent Variable Germany Equity France Equity Italy Equity Spain Equity Netherland Equity Belgium Equity Austria Equity
Equity (-1) 1.000* 0.962* 0.888* 1.012* 1.007* 0.980* 1.052*
Equity (-2) -0.008 0.027 0.105* -0.019 -0.014 0.008 -0.067*
Sovereign Debt (-1) -0.006 -0.004 -0.007 -0.005 -0.007 0.005 0.014
Sovereign Debt (-2) 0.005 0.002 0.007 0.005 0.005 -0.007 -0.014
Germany Sov. Debt France Sov. Debt Italy Sov. Debt Spain Sov. Debt Netherland Sov. Debt Belgium Sov. Debt Austria Sov. Debt
Equity (-1) -0.337* -0.346* -0.318 -0.306 -0.360* -0.382* -0.193*
Equity (-2) 0.324* 0.344* 0.309 0.295 0.349* 0.350* 0.216*
Sovereign Debt (-1) 0.997* 1.097* 0.998* 1.073* 1.059* 1.139* 1.105*
Sovereign Debt (-2) -0.001 -0.099* -0.002 -0.075* -0.063* -0.149* -0.107*
*!p<0.05!
7.2!Cross-Border Linkages
7.2.1! Equity Market
Table 7 displays the VAR models of the three subsamples, each model consisting of the seven national equity markets. Looking at the first subsample, 2002-2007, there are not many significant coefficients besides the autoregressive lags, hence there are not many interdependences among European equity markets. The Belgian stock index positively influences Italian stocks, while Dutch equity negatively effects the stock market in Austria. These interdependencies are rather surprising since there is no obvious economic explanation for these findings. The VAR model of the crisis subsample, 2007-2011, leaves more room for interpretation. While the negative influence of the Netherlands towards Austria continues, the effect of Belgian stocks on Italian equity vanishes. Moreover, the Spanish equity market becomes the most influential market, positively affecting French, Italian and Dutch stocks. Pressure on Spanish equity leads to decreasing stock indices in France, Italy and the Netherlands, while positive developments in the Spanish market increase stock prices in these three specific countries. One might suspect this influence due to the negative development of the Spanish equity market. However, between 2007 and 2011, the Spanish equity index did not suffer the biggest losses. Table 15, found in the Appendix, shows that the equity index in Spain fell by only 45.0%, whereas the drops in Italy (59.0%), Belgium (51.6%) and Austria (67.8%) were larger. The reason for the dominant role of the Spanish equity market can be probably more attributed to its high volatility. Table 16 in the Appendix displays the annualized standard deviation of the financial markets. Behind Austria (38.83%) the Spanish equity market is the most volatile one (32.37%), illustrating the nervousness of the market, which subsequently seems to spillover to other equity markets.
index. Again looking at the general performance of the equity indices might provide an explanation. While Austrian stocks suffer the biggest losses (67.8%) followed by Belgium (51.6%), the Dutch stock market experiences the smallest loss (33.09%) among all countries. Thus it seems that the strongest divergence among national equity markets between 2007 and 2011 is happening between the smallest stock markets.
The divergence of European equity markets is also confirmed by looking at the correlation matrix found in Table 17 in the Appendix. Correlations between 2008 and 2011 have significantly decreased relative to the period 2002 to 2007. This development is even more impressive since in a financial crises volatility and correlations tend to grow (Sandoval and Franca, 2012; Frank, 2009). In the last subsample the correlations tend to increase again, while still not reaching those levels observed in the the first subsample. This finding together with the considerabe number of negative interdependencies found in the VAR models, challenges the perception of increasingly integrated European financial markets. Additionally, in the last subsample, the effects of ECB’s asset purchases have to be considered. Even though these programs do not effect stock markets directly, there is general consensus that these programs indirectly lift equity prices. Following this reasoning one would expect increasing correlations between equity markets. Thus, correlations between 2012 and 2016 may would have fallen even stronger relative to those observed in the first subsample without ECB’s market interventions as a common factor.
Table 7: Cross-Country Equity VAR
Dependent Variable
Germany Equity
France Equity
Italy Equity
Spain Equity
Netherland Equity
Belgium Equity
Austria Equity
Subsample: 2002-2007
Germany Equity(-1) 0.980* 0.012 0.001 0.004 0.011 0.008 -0.005
France Equity(-1) 0.024 0.966* 0.004 -0.017 0.000 0.010 0.023
Italy Equity(-1) -0.025 -0.005 0.963* -0.007 -0.011 0.003 0.009
Spain Equity(-1) 0.016 0.000 0.005 0.996* -0.003 -0.009 0.011
NL Equity(-1) -0.005 0.002 -0.008 0.005 0.987* -0.012 -0.027*
Belgium Equity(-1) 0.004 0.007 0.019* 0.003 0.004 0.989* 0.007
Austria Equity(-1) 0.001 0.006 0.002 0.008 0.004 0.006 0.987*
Subsample: 2008-2011
Germany Equity(-1) 0.990* 0.036 0.034 0.031 0.033 0.026 0.034
France Equity(-1) -0.032 0.906* -0.064 -0.080 -0.045 -0.060 0.018
Italy Equity(-1) -0.013 -0.005 0.983* -0.001 -0.012 -0.006 -0.002
Spain Equity(-1) 0.013 0.030* 0.034* 1.015* 0.029* 0.025 0.025
NL Equity(-1) 0.005 -0.001 -0.022 -0.009 0.971* -0.004* -0.081*
Belgium Equity(-1) 0.014 0.014 0.020 0.019 0.020 1.004* 0.057*
Austria Equity(-1) 0.004 0.001 -0.001 0.000 -0.007 -0.003 0.957*
Subsample: 2012-2016
Germany Equity(-1) 0.976* 0.005 0.010 0.008 0.003 0.006 0.003
France Equity(-1) 0.008 0.991* 0.044 0.071* 0.018 0.005 0.057
Italy Equity(-1) -0.024* -0.018 0.960* -0.025 -0.022* -0.014 -0.021
Spain Equity(-1) -0.024* 0.012 0.012 0.992* 0.014 0.009 -0.001
NL Equity(-1) 0.010 0.010 0.006 -0.008 0.982* 0.009 -0.001
Belgium Equity(-1) -0.003 -0.006 -0.026 -0.025 0.004 0.986* -0.025
Austria Equity(-1) -0.004 -0.008 -0.019 -0.022 -0.010 -0.014 0.973*
!
!
7.2.2! Sovereign Debt Market
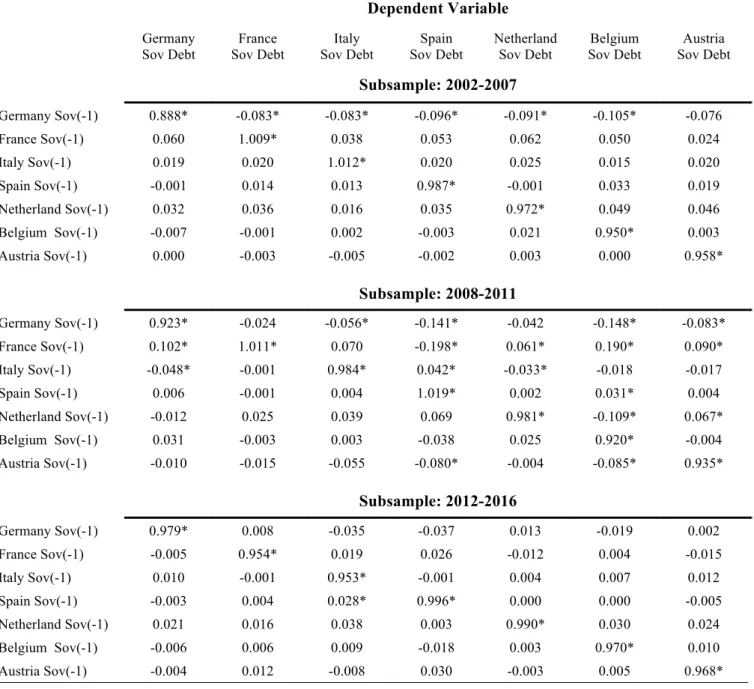
The general picture of sovereign debt linkages shows similarities with those linkages seen in the equity market. While the crisis subsample has many significant interdependencies, in the first and third subsample the autoregressive coefficients dominate. When looking at the linkages between 2002 and 2007 the role of the German sovereign debt market deserves special attention. With the exception of Austria, all other sovereign yields are negatively influenced by German public debt. Consequently, a decrease (increase) in the 10-year German government yield tends to increase (decrease) yields in other countries. Taking into account
the general convergence of interest rates among all seven countries in the first subsample this is somewhat surprising. The negative interdependencies confirm the hegemonic status of Germany and might indicate that, already prior to the global financial crisis and the sovereign debt crisis, Germany has been perceived as a safe haven.
Between 2008 and 2011 the number of significant linkages among sovereign debt markets increases. Besides the negative interdependencies of Germany, which were already existent in the first subsample, the Netherlands and partially France also exhibit negative linkages with Italy and Spain. This development confirms the revival of country-specific risk factors, causing a differentiation between countries. On the one hand, there are the relatively robust “core” countries in the Euro area like Germany, the Netherlands and partially France. One the other hand, there are the “peripheral” countries, namely Italy and Spain, which exhibit weaker economic fundamentals. This segregation is also confirmed by the general performance of sovereign yield in the second subsample, displayed in Figure 14 found in the Appendix. As already mentioned in section 7.1, only sovereign yields in Italy and Spain have increased between 2008 and 2011.
In the third subsample almost all interdependencies vanish. More importantly, all negative interdependencies disappear. It seems that country-specifics risk factors lose their importance and thus also the differentiation between safer and riskier countries. The obvious disappearance of country-specific risk in pricing sovereign bonds can be attributed to ECB’s strong market intervention through their asset purchases, causing yields to fall across all countries. This development is questionable since the fundamentals like GDP-to-Debt ratio and GDP growth in most countries have not significantly improved. Sovereign bond yields not only decreased between 2012 and 2016, but yields on government bonds are lower than ever before.
considerably decrease in the crisis period, while they are moderately recovering between 2012 and 2016. Important to mention are the extremely high correlations among sovereign debt markets until the financial crisis. Between 2002 and 2007 all correlations are above 0.99. Interestingly, in the second subsample correlations do not only tend to decrease but there are also some negative correlations appearing between individual countries. These negative correlations can be observed between presumably safer countries (Germany, Netherlands and Austria) and riskier ones (Italy and Spain)
Table 8: Cross-Country Sovereign Debt VAR
Dependent Variable
Germany Sov Debt
France Sov Debt
Italy Sov Debt
Spain Sov Debt
Netherland Sov Debt
Belgium Sov Debt
Austria Sov Debt
Subsample: 2002-2007
Germany Sov(-1) 0.888* -0.083* -0.083* -0.096* -0.091* -0.105* -0.076
France Sov(-1) 0.060 1.009* 0.038 0.053 0.062 0.050 0.024
Italy Sov(-1) 0.019 0.020 1.012* 0.020 0.025 0.015 0.020
Spain Sov(-1) -0.001 0.014 0.013 0.987* -0.001 0.033 0.019
Netherland Sov(-1) 0.032 0.036 0.016 0.035 0.972* 0.049 0.046
Belgium Sov(-1) -0.007 -0.001 0.002 -0.003 0.021 0.950* 0.003
Austria Sov(-1) 0.000 -0.003 -0.005 -0.002 0.003 0.000 0.958*
Subsample: 2008-2011
Germany Sov(-1) 0.923* -0.024 -0.056* -0.141* -0.042 -0.148* -0.083*
France Sov(-1) 0.102* 1.011* 0.070 -0.198* 0.061* 0.190* 0.090*
Italy Sov(-1) -0.048* -0.001 0.984* 0.042* -0.033* -0.018 -0.017
Spain Sov(-1) 0.006 -0.001 0.004 1.019* 0.002 0.031* 0.004
Netherland Sov(-1) -0.012 0.025 0.039 0.069 0.981* -0.109* 0.067*
Belgium Sov(-1) 0.031 -0.003 0.003 -0.038 0.025 0.920* -0.004
Austria Sov(-1) -0.010 -0.015 -0.055 -0.080* -0.004 -0.085* 0.935*
Subsample: 2012-2016
Germany Sov(-1) 0.979* 0.008 -0.035 -0.037 0.013 -0.019 0.002
France Sov(-1) -0.005 0.954* 0.019 0.026 -0.012 0.004 -0.015
Italy Sov(-1) 0.010 -0.001 0.953* -0.001 0.004 0.007 0.012
Spain Sov(-1) -0.003 0.004 0.028* 0.996* 0.000 0.000 -0.005
Netherland Sov(-1) 0.021 0.016 0.038 0.003 0.990* 0.030 0.024
Belgium Sov(-1) -0.006 0.006 0.009 -0.018 0.003 0.970* 0.010
Austria Sov(-1) -0.004 0.012 -0.008 0.030 -0.003 0.005 0.968*
!
7.3! Extreme Co-Movements
As mentioned above, to further investigate the “flight to safety” phenomenon it is crucial to examine possible extreme market co-movements following unexpected negative shocks in one country. Accordingly, the shock dummy variables are introduced to the cross-asset VAR model (1). When running the VAR models for a specific country the shock dummy of its own market is not included. Additionally, to limit the number of displayed coefficients the autoregressive lags of the two financial markets are not included in the output tables. Thus Table 9, 10 and 11 display only the coefficients of equity shock dummies, while Table 12, 13 and 14 show only the coefficients of the sovereign debt shock dummies.
7.3.1! Equity Shocks
Looking at Table 9 displaying the first subsample, it can be seen that shocks in most equity markets negatively affect almost all other national stock indices. This illustrates the high degree of integration among national European stock markets. Surprisingly, the relatively small equity markets in Belgium and Austria exhibit some robustness against shocks in Germany, Italy, Spain and the Netherlands. One would expect that especially these small countries are highly influenced by cross-border developments. However, this is not the case between 2002 and 2007. The effects of equity shocks on sovereign yields displays a more distinct picture. Equity shocks in Germany, Spain and Austria tend to coexist with decreasing yields in most other countries. This confirms the possible “flight to safety” from stocks to the relatively safer bonds. Interestingly, this phenomenon seems to be triggered by equity shocks in presumably safer countries like Germany and Austria. The effects of shocks in Spanish equity are more in line with what can be expected. Equity shocks in this particular country correlate with falling yield in Germany, France, the Netherlands and Austria.
Table 9: VAR Model (1) including Equity Shock Dummies Subsample 02-07 Dependent Variable Germany Equity France Equity Italy Equity Spain Equity Netherland Equity Belgium Equity Austria Equity
German Eq. Shock - -0.007* -0.006* -0.006* -0.006* -0.003 -0.002
France Eq. Shock -0.011* - -0.007* -0.008* -0.012* -0.011* -0.006*
Italy Eq. Shock -0.010* -0.009* - -0.010* -0.008* -0.007* -0.002
Spain Eq. Shock -0.008* -0.007* -0.008* - -0.008* -0.002 -0.005*
NL Eq. Shock -0.006* -0.011* -0.005* -0.009* - -0.013* 0.003
Belgium Eq. Shock -0.008* -0.010* -0.006* -0.002 -0.011* - -0.007*
Austria Eq. Shock -0.005* -0.005* -0.004* -0.006* -0.003* -0.007* -
Germany Sov. Debt France Sov. Debt Italy Sov. Debt Spain Sov. Debt Netherland Sov. Debt Belgium Sov. Debt Austria Sov. Debt
German Eq. Shock - -0.014* -0.013* -0.015* -0.015* -0.016* -0.019*
France Eq. Shock -0.007 - 0.000 -0.006 -0.005 -0.003 -0.003
Italy Eq. Shock -0.006 -0.005 - -0.007 -0.005 -0.004 0.001
Spain Eq. Shock -0.015* -0.014* -0.012 - -0.015* -0.011 -0.015*
NL Eq. Shock -0.012 -0.010 -0.014 -0.014 - -0.013 -0.007
Belgium Eq. Shock -0.006 -0.006 -0.008 -0.005 -0.010 - -0.013
Austria Eq. Shock -0.013* -0.013* -0.012* -0.014* -0.012* -0.011* -
!
Moving on to the equity markets in subsample two illustrated in Table 10, there are two interesting developments: First, the Belgium stock index is not susceptible to external equity stocks. Second, shocks in the Spanish equity market do not coexist with pressure on stock prices in other countries. Both these developments are rather surprising since both national equity indices show a similarly strong negative development between 2008 and 2012. Looking at the effect of equity shocks on government yields, shows that shocks in Germany equity continue to decrease sovereign yields in most other countries, while the similar effect of Spanish and Austrian equity shocks observed in the first subsample vanishes and seems to shift to Italy. Furthermore, two positive coefficients exist between Italy and Spain. These co-movements show that shocks in Italian and Spanish stocks lift the yield in the other “peripheral” country. This confirms that negative developments in one of these two countries, simultaneously increase the perceived risk in the other country. Consequently, investors seem to not distinguish between these two countries to a specific extent.
Table 10: VAR Model (1) including Equity Shock Dummies Subsample 08-11 Dependent Variable Germany Equity France Equity Italy Equity Spain Equity Netherland Equity Belgium Equity Austria Equity
German Eq. Shock - - -0.017* -0.011* -0.010* -0.007 -0.015*
France Eq. Shock -0.014* - -0.003 -0.009 -0.009* -0.006 -0.002
Italy Eq. Shock -0.015* -0.015* - -0.021* -0.013* -0.001 -0.017*
Spain Eq. Shock -0.005 -0.002 -0.018* - -0.004 -0.006 -0.007
NL Eq. Shock -0.011* -0.014* -0.013* -0.009* - -0.018* -0.013*
Belgium Eq. Shock -0.006* -0.010* -0.002 -0.011* -0.014* - -0.019*
Austria Eq. Shock -0.012* -0.009* -0.010* -0.007* -0.011* -0.014* -
Germany Sov. Debt France Sov. Debt Italy Sov. Debt Spain Sov. Debt Netherland Sov. Debt Belgium Sov. Debt Austria Sov. Debt
German Eq. Shock - -0.036* -0.040 -0.075* -0.036* -0.027 -0.034*
France Eq. Shock -0.026 - -0.023 -0.047* -0.009 -0.023 -0.023
Italy Eq. Shock -0.063* -0.018 - 0.119* -0.040* 0.037* -0.014
Spain Eq. Shock -0.001 -0.016 0.093* 0.005 -0.008 0.009
NL Eq. Shock 0.007 0.011 -0.008 -0.013 - -0.009 0.009
Belgium Eq. Shock -0.023* -0.020 -0.035* 0.001 -0.014 - -0.010
Austria Eq. Shock -0.003 0.009 -0.012 -0.015 0.012 0.002 -
!
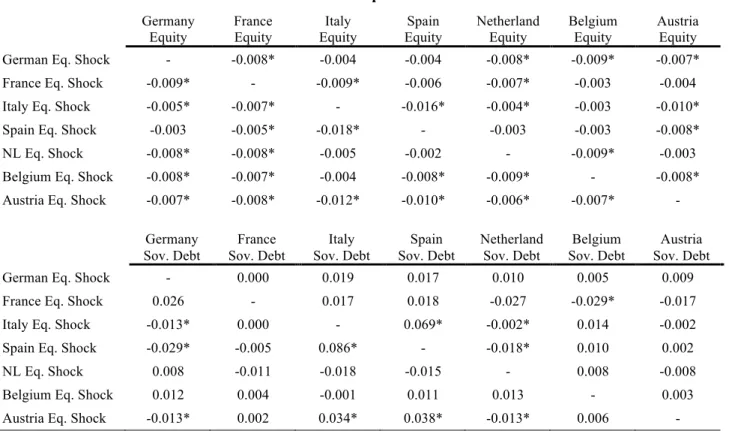
Table 11 indicates that the effects of equity shocks on other national stock indices between 2012 and 2016 have only marginally changed. Some coefficients change their significance, though no clear pattern can be observed. Turning to sovereign debt markets, the effect of German equity shocks disappears. Rather the German and Dutch sovereign yields are affected by equity shocks in Italy and Spain. Pressure on stock markets in these two countries lead to decreasing yields in Germany and the Netherlands. Moreover, negative developments in Italian or Spanish stocks also leads to pressure in the respective sovereign bond market of the other “peripheral” country. These findings represent another confirmation of the segregation between riskier (Italy, Spain) and less risky countries (Germany, Netherlands). An exception to this differentiation is represented by the reaction of the Austrian sovereign debt market to equity shocks. As a presumably less risky country it exhibits similarities to Italy and Spain: shocks in the national equity market decrease yields in Germany and the Netherlands, while increasing yields in Italy and Spain.
Table 11: VAR Model (1) including Equity Shock Dummies Subsample 12-16 Dependent Variable Germany Equity France Equity Italy Equity Spain Equity Netherland Equity Belgium Equity Austria Equity
German Eq. Shock - -0.008* -0.004 -0.004 -0.008* -0.009* -0.007*
France Eq. Shock -0.009* - -0.009* -0.006 -0.007* -0.003 -0.004
Italy Eq. Shock -0.005* -0.007* - -0.016* -0.004* -0.003 -0.010*
Spain Eq. Shock -0.003 -0.005* -0.018* - -0.003 -0.003 -0.008*
NL Eq. Shock -0.008* -0.008* -0.005 -0.002 - -0.009* -0.003
Belgium Eq. Shock -0.008* -0.007* -0.004 -0.008* -0.009* - -0.008*
Austria Eq. Shock -0.007* -0.008* -0.012* -0.010* -0.006* -0.007* -
Germany Sov. Debt France Sov. Debt Italy Sov. Debt Spain Sov. Debt Netherland Sov. Debt Belgium Sov. Debt Austria Sov. Debt
German Eq. Shock - 0.000 0.019 0.017 0.010 0.005 0.009
France Eq. Shock 0.026 - 0.017 0.018 -0.027 -0.029* -0.017
Italy Eq. Shock -0.013* 0.000 - 0.069* -0.002* 0.014 -0.002
Spain Eq. Shock -0.029* -0.005 0.086* - -0.018* 0.010 0.002
NL Eq. Shock 0.008 -0.011 -0.018 -0.015 - 0.008 -0.008
Belgium Eq. Shock 0.012 0.004 -0.001 0.011 0.013 - 0.003
Austria Eq. Shock -0.013* 0.002 0.034* 0.038* -0.013* 0.006 -
!
7.3.2! Sovereign Debt Shocks
Table 12, 13 and 14 display possible extreme co-movements among financial markets following a negative shock to the 10-year sovereign bond yield in one of the considered countries. As already mentioned, a negative shock to a sovereign debt market is identified by 5% of the most positive residuals in the domestic cross-asset VAR model (1). Positive residuals in the sovereign debt market imply that the observed government yield on a specific trading day is considerably higher than what would be predicted by the model. A higher yield corresponds with a lower bond price and thus shows that investors perceive the bond as relatively riskier.
Looking at the effects of sovereign debt shocks on equity markets in the pre-crisis subsample in Table 12, shows a limited number of significant co-movements. Negative developments in German and French sovereign bond markets have a positive effect on stocks in the Netherlands and Belgium. Additionally, unexpected movements in French and Dutch
yields tend to increase the Germany equity index. As this subsample does not include any considerable tensions in sovereign debt markets, rising sovereign yields might indicate a greater willingness of investors to increase risk in their portfolio. Accordingly, investments in government bonds are reallocated into specific equity markets. Moreover, the Italian and Spanish equity market seem to be isolated, not affected by any cross-country yield shocks. The effect of sovereign debt shocks to other European sovereign bond markets again confirms the dominant role of German government debt as a benchmark for European sovereign debt markets. Unexpected negative developments in the German market tend to also induce pressure on sovereign debt in other European countries. Besides the strong influence of German public debt, in general European sovereign debt markets are highly integrated, evidenced by many significant extreme co-movements among the considered countries and the high correlation in this period mentioned above.
Table 12: VAR Model (1) including Sovereign Debt Shock Dummies Subsample 02-07
Dependent Variable Germany Equity France Equity Italy Equity Spain Equity Netherland Equity Belgium Equity Austria Equity
German Sov. Shock - 0.006 0.005 0.006 0.008* 0.008* 0.007*
France Sov. Shock 0.010* - 0.006 0.004 0.010* 0.008* 0.002
Italy Sov. Shock -0.001 -0.002 - -0.003 -0.002 -0.006 -0.002
Spain Sov. Shock -0.003 -0.003 -0.005 - -0.004 -0.002 -0.009
NL Sov. Shock 0.008* 0.008* 0.003 0.005 - 0.004 0.000
BEL Sov. Shock 0.003 0.006 0.002 0.000 0.003 - 0.005
Austria Sov. Shock 0.002 0.003 0.000 0.002 0.002 0.002 -
Germany Sov. Debt France Sov. Debt Italy Sov. Debt Spain Sov. Debt Netherland Sov. Debt Belgium Sov. Debt Austria Sov. Debt
German Sov. Shock - 0.019* 0.021* 0.024* 0.032* 0.023* 0.023*
France Sov. Shock 0.008 - 0.013 0.012 0.025* 0.021* 0.022*
Italy Sov. Shock 0.020* 0.020* - 0.019* 0.013 0.020* 0.014
Spain Sov. Shock 0.018* 0.011 0.019* - 0.005 0.013 0.006
NL Sov. Shock 0.029* 0.022* 0.022* 0.016* - 0.013 0.014
BEL Sov. Shock 0.015 0.020* 0.013 0.019* 0.013 - 0.018
Austria Sov. Shock 0.015 0.014 0.016* 0.013 0.013 0.015 -
!
The extreme co-movements in the second subsample exhibit two patterns, both indicating again a segregation between countries (see Table 13). While shocks to sovereign debt markets in presumably safer countries (Germany, Netherlands) positively influence cross-border equity markets, the countries that were more affected by the crisis (Italy, Spain) negatively influence European stock indices. This pattern seems to indicate that the market perceives shocks to yields in these two country groups differently. Unexpected yield increases in Germany and the Netherlands coexist with positive market sentiments, whereas shocks in Italy and Spain cause market pressure in European equity markets. As German and Dutch government bonds are perceived as one of safest financial assets in Europe, a decreasing demand for them indicates less uncertainty in the markets and thus an increasing appetite for risk by investors. By contrast, increasing yields in Italy and Spain are caused by concerns about the fiscal state of these two countries and their economy. These events increase uncertainty in European financial markets and thus induce pressure on cross-border equity prices.
Table 13: VAR Model (1) including Sovereign Debt Shock Dummies Subsample 08-11 Dependent Variable Germany Equity France Equity Italy Equity Spain Equity Netherland Equity Belgium Equity Austria Equity
German Sov. Shock - 0.015* 0.019* 0.020* 0.016* 0.015* 0.012*
France Sov. Shock 0.003 - 0.000 -0.001 0.000 -0.002 -0.002
Italy Sov. Shock -0.015* -0.013* - -0.014* -0.011* -0.006 -0.012*
Spain Sov. Shock -0.003* -0.001 -0.011* - - -0.002 -0.007
NL Sov. Shock 0.017* 0.008 0.008 0.007 -0.002 0.006 0.016*
BEL Sov. Shock -0.002 -0.003 -0.008* -0.004 -0.002 - 0.000
Austria Sov. Shock 0.004 0.007* 0.006 0.004 0.009* 0.004 -
Germany Sov. Debt France Sov. Debt Italy Sov. Debt Spain Sov. Debt Netherland Sov. Debt Belgium Sov. Debt Austria Sov. Debt
German Sov. Shock - 0.047* -0.014* -0.004* 0.069* 0.018 0.032*
France Sov. Shock 0.040* - 0.041* 0.038* 0.027* 0.046* 0.058*
Italy Sov. Shock -0.028* -0.009 - 0.102* -0.019* 0.055* -0.002
Spain Sov. Shock -0.015 0.008 0.101* - -0.007 0.032* -0.010
NL Sov. Shock 0.082* 0.000 -0.081* -0.041* - -0.017 0.025*
BEL Sov. Shock 0.001 0.041* 0.102* 0.077* 0.015 - 0.032*
Austria Sov. Shock 0.027* 0.068* 0.028* 0.001 0.049* 0.054* -
!
!
The effect of sovereign shocks on stock markets in the last subsample, illustrated by Table 14, shows the same pattern as between 2007 and 2011: German shocks coexist with positive sentiments in other European equity markets, while unexpected negative developments in the Italian and Spanish sovereign debt market lead to pressure on European equity indices. The negative effect of shocks in Italy and Spain is even more pronounced than in the first subsample, now leading to pressure in all other considered equity markets. The significant decrease of sovereign yields in Italy (-6.37%) and Spain (-5.23%) between 2012 and 2016, which is mainly due to ECB’s unconventional monetary policy, might provide an explanation. As the sovereign debt shock dummies mostly coexist with increasing yields in the respective market, the increased markets risk has to outweigh the positive effects of the monetary policy in order to increase yields on that trading day.
The reaction of sovereign debt markets to yield shocks in other countries does not reveal any major changes relative to the second subsample. Some coefficients change their significance but without showing any clear pattern.
Table 14: VAR Model (1) including Sovereign Debt Shock Dummies Subsample 12-16
Dependent Variable Germany Equity France Equity Italy Equity Spain Equity Netherland Equity Belgium Equity Austria Equity
German Sov. Shock - 0.007* 0.012* 0.012* 0.004* 0.004* 0.007*
France Sov. Shock 0.006* - 0.004 0.006* 0.004* 0.003 0.005
Italy Sov. Shock -0.010* -0.012* - -0.021* -0.010* -0.008* -0.013*
Spain Sov. Shock -0.007* -0.008* -0.020* - -0.006* -0.007* -0.010*
NL Sov. Shock 0.003 0.002 0.002 -0.001 - -0.001 0.004
BEL Sov. Shock -0.004 -0.003 -0.010* -0.007* -0.003 - -0.003
Austria Sov. Shock 0.004 0.004 0.006 0.002 0.002 0.001 -
Germany Sov. Debt France Sov. Debt Italy Sov. Debt Spain Sov. Debt Netherland Sov. Debt Belgium Sov. Debt Austria Sov. Debt
German Sov. Shock - 0.033* -0.051* -0.044* 0.063* 0.007 0.031*
France Sov. Shock 0.032* - 0.024 -0.021 0.036* 0.041* 0.030*
Italy Sov. Shock -0.012* 0.032* - 0.183* 0.000 0.033* 0.017*
Spain Sov. Shock -0.030* -0.010 0.145* - -0.016* 0.008 -0.003
NL Sov. Shock 0.072* 0.017* 0.007 0.032* - 0.019* 0.016*
BEL Sov. Shock -0.002 0.035* 0.058* 0.049* 0.013 - 0.043*
Austria Sov. Shock 0.024* 0.032* -0.009 -0.002 0.020* 0.043* -
Table 15: Overview of main Findings
!
! 1st Subsample 2nd Subsample 3rd Subsample
Domestic Cross-Asset Linkages
(Model 1)
-!All countries exhibit similar linkages between their national equity and debt market, showing a high degree of homogeneity across all countries -!The sovereign debt market influences the domestic
equity market - an increasing yield tends to decrease the domestic equity index
-!Signs of increasing heterogeneity among countries, shown by differences in model coefficients
-!Equity becomes the dominant market influencing the domestic sovereign yield, whereas public debt loses its influence on the domestic stock index
-!The national sovereign debt market completely loses its influence on the domestic equity market
Cross-Country Linkages (Model 2) Equity Market
-!Only a few significant cross-country interdependencies
-!Spanish equity becomes the most influential stock market
-!Smallest economies (NL, BEL, AUS) develop considerable
interdependencies among each other
-!Number of negative
interdependencies among national equity markets increases, indicating “flight to safety” phenomenon. Safe countries (GER, NL) vs. risky countries (IT, ESP and partially BEL)
Sovereign Market
-!GER sovereign debt negatively influences all other yields, indicating the hegemonic status of GER public debt
-!Negative linkages indicate further differentiation of countries: "core” countries (GER, NL, FR) vs. “peripheral” countries (IT, ESP)
-!Negative interdependencies between countries disappear, indicating that country-specific risk factors vanish
Extreme Co-Movements (Model 2 including dummies) Equity Market Shocks
-!Shocks in most markets negatively affect almost all other national stock indices
-!Small equity markets in BEL and AUS exhibit
some robustness against shocks in GER, IT, ESP and NL
-!Shocks in GER, ESP and AUS tend to coexist with decreasing yields in most other countries
-!BEL stock index is not susceptible to any external stocks
-!Shocks in ESP do not coexist with pressure on stock prices in other countries
-!Shocks in IT and ESP lift the sovereign yield in the other “peripheral” country
-!Effect of GER shocks on other courtiers disappears - rather GER and NL yields are affected by equity shocks in IT and ESP!
Sovereign
Debt Market
Shocks!
-!Shocks in GER, FR and NL positively affect stock indices in other countries
-!IT and ESP equity market seem to be isolated, not being affected by any cross-country yield shocks -!Shocks in GER tend to induce pressure on
sovereign debt markets in all other countries -!Sovereign debt markets are highly integrated,
evidenced by many significant extreme co-movements among the sample countries
-!GER shocks coexist with positive sentiments in other equity markets -!Unexpected negative developments in IT and ESP lead to pressure
on most other equity indices
-!Increasing number of extreme interdependencies among markets
-!Cross-border effects of shocks become stronger, evidenced by higher absolute coefficients
-!Negative interdependencies appear, implying that yields in some countries (IT, ESP) decrease as a consequence of unexpected yield increases in other countries (GER, NL)
-!Effect of shocks on equity show similar pattern as in 1st subsample!