143
Pakistan Veterinary Journal
ISSN: 0253-8318 (PRINT), 2074-7764 (ONLINE)Accessible at: www.pvj.com.pk
Comparison of Isolation Frequency of
Mycobacterium avium
subspecies
paratuberculosis
from
Different Types of Samples
Mohammad Seyyedin1*, Taghi Zahraei2, Mohsen Fathi Najafi1
1Department of Veterinary Research and Biotechnology, Razi Vaccine and Serum, Research Institute, Mashhad, Iran 2
Departemnet of Microbiology, Faculty of Veterinary Medicine, University of Tehran, Tehran, Iran *Corresponding author: [email protected]
A R T I C L E H I S T O R Y A B S T R A C T
Received: June 09, 2009 Revised: January 21, 2010 Accepted: February 24, 2010
Key words: Comparison
Isolation
Mycobacterium avium
Paratuberculosis
Samples of feces, manure and milk of 137 dairy cattle herds were collected from different parts of Razavi Khorasan province of Iran. These herds were suspected of having Johne's disease. There were 505 faecal and manure samples and 148 raw milk samples prepared from cows affected by the clinical form of Johne's disease (n = 12), bulk milk-transporters (n = 67) and farm bulk milk tanks (n = 69). The samples were cultured on Herrold’s egg yolk medium with and without mycobactin J. The samples in which the bacteria could merely grow on Herrold’s media containing mycobactin J were considered to be positive. Diagnostic test of M.
paratuberculosis culture was positive in 29 out of 137 herds. Out of feces, manure
and milk samples, 50 cases were found positive. The number of bacterial colonies varied from 1 to 250. The frequency of positive and negative fecal samples taken from cows with clinical signs (n=16) and without clinical signs of Johne’s disease (n=363), 13(81.3%) and 15(4.1%) were positive, respectively. The difference in positive samples between two groups of manure samples taken from outdoors and indoors of farms was non significant. The difference in positive cases among three different types of milk samples was significant, but these differences between two groups of bulk milk-transporters and farm bulk milk tanks were non significant. Using Fisher exact test, the comparison between fecal and raw milk samples from cows with clinical signs showed non significant difference between two groups, but these differences based on the number of positive tubes and their colonies were significant.
©2010 PVJ. All rights reserved To cite this article: Seyyedin M, T Zahraei and Najafi MF, 2010. Comparison of isolation frequency of
Mycobacterium avium subspecies paratuberculosis from different types of samples. Pak Vet J, 30(3): 143-149.
INTRODUCTION
Paratuberculosis, also known as Johne's disease, is a chronic granulomatous enteritis that affects domestic and wild ruminants. It is caused by Mycobacterium
paratuberculosis (Grant et al., 1998). Because of its long
incubation period, mainly subclinical or hidden forms of the disease are noticed. However, after a long subclinical phase, clinical signs such as cachexia and diarrhea can be recorded (Bhidea et al., 2006). The caustive agent of paratuberculosis is a gram-positive, motile, non-spore-forming, acid-fast and facultative anaerobic intracellular bacterium. However, some non-acid fast, lightly acid-fast and cell wall-deficient types are also encountered. The bacilii generally occurs in clumps linked together by a network of intercellular filaments (Ayele et al., 2001; Henderson et al., 2003). It grows slowly and is a non-chromogenic, biochemically unreactive organism
that requires mycobactin-enriched media for growth. M.
paratuberculosis contains approximately 15-20 copies of
the insertion sequence IS900 (Cousins et al., 2000). On Herrold's egg yolk agar medium (HEYM), one of the most commonly used culture media in veterinary diagnostic laboratories, the colonies appear small, somewhat rough and off-white to yellow in colour (Collins, 2003). M.
paratuberculosis strains have been classified into three
groups (types I, II, and III) based on culture characteristics and molecular characterization by PFGE and IS900-RFLP (de Juan et al., 2006).
A major advantage of fecal culture is that it can identify cattle 1-3 years prior to the appearance of clinical signs (Radostits et al., 2007). Fecal culture by radiometric technique is also available. This method is faster, and slightly more sensitive than conventional culture systems but is more expensive and requires specific instruments (Songer and Post, 2005; Gumber and Whittington, 2007; Radostits et al., 2007).
The main aim of this study was comparison of isolation frequency of Mycobacterium avium subspecies
paratuberculosis from different types of samplesand the
detection of subclinical forms of Johne’s disease and recognition of infected dairy herds.
MATERIALS AND METHODS Sampling
From May 2006 to October 2007, 505 feces and manure samples and 148 raw milk samples including samples from the bulk milk transporters, from cows with clinical signs of paratuberculosis, and from bulk milk tanks were taken from 137 dairy farms from different parts in Razavi Khorasan province, Iran. The samples were randomly collected from herds suspected of having Johne's disease. With the exception of samples from the bulk milk transporters, other milk samples were taken from both cows infected by the clinical form of paratuberculosis and bulk milk tank of farms from where fecal samples were also taken. No manure sample was taken from farms from which milk or fecal samples were collected. Also, none of the farms was bacteriological tested for detection of M. Paratuberculosis before the study.
Medium preparation
For cultivation of M. Paratuberculosis, Herrold's medium was prepared according to OIE (2004). In order to prevent bacterial and fungal contamination, 50 mg/L nalidixic acid, 50 mg/L amphotericin B and 50 mg/L vancomycin were added to the medium.
Fecal samples
A total of 379 fecal samples were collected from dairy farms. The samples were directly taken from the cows’ rectum. Among these, 16 samples were taken from cows with advanced clinical signs of Johne's disease, 53 were taken from cows without clinical signs but having contact with clinical cases of Johne’s disease and the rest of the samples were from animals that had no contact with clinical cases of paratuberculosis. Following collection, samples were immediately placed in a container with ice packs and transported to the laboratory, where 10g of each sample was stored at -70ºC until use for bacterial culture. Manure samples
A total of 126 manure samples were taken from different herds with the history of Johne's disease. Among these, 63 were sampled from outdoor dairy herds, and the other samples were taken under similar conditions from the same herds indoors. After collection, all samples were transported to the laboratory under cold condition and stored as stated above.
Raw milk samples
A total of 148 raw samples were obtained from different regions. Out of these, 67 samples were from bulk milk transporters with the capacity of 10000-15000 liters, 69 samples were from the farm bulk milk tanks having the history of Johne's disease, while 12 samples were from cows showing clinical signs of Johne's disease (fecal samples were taken simultaneously from these cows). After collection, all samples were transported to the laboratory under cold condition. Appropriate amount of milk sample (50 ml) was centrifuged at 4ºC (3100 g, 15 min). Cream and pellet fractions were mixed together and kept at -70ºC for bacterial culture.
Culture of fecal and manure samples
Fecal and manure samples were cultured on Herrold’s egg yolk agar medium (HEYM) with and without mycobactin J (OIE 2004). The samples, in which the bacteria could merely grow on Herrold’s media containing mycobactin J, were considered to be positive. Additional tests such as colony morphology, acid fast staining and Nested PCR–IS900 assay were performed to confirm isolated bacteria.
Milk culture
The isolation was done according to Dundee et al. (2001), Grant et al. (2005) and Gao et al. (2005), with some modifications. Briefly, each pellet and cream fraction was re-suspended in 20 ml of Hexadecylpyri- dinium chloride (HPC) 0.75% (w/v) and incubated for 5h at room temperature. Following incubation, samples were centrifuged at 4ºC (Bhidea et al., 2006) for 15 min, the pellet was separated from supernatant and resuspended in 1 ml sterile PBS buffer. The new suspension (100-200 µL) was used for transferring on Herrold’s media, similar to fecal culture.
Colonial morphology
The isolated bacteria from feces, manure and milk were examined for colony morphology as well as acid fast staining.
DNA extraction
DNA extraction was performed by taking single colonies. The single bacterial colony was taken from the HEYM medium containing mycobactin J and resuspended in 50 µl distilled water in a screw-cap micro-centrifuge tube. The samples were boiled for 20 min prior to being centrifuged at 14000g for 5 min to settle cell debris. Then 2 µL of supernatant containing the genomic DNA, was used for Nested PCR-IS900 amplification (Hosek et al., 2006).
PCR
PCR assay was performed for confirmation of M.
paratuberculosis and was done according to Erume et al.
tube. Samples were subjected to an initial denaturation step of 94°C for 5 min and then to 30 cycles of denaturation at 94°C for 1 min, annealing at 58°C for 1 min and extension at 72°C for 1 min in a Eppendorf Mastercycler gradient. DNA of M. paratuberculosis strain 316F and sterile buffer were used as positive and negative controls, respectively.
Nested PCR assay was done with primers “para 1” (5’- TGA TCT GGA CAA TGA CGG TTA CGG A -3’) and “para 4” (5’- CGC GGC ACG GCT CTT GTT- 3’) that were used to amplify a 563 bp target region of M.
avium subsp. paratuberculosis IS900 sequence. Then, 5 µl
of each of the initial amplification products was transferred to new tubes containing the same reaction mixture described above (exception of oligonucleotide primers para 1 and para 4) and re-amplified using the primers ”para 2” ( 5’- GCC GCG CTG CTG GAG TTG A -3’) and “ para 3” (5’- AGC GTC TTT GGC GTC GGT CTT G -3’). The second PCR products were analyzed on a 1.2% agarose gel containing 0.5% ethidium bromide and visualized by UV-light transilluminator.
Statistical analyses
Frequency of positive and negative samples of different types was computed. In order to see the magnitude of variation, the data were analyzed statistically using Pearson Chi square test and Fisher exact test.
RESULTS
In this study, we identified and confirmed that cattle were susceptible to Johne’s disease on the dairy cattle herds in Razavi Khorasan province, Iran. Also, application of different types of samples for detection of paratuberculosis was evaluated. Diagnostic test of M.
paratuberculosis culture was positive in milk, manure and
fecal samples of 29 out of 137 herds (21.17%). Out of 653 samples, 50 cases (7.66%) were found positive for M.
paratuberculosis after cultivation.
Colonial morphology
It was possible to observe M. paratuberculosis
colonies on Herrold’s media containing mycobactin J from the 9th week onward. In the beginning, colonies were small, about 1 mm in diameter, but their diameter gradually increased up to 3 mm. The colonies were spherical, semi-transparent or translucent, bright in appearance, smooth to somewhat rough and off-white to yellow in colour (Fig. 1). The number of bacterial colonies varied from 1 to 250. The highest and the lowest number of colonies were found in the fecal samples of clinically Johne’s-affected cows and raw milk samples of farm bulk milk tanks, respectively (Table 1). All the isolated bacteria were confirmed through colony morphology, acid fast staining and Nested PCR–IS900 assay.
Nested PCR
The all isolated strains were PCR positive and target gene with 210 bp sizes was observed. This corresponds
with size of band of positive control (M. avium subsp.
paratuberculosis strain 316F) (Fig. 2).
Isolation of M. Paratuberculosis from fecal and manure samples
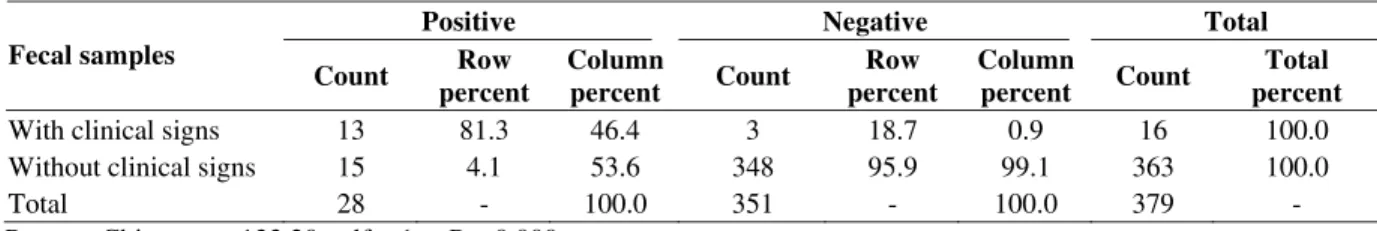
Table 2 shows the frequency of the positive and negative fecal samples from cows with and without clinical signs of Johne’s disease. Among 16 samples taken from the cows with clinical signs, 13(81.3%) were positive after cultivation, while this number for the 363 cows without clinical signs of Johne’s disease was 15(4.1%). This indicates that there are considerable differences in both groups. Further analysis by Pearson Chi square test revealed that the difference between the two groups was statistically significant (p<001). According to the results, the number of positive tubes and number of colonies were closely related.
The cows without clinical signs belonged to two groups either exposed to or non-exposed to the clinical cases of Johne’s disease. As shown in Table 3, out of 53 samples from animals exposed to sick cows, 11(20.8%) were positive, while this value for non exposed group was 1.3% (4 samples from 310 samples). The difference between the two groups was statistically significant (P<0.05).
The results of the manure samples taken from dairy farms are shown in Table 4. Out of 63 samples taken from outdoors and 63 samples from indoors, only 3(4.8%) and 7(11.1%) were positive, respectively. The difference between these two groups was non significant.
Isolation of M. paratuberculosis from milk
None of the samples taken from bulk milk transporters was found positive for M. paratuberculosis. Out of 69 samples taken from farm bulk milk tanks, 5(7.3%) were positive. But the samples from cows showing the illness signs showed 58.3% positive (Table 5). The differences in the frequency of positive cases among three groups were significant (P<0.05). Since the number of positives in the samples related to bulk milk transporters and farm bulk milk tanks were not different, positives samples from the milk of cows showing signs were removed from the analysis and then other two groups were compared with Fisher test which revealed non significant difference between the two groups (Table 6).
Comparison between fecal and raw milk samples from cows with clinical signs
Fig. 1: Mycobacterium avium subsp paratuberculosis colonies on Herrold’s egg yolk medium containing mycobactin J. E = colonies isolated from cows showing clinical signs of Johne’s disease. A, B and C = colonies isolated from raw milk samples and D, F, and G = colonies isolated from fecal samples of the cows without the sings of Johne’s disease.
Fig. 2: The result of Nested-PCR of Mycobacterium avium subsp. paratuberculosis isolated from feces, manure and milk samples growth in specific media. Lane 1 molecular weight of standard (100 bp), Lane 2-13 isolated strains, Lane 14 negative control (sterile buffer), Lane 15 positive control (M. avium subsp. paratuberculosis
strain 316F)
.
Table 1: The number of positive tubes and their related colonies of milk, manure and fecal culture Type of samples
Raw milk Feces Manure
Colony count Cows with clinical
signs
Farm bulk milk
tanks
Bulk milk transporters
Cows with clinical
signs
Cows without clinical signs
(expose)
Cows without clinical signs (Non-expose)
Outdoors Indoors
1-10 0 5 0 0 0 0 0 0
11-50 10 0 0 0 11 4 3 7
51-100 1 0 0 21 0 0 0 0
101-250 0 0 0 12 0 0 0 0
Table 2: The frequency of positive and negative fecal samples for cows with and without clinical signs of Johne’s disease
Positive Negative Total
Fecal samples
Count Row percent
Column
percent Count
Row percent
Column
percent Count
Total percent
With clinical signs 13 81.3 46.4 3 18.7 0.9 16 100.0
Without clinical signs 15 4.1 53.6 348 95.9 99.1 363 100.0
Total 28 - 100.0 351 - 100.0 379 -
Pearson Chi-square: 133.20, df = 1, P = 0.000
Table 3: The frequency of positive and negative fecal samples for cows without clinical signs either exposed to or non exposed to the clinical cases of Johne’s disease
Positive Negative Total
Fecal samples
(without clinical signs) Count Row percent
Column
percent Count
Row percent
Column
percent Count
Row percent
Exposed to 11 20.8 73.3 42 79.2 12.1 53 100
Non-exposed 4 1.3 26.7 306 98.7 87.9 310 100
Total 15 - 100 348 - 100 363 -
Pearson Chi-square: 43.29, df = 1, P- value = 0.000
Table 4: The frequency of positive and negative manure samples
Positive Negative Total
Manure samples
Count Row percent
Column
percent Count
Row percent
Column
percent Count
Row percent
Outdoors 3 4.8 30 60 95.2 51.7 63 100
Indoors 7 11.1 70 56 88.9 48.3 63 100
Total 10 - 100 116 - 100 126 -
Pearson Chi-square: 1.74, df = 1, P = 0.19
Table 5: The frequency of the positive and negative raw milk samples taken from bulk milk transporters, farm bulk milk tanks of dairy farms and the milk samples of the cows showing clinical signs of Johne’s disease
Positive Negative Total
Raw milk samples
Count Row percent
Column
percent Count
Row percent
Column
percent Count
Row percent
Bulk milk transporters 0 0 0 65 100 48.5 65 100
Farm bulk milk tanks 5 7.3 41.7 64 92.7 47.8 69 100
Cows with clinical signs 7 58.3 58.3 5 41.7 3.7 12 100
Total 12 - 100 134 - 100 146 -
Pearson Chi-square:45.86, df = 2, p = 0.00
Table 6: The frequency of the positive and negative raw milk samples taken from the bulk milk transporters and farm bulk milk tanks of dairy farms
Positive Negative Total
Raw milk samples
Count Row Percent
Column
Percent Count
Row Percent
Column
Percent Count
Row Percent
Bulk milk transporters 0 0 0 65 100 50.4 65 100
Farm bulk milk tanks 5 7.3 100 64 92.7 49.6 69 100
Total 5 - 100 129 - 100 134 -
Fisher exact test: p = 0.06
Table 7: The frequency of the positive and negative fecal and raw milk samples taken from cows showing clinical signs of Johne’s disease
Positive Negative Total
Samples
Count Row percent
Column
percent Count
Row percent
Column
percent Count
Row percent
Feces 13 81.3 65 3 18.7 37.5 16 100
Raw milk 7 58.3 35 5 41.7 62.5 12 100
Total 20 - 100 8 - 100 28 -
Table 8: Comparison of the number of positive tubes and their colonies of fecal and milk samples of clinical cases of Johne’s disease
Fecal samples Milk samples
Colony count
0 10
11-50
21 1
51-100
12 0
101-250
33 11
Total
Pearson Chi-square: 34.9744, df = 2, p = 0.000 DISCUSSION
In this study, we identified and confirmed that the cattle were susceptible to Johne’s disease on the dairy cattle herds in Razavi Khorasan province, Iran. Razavi Khorasan province is one of the largest provinces in Iran in terms of size and animal populations. It is located in the north east of Iran and borders with Afghanistan and Turkmenistan.
As explained in Tables 2 and 3, significant differences were observed in the frequency of positive animals between the cows with and without clinical signs. Also, differences were seen in the number of positive tubes and the number of organism colonies (Table 1). The transmission of M. paratuberculosis via milk and colostrum increases the risk of paratuberculosisinfection in the herd (Manning et al., 1988). Also, with the continous development and phase-switching of disease from subclinical to clinical, bacterial shedding rate in milk and especially in the feces increases. This increase in bacterial shedding, specifically in feces, causes extension of environmental contamination and increases the frequency of affected animals. Similar findings have been reported by Whittington and Sergeant (2001). When the feces containing the M. paratuberculosis mix with soil, there is a reduction of 90-99% in the apparent viable count of the organism. This is probably caused by binding of bacteria to soil particles, which are excluded from culture by sedimentation during sample preparation (Whittington et al., 2003). Also, attachment to soil occurs with other non tuberculous mycobacteria (Brooks et al., 1984). M. Paratuberculosis is relatively susceptible to sunlight and drying, and continuous contact with urine and feces reduces the longevity of the bacteria (Jørgensen, 1977).
It was expected that there would be a significant difference between the manure samples collected from indoors and outdoors, but the differences were not significant statistically (Table 4). This is probably related to the small number of samples and their conditions, including conditions of collection, storing and period of storing manure at various farms. M. paratuberculosis may be transmitted prenatally or postnatally, when most infection occurs through the fecal-oral route (Sweeney, 1996). The commonest route of infection with M.
paratuberculosis is through nursing from an infected dam
(via contaminated teats or direct shedding of the organism into the colostrum/milk) or ingestion of contaminated feed and water. Cows affected by clinical or subclinical form of Johne’s disease can shed a large number of M.
paratuberculosis into colostrum or milk. Thus, colostrum
or milk of infected cows, if fed to calves, could serve as a potential source of infection (Radostits et al., 2007).
Removal of the calf from the dam at birth before nursing is one strategy that helps reduce the incidence of Johne’s disease (Rossiter and Burhans, 1996).
There was significance difference between the milk samples belonging to clinical cases and the other two groups. Therefore, a comparison was done between the milk samples taken from bulk milk transporters and farm bulk milk tanks. However, no significant difference was observed statistically between both groups, which seems to be due to the small number of samples. Nearly 10% of subclinically infected cows and 50% of animals showing clinical paratuberculosis excreted the agent in the milk (Pavlas, 2005). Also, according to some of reports do not different between diagnostic sensitivity M. paratuber-
culosis from milk and feces under identical conditions
(Sweeney et al., 1992; Pillai and Jayarao, 2002), but on the other hand, the number of M. paratuberculosis shed through milk compared with feces is less (Radostits et al., 2007). For this reason a comparison was made between the frequency of isolation of bacteria from milk and the feces of cows showing clinical signs of Johne’s disease. There were numerical differences between the two types of samples, but the differences were not significant statistically. This lack of statistical difference may be due to the small number of samples. Therefore, comparison was done between the number of the positive tubes and their bacterial colonies. In this comparison, statistically significant differences were seen between isolation of bacteria from milk and feces.
It is essential to remark that the sale of calves and the transportation of animals and their manure may be prohibited until the results of two consecutive fecal culture tests (with an interval of six or 12 months) are negative. Not only organization of educational workshops for scientists of veterinary laboratories and veterinarians, but also making the owners of cattle herds aware of the importance of Johne’s disease will be useful. In addition to fecal samples, examination of manure samples and milk samples taken from farm bulk milk tanks can help to detect subclinical forms of Johne’s disease. In conclusion, according to the current report of bacterial isolation from different places and the economic importance of Johne’s disease, it is logical and essential that the prevalence rate of the disease in dairy cattle herds is initially determined by at least two different types of samples and tests and afterwards the control programs are adopted.
Acknowledgments
We would like to acknowledge the collaboration of the management and personnel of the Department of Microbiology & Immunology, College of Veterinary Medicine, Tehran and the collaboration of the manage- ment and staves of biotechnology research department of Razi Vaccine & Serum Research Institute of Mashhad. Special thanks go to the management and staves of veterinary headquarters in Razavi Khorasan province, particularly Dr. Javad Alami who collaborated with us for sending the samples.
REFERENCES
in domestic and wild ruminants. Vet Med Czech, 46: 205-224.
Bhidea M, E Chakurkarb, L Tkacikovaa, S Barbuddheb, M Novakc and I Mikulaa, 2006. IS900-PCR-based detection and characterization of Mycobacterium
avium subsp. paratuberculosis from buffy coat of
cattle and sheep. Vet Microbiol, 112: 33-41.
Brooks RW, KL George, BC Parker and JO Falkinham, 1984. Recovery and survival of nontuberculous mycobacteria under various growth and decontamina- tion conditions. Can J Microbiol, 30: 1112-1117. Collins MT, 2003. Update on paratuberculosis: Epidemio-
logy of Johne’s disease and the Biology of Mycobac-
terium paratuberculosis. Irish Vet J, 56: 565-574.
Cousins DV, SN Williams, A Hope and GJ Eamens, 2000. DNA fingerprinting of Australian isolates of
Mycobacterium avium subsp paratuberculosis using
IS900 RFLP. Aust Vet J, 78: 184-190.
de Juan, L, J Alvarez, B Romero, J Bezos, E Castellanos, A Aranaz, A Mateos and L Dominguez, 2006. Comparison of four different culture media for isolation and growth of type II and type I/III
Mycobacterium avium subsp. paratuberculosis strains
isolated from cattle and goats. Appl Environ Microbiol, 72: 5927-5932.
Dundee L, IR Grant, HJ Ball and MT Rowe, 2001. Comparative evalution of four decontamination protocols for the isolation of Mycobacterium avium
subsp. paratuberculosis from milk. Lett Appl Microbiol, 33: 173-177.
Erume J, J Spergser and R Rosengarten, 2001. Rapid detection of Mycobacterium avium subsp.
paratuberculosis from cattle and zoo animals by
nested PCR. Afr Health Sci, 1: 83-89.
Gao A, J Odumeru, M Raymond, and L Mutharia, 2005. Development of improved method for isolation of
Mycobacterium avium subsp. paratuberculosis from
bulk tank milk: effect of age of milk, centrifugation, and decontamination. Can J Vet Res, 69: 81-87. Grant IR, HJ Ball, SD Neill and MT Rowe 2005.
Investigation of the impact of simulated commercial centrifugation and microfiltration conditions on levels
of Mycobacterium avium ssp. paratuberculosis in
milk. Intern J Dairy Technol, 58: 138-142.
Grant IR, HJ Ball and MT Rowe, 1998. Effect of high-temperature, short-time (HTST) pasteurization on milk containing low numbers of Mycobacterium
paratuberculosis. Lett Appl Microbiol, 26: 166-170.
Gumber S and RJ Whittington, 2007. Comparison of BACTEC 460 and MGIT 960 systems for the culture
of Mycobacterium avium subsp. paratuberculosis S
strain and observations on the effect of inclusion of
ampicillin in culture media to reduce contamination. Vet Microbiol, 119: 42-52.
Henderson DC, CJ Low and G Caldow, 2003. Assessment of surveillance and control of Johne’s disease in farm animals in Great Britain. Report to Defra by Scottish Agricultural College (SAC), Veterinary Science Division, Chapter 2: 12-14.
Hosek J, P Svastova, M Moravkova, I Pavlik and M Bartos, 2006. Methods of mycobacterial DNA isolation from different biological materials: a review. Vet Med, 51: 180-192.
Jørgensen JB, 1977. Survival of Mycobacterium paratu-
berculosis in slurry. Nord Vet Med, 29: 267–270.
Manning EJ, H Steinberg, K Rossow, GR Ruth and MT Collins, 1988. Epizootic of paratuberculosis in farmed elk. J Am Vet Med Assoc, 213: 1320–1322. OIE, 2004. Paratuberculosis (Johne's disease). Manual of
Standards for Diagnostic Tests and Vaccines. 5th Ed. Chapter: 2.2.6.
Pavlas M, 2005. New findings of pathogenesis, diagnostics and control of paratuberculosis in cattle. Acta Vet Brno, 74: 73-79.
Pillai SR and BM Jayarao, 2002. Application of IS900 PCR for detection of Mycobacterium avium subsp.
paratuberculosis directly from raw milk. J Dairy Sci,
85: 1052–1057.
Radostits OM, CC Gay, KW Hinchcliffe and PD Constable, 2007. Veterinary Medicine. 10th Ed, W B Saunders Company, London, UK.
Rossiter CA and WS Burhans, 1996. Farm-specific approach to paratuberculosis (Johne’s disease) control. Vet Clin North Am, Food Anim Pract, 12: 383-415.
Songer JG and KW Post, 2005. Veterinary Microbiology - Bacterial and Fungal Agents of Animal Diseases. Elsevier Saunders, St Louis, Missouri, USA.
Sweeney RW, 1996. Transmission of paratuberculosis. Vet Clin North Am, Food Anim Pract, 12: 305-312. Sweeney RW, RH Whitlock and AE Rosenberger, 1992.
Mycobacterium paratuberculosis cultured from milk
and supramammary lymph nodes of infected asymptomatic cows. J Clin Microbiol, 30: 166-171. Whittington RJ, IB Marsh, PJ Taylor, DJ Marshall, C
Taragel and LA Reddacliff, 2003. Isolation of
Mycobacterium avium subsp. paratuberculosis from
environmental samples collected from farms before and after destocking sheep with paratuberculosis. Aust Vet J, 81: 559–563.
Whittington RJ and ES Sergeant, 2001. Progress towards understanding the spread, detection and control of
Mycobacterium avium subsp paratuberculosis in