PRINT ISSN 2284-7995, E-ISSN 2285-3952
EVOLUTION OF SUGAR BEET AND SUGAR PRODUCTION IN
ROMANIA AFTER ITS ACCESSION INTO THE E.U.
Aurel-Florentin BADIU1, Florentina BADIU2
1
Academy of Agricultural and Forestry Sciences, Bucharest, 59 Marasti, District 1, 11464, Bucharest, Romania, Phone: 00 40 7440 034 396, Email: aurel.badiu@umpp.asas.ro
2
University of Agricultural Sciences and Veterinary Medicine Bucharest, 59 Marasti, District 1, 11464, Bucharest, Romania, Phone/Fax: 00 40 723 279 673, Email: florentina.badiu@gmail.com
Corresponding author: aurel.badiu@umpp.asas.ro
Abstract
The paper presents an analysis of the evolution for sugar beet production and sugar beet extraction after Romania accesion in European Union. The analysis is based on the evolutions of areas, total and average yields per unit of area. The last period (2007- 2013) is compared to the previous period (2001-2006), utilised at reference. Also, it is performed in the four sugar factories respectively (SC AGRANA Romania SA, Sugar Factory Bod, SC sugar Oradea SA, sugar Ludus SA) and it was made for the 2007-2013 period, after the application of EU’s rules for sugar market. The study presents the evolution of the biological sugar content and white sugar content between the years 2007 and 2013 and it evaluates the variability of the way of achieving production quotas. The main conclusion imposed after the analysis is that the systems of sugar production from sugar beet are stabilized. Statistically multi-annual average deviation from the assigned quota is approx .2%. Annual variations of sugar production are set between (-) 15 % - (+) 43%, compared with the Romanian quota (104.688 tons white sugar).
Key words: biological sugar, content, correlations, quotas, stability, sugar beet system, sugar factory, sugar content, sugar production, sugar yield, variability, white sugar
INTRODUCTION
Until 1990, Romania produced approx. 500,000 tons of white sugar, from sugar beet, on a surface area of approx. 200,000-250,000 ha and an average yield of 2.2-2.5 tonsof white sugar per hectare. The annual consumption of sugar was about 20-22 kg sugar/capita/year, including sugar products [1].
Since 1991, some of the 35 sugar factories have ceased production gradually so that in 2007, from the EU accession, four factories were operational, extracting sugar from sugar beet, making annually approx. 100,000 tons of white sugar [1].
Romania's EU accession meant for the sugar beet chain the introduction of annual production quotas, calculated based on historical reference (average production of the
last five years preceding accession
(01/01/2007).
Following the accession negotiations,
Romania had allocated a quota of 109.164 tonsof white sugar from sugar beet, a quantity of 329.636 tons of white sugar from imported raw sugar (known as the traditional supply of
raw cane sugar) and isoglucose quota of 9,981 tons.
In accession moment 10 sugar factories functioned from which three factories (S.C. Agrana S.A.-Roman Branch, S.C. Fabrica de ГКСăr BoН S.A.Ľ S.C. ГКСărЮХ OrКНОК S.A.) processed white sugar from sugar beet and refined raw sugar cane, one factory for sugar
bООЭ onХвĽ (S.C. ГКСărЮХ LЮНЮş S.A.)Ľ sТб
ПКМЭorТОs (S.C. ГКСărЮХ LТОşЭТ S.A.Ľ S.C. Lemarco Cristal Urziceni SRL, S.C. Zaharul CorКЛТК S.A.Ľ S.C. AРrКnК BЮгăЮ SRLĽ S.C. AРrКnК ănНărОТ SRLĽ S.C. ГКСărЮХ CăХărКşТ S.A) for processed raw sugar cane.
The paper analyses the evolution of the sugar beet and white sugar from beet production in Romania, fromthe EU accession in 2007 to 2013, trying to capture the changes that occurred in the system of white sugar from sugar beet production.
PRINT ISSN 2284-7995, E-ISSN 2285-3952
phase.The MS quota level is determined by a conventional instrument called "historical reference of production" and that holds the average sugar production achieved in the last three years, elected from the last five calendar's years preceding the year of accession. Negotiated quotas are managed by administrative authorities of Member States. In our country, the quota distribution was made in accordance with Article 7 of the Regulation (EC) No. 318/2006 on the common organization of the markets in the sugar sector. The criteria underlying the allocation of sugar quotas were established by the Accrediting Commission of the Ministry of Agriculture and Rural Development, in compliance with the Order no. 815/2006 on the accreditation economic operators performing the manufacture of sugar from beet and/or refining raw sugar from cane or isoglucose production, as well as those that use sugar and /or isoglucoseas raw material, along with the representatives of sugar factories.
As a result of the temporary restructuring of the EU sugar regime, in compliance with art. 11 of Regulation (EC) No. 320/2006, in mКrФОЭТnР вОКr 2008Ľ RomКnТК’s qЮoЭК аКs 104,168.8 tons. For the marketing years 2009/10 КnН 2010/11 RomКnТК’s sЮРКr qЮoЭК
was established in accordance with
Regulation (EC) No. 183/2009, and
Regulation (EC) No. 513/2010 amending by the Annex VI of the Council Regulation (EC) No. 1234/2007 regarding the adjustment of sugar quota.
Besides the production quota system one of the main restrictions imposed by the European market regime is the payment of raw material in relation to sugar content. Prior to the EU
accession, thenational system was
administered through quantitative receptionin which the only quantitative parameter introduced was the permitted foreign bodies content (including root top fraction incorrectly removed in the harvesting process and the roots smaller than 150 grams that were removed in the sort process ofthe sugar factory).
In the reception and payment after beet quality there are two operating criteria such as
biological sugar content and white sugar content.Biologicallysugar is the sugar existing in the root cellular juice, whereas white sugar is the crystallized sugar obtained after transformation of roots in sugar factories, the commercial product known as granulated sugar or sugar "in the bag".
It follows that after the transformation of sugar beet results a quantity of white sugar (the commodity production) and some sugar, bio-synthesized in the field, but lost in the process of manufacturing.In other words, in the transformation of sugar beet the content of
white sugar is an indicator of the
manufacturing efficiency.
In this context we cannot considerbiological sugar extraction efficiency because part of it, although extracted it is not found "in the bag" being found in molasses (which has a sugar content that can sometimes exceed 50%) [9]. Also a small amount of biological sugar remains in the noodles, the diffusion process used to extract sugar does not allow full extraction of the sugar stored in the reserve root cells [9].
Another restriction/significant feature of the CAP sugar market regime are the payment of the potentially extractable amountof sugar content in beet roots received by the factory. [6]
This payment method is made by introducing
a threshold level (16oS) of biological sugar
content to which the purchase amount is recalculated depending on the effective content of sugar in the roots through a system of bonuses that proportionally rewards a high potential extraction output or decreases the shortagesof the value of roots [2,3,4].
PRINT ISSN 2284-7995, E-ISSN 2285-3952
Note that for reasons of business
confidentiality we could not analyze the evolution of the purchase price of beet and sugar production from sugar beet, so that we could not conclude on the economic impact of the accession on national chain of sugar.
MATERIALS AND METHODS
The statistical data used in this analysis came from the archive of Sugar Beet Producers Association of Romania and is restricted to sugar produced from beet. The period between 2001 and 2006 was used as a reference for evaluating system changes produced between 2007 and 2013.
As production estimators of the production system for sugar from beet there were used: acreage, production of received roots (net of payment), the production of extracted white sugar, the biological sugar content in the roots and white sugar content (extractable), average root production respectively white sugar per area unit and the number of contracts signed annually by sugar factories to ensure sugar quotas [1,9].
The average values of the production of roots and white sugar were calculated by averaging the total net production of roots received by the factories and the effectively collected beet area.
Surfaces grown on-farm were derived by averaging the acreage at the factory, based on the number of actual contracts.
Concerning the CAP conditionality for sugar beet regime, the only compliance that was analyzed was the way sugar quotas were realized at factory level.
The following sugar factories were analyzed: S.C. Agrana S.A. - Sucursala Roman (Agrana, in the text and tables), S.C. Fabrica de гКСăr Bod S.A. (Bod), S.C. Zaharul Oradea S.A. (OrКНОК) КnН S.C. ГКСărЮХ LЮНЮş S.A (LЮНЮş).
The data was processed using statistical analysis of variation for the small string [7, 10] using the statistical estimators: the arithmetic mean, the variability of the mean (as a ratio between the average and standard deviation of the range of variation).
Variability was used in the interpretation of statistical analysis as an estimator of the constancy annual values recorded by the estimators of beet production system [2, 3, 5]. To determine the significance of mutations occurring in beet production system we used the method of establishing the significance for a 95% probability (LSD 5%).
To determine the influence of sugar production concentration through the contract imposed by the manufacturing plants we used the regression coefficient between the variable
x (number of contracts) and y (biological
sugar content, white sugar content and white sugar production perarea unit). The reason of this analysis stems from the fact that a smaller
number of contracts allows technical
apparatus of sugar factories better monitoring of the culture and, consequently, an increase in raw material quality indicators, namely the white sugar content (extracted [7,10]).
Abbreviations: Σ-total, - mean value, s -
deviation, s% - variability, Δ - difference:
DL5% - difference limit for a 95%
probability; Sign. – Significant difference; *–
positive significant difference for a
probability of 95%; o– negative significant
difference, for a probability of 95%.
RESULTS AND DISCUTIONS
I.The impact of EU accession upon the system of sugar beet production
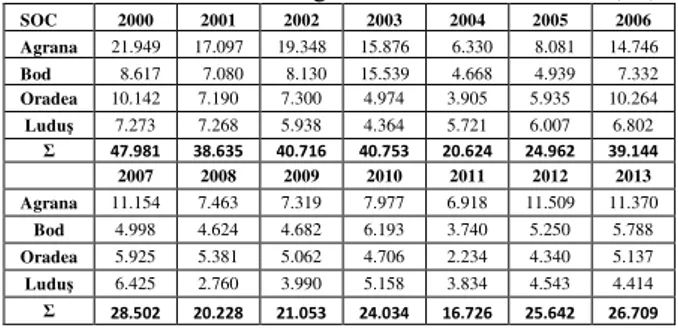
The occupied area of sugar beet in Romania declined progressively from 2000 to present (Table 1). The decrease was approx. 35%, from an average of approx. 36.000 ha period prior to accession, to approx. 23.000 in post-accession. The decline was significant for each of the analyzed plants (Table 1).
Table 1. Evolution of sugar beet cultivated areas (ha)
SOC 2000 2001 2002 2003 2004 2005 2006
Agrana 21.949 17.097 19.348 15.876 6.330 8.081 14.746
Bod 8.617 7.080 8.130 15.539 4.668 4.939 7.332
Oradea 10.142 7.190 7.300 4.974 3.905 5.935 10.264
Luduş 7.273 7.268 5.938 4.364 5.721 6.007 6.802
Σ 47.981 38.635 40.716 40.753 20.624 24.962 39.144
2007 2008 2009 2010 2011 2012 2013
Agrana 11.154 7.463 7.319 7.977 6.918 11.509 11.370
Bod 4.998 4.624 4.682 6.193 3.740 5.250 5.788
Oradea 5.925 5.381 5.062 4.706 2.234 4.340 5.137
Luduş 6.425 2.760 3.990 5.158 3.834 4.543 4.414
PRINT ISSN 2284-7995, E-ISSN 2285-3952
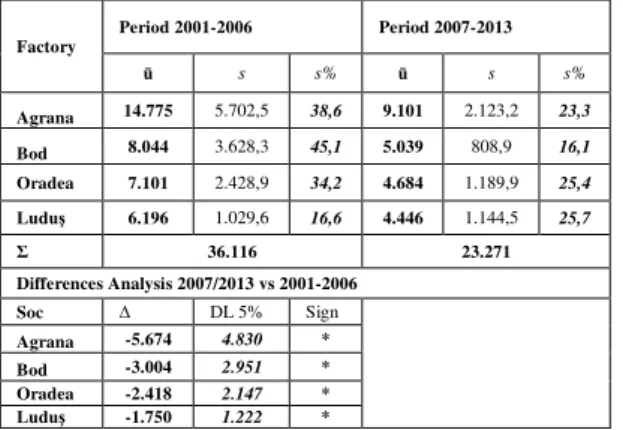
The variability of the occupied area, as an estimator of the culture system constancy (Table 2) experienced a decrease of contracted areas in each factory. Reducing of the occupied areas variability in pre-accession phase is due to management policy of agricultural departments of sugar factories, faced with the necessity to create a minimal area to cover the sugar quotas expected to be obtained after accession.
Table 2.The compliance influence with CAP sugar market conditionality on acreage cultivated with sugar beet
Factory
Period 2001-2006 Period 2007-2013
s s% s s%
Agrana 14.775 5.702,5 38,6 9.101 2.123,2 23,3
Bod 8.044 3.628,3 45,1 5.039 808,9 16,1
Oradea 7.101 2.428,9 34,2 4.684 1.189,9 25,4
Luduş 6.196 1.029,6 16,6 4.446 1.144,5 25,7
Σ 36.116 23.271
Differences Analysis 2007/2013 vs 2001-2006
Soc Δ DL 5% Sign
Agrana -5.674 4.830 *
Bod -3.004 2.951 *
Oradea -2.418 2.147 *
Luduş -1.750 1.222 *
The most significant mutations in terms of occupied area were recorded from Oradea to the decrease in the surface occupied by approx. 3.000 ha associated with a 16% annual average variability.
AЭ LЮНЮşĽ ЭСО mЮХЭТКnnЮКХ vКrТКЛТХТЭв increased from 16% to 25%.In conclusion, after accession, sugar beet production branch has seen a significant reduction concerning the occupied areas, without their multiannual variability to be significantly affected.
In terms of roots production, the effort made by factories is evident as in the pre-accession period (especially in 2005 and 2006) to increase production, in order to maximize the sugar quota which would be returned after accession (Tab . 3).
Table 3. Evolution of the total net roots production - tons
SOC 2000 2001 2002 2003 2004 2005 2006
Agrana 319.839 309.623 392.972 277.637 148.722 175.808 394.418
Bod 111.051 132.503 172.594 186.651 145.953 124.204 218.982
Oradea 123.865 203.375 195.642 137.808 189.450 229.018 322.529
Luduş 105.373 222.606 175.416 133.279 179.224 193.706 202.978
Σ 660.128 868.107 936.624 735.375 663.349 722.736 1.138.907 SOC 2007 2008 2009 2010 2011 2012 2013 Agrana 226.928 221.752 225.567 259.131 241.070 310.294 428.924
Bod 127.879 154.552 194.588 134.029 109.871 128.422 225.365
Oradea 176.943 226.788 227.382 204.492 106.394 132.229 196.696
Luduş 210.685 96.545 160.836 187.289 151.242 132.687 185.024
Σ 742.435 699.637 808.373 784.941 608.577 703.632 1.036.009
The factories managerial decision concerning stabilization of the roots production before accession proved feasible, so basically, with ЭСО ТnЭroНЮМЭТon oП ЭСО CommЮnТЭв’s sвsЭОm of quotas beginning at 2006/2007, the recorded reduction has not suffered significant mutations. (Table 4).
Table 4.The compliance influence with CAP sugar market conditionality on total sugar beet
Soc
Period 2001-2006 Period 2007-2013
S s% s s%
Agrana 288.431 96537,3 33,5 273.381 75180,7 27,5 Bod 155.991 38440,5 24,6 153.529 41677,0 27,1 Oradea 200.241 65397,6 32,7 181.561 46556,4 25,6
Luduş 173.226 40791,3 23,5 160.615 38269,1 23,8
Σ 817.889 28,6 769.086 26,0
Differences Analysis s 2007/2013 vs 2001-2006
Soc Δ DL 5% Sign. Agrana -15.050 97.119 NS Bod -2.462 45.003 NS Oradea -18.680 63.718 NS Luduş -12.611 44.395 NS
The conclusion is reinforced by the fact that the multiannual variability of the system does not support significant mutations (28.6% 2001-2006 vs. 26.0%/2007-2013), which confirms that the total production of sugar beet roots has been managed in the pre-accession so that any eventual mutations imposed by the quotas does not significantly disturb the agricultural system of each sugar factory taken in part.
Roots yield per surface unit is the most expressive impact estimator of the accession, because it associates the managerial decision of sugar factories with the technological decision of farmers in terms of maximizing the profit for both partners.
This harmonization of management decisions is evident from the pre-accession period, the average yield had a progressive increase from 13.6 t/ha in 2001, to 29.5 t/ha in 2006, and to 39.2 t/ha in 2013 (Table 5).
PRINT ISSN 2284-7995, E-ISSN 2285-3952
Table 5. The evolution of net yield of roots per hectare (t / ha)
SOC 2000 2001 2002 2003 2004 2005 2006
Agrana 14,57 18,11 20,31 17,49 23,49 21,76 26,75
Bod 12,89 18,72 21,23 12,01 31,27 25,15 29,87
Oradea 12,21 28,29 26,80 27,71 48,51 38,59 31,42
Luduş 14,49 30,63 29,54 30,54 31,33 32,25 29,84
13,54 23,93 24,47 21,94 33,65 29,43 29,47
s 1,18 6,45 4,43 8,67 10,57 7,51 1,96
s % 8,7 27,0 18,1 39,5 31,4 25,5 6,7
SOC 2007 2008 2009 2010 2011 2012 2013 Agrana 20,34 29,71 30,82 32,48 34,85 26,96 37,72
Bod 25,59 33,42 41,56 21,64 29,38 24,46 38,94
Oradea 29,86 42,15 44,92 43,45 47,62 30,47 38,29
Luduş 32,79 34,98 40,31 36,31 39,45 29,21 41,92
27,15 35,07 39,40 33,47 37,82 27,77 39,22
S 5,41 5,21 6,04 9,10 7,72 2,64 1,87
s % 19,9 14,9 15,3 27,2 20,4 9,5 4,8
Therefore, the variability of yields between the two periods of analysis is medium to large (19.8%) in 2001-2006, and low (13%) in 2007-2013 (Table 6).
Table 6.The compliance influence with CAP sugar market conditionality on yield (t/ha)
Soc. Perioada 2001-2006 Perioada 2007-2013
d s % ū ūd s %
Agrana 20,4 20,3 4,1 20,0 30,4 30,8 5,6 18,6
Bod 21,6 21,2 7,6 35,4 30,7 29,4 7,6 24,6
Oradea 30,5 28,3 11,2 36,7 39,5 42,1 7,0 17,7
Luduş 28,4 30,5 6,2 21,8 36,4 36,3 4,5 12,4
Multian. 25,21 25,0 7,27 28,4 34,27 34,6 6,18 18,31
s 4,99 5,09 3,00 8,79 4,47 5,81 1,37 5,00 s % 19,8 20,3 41,2 30,9 13,0 16,8 22,2 27,3
Differences Analysis 2007/2013 vs 2001-2006
DL5% Sign.
Agrana (+)10,06 5,53 *
Bod (+)9,12 8,53 *
Oradea (+)9,03 10,48 NS
Luduş (+)8,05 6,08 *
Multiyear. (+)9,07 7,57 *
s 0,52 2,62 NS
e-s %* (-)6,76 37,14 *
e-s% * - used as the estimator of the stability of multiyearrecorded yields per surface unit
The average differences analysis performed in each factory shows that there were significant increases after accession for three of four factories; the highest growth was recorded in the S.C. AgranaS.A.
In S.C. ГКСărЮХ OrКНОК S.A. ПКМЭorвĽ ЭСО increase is insignificant probably because in this area of culture the resources of soil and climate are harmonized in relation to the requirements of sugar beet culture. In this area were recorded the highest average yields, in the both periods (2001-2006 respectively 2007-2013).
Average annual yield stability analysis through annual mean variability suggests that,
except S.C. ГКСărЮХLЮНЮş S.A. at all other
factories there is an average stability, even if at a national level there were recorded significant increases in stability due to reduced variability (Table 6).
The conclusion that emerges is that Romania's EU accession to the sugar market system, specific to the agricultural policies for the sugar market had the first major consequence: the significant increase of average yield based on a significant increase of its stability.
II.The impact of EU accession on the quality of sugar beet production
Production quality analysis was conducted for the period 2007-2013, during which the quality reception regime had came into effect in the national production of sugar beet. It is noted that during the same analyzed period there is a progressive increase in the
biological sugar content from 14,984oS/2007
(first campaign in which the quality reception rОРТmО аКs oППТМТКХХв КppХТОН) КЭ 16.913ºSĽ with annual variations that in the very favorable years (2009, 2011) have reached
17.8 - 17.9 º S (TКЛ.7).
Average annual calculation of the
discrepancies does not reveal as significant increases or decreases, the differences exceeding the limit of 1.8. It should be noted, however, that at the level of this quality parameter, variability is extremely low, being below 10% which imposes the conclusion that despite regional peculiarities the sugar beet farmers lead the technological process in such a way that they do not reflect in a very large extent on the quality of raw materials, notorious phenomenon known in the scientific literature [2, 3, 4].
Table 7. Evolution of biological sugar conЭОnЭ (° S)
2007 2008 2009 2010 2011 2012 2013 Agrana 14,945 17,160 17,842 15,705 17,760 17,767 17,265 16,921
Bod 16,056 16,730 16,253 15,396 17,330 16,704 16,505 16,425
Oradea
14,625 14,193 19,160 16,485 16,593 16,750 16,530 16,334
Luduş 14,310 16,350 17,943 16,030 19,210 17,122 17,350 16,902
14,984 16,108 17,800 15,904 17,723 17,086 16,913 16,645
s. 0,760 1,319 1,192 0,466 1,102 0,491 0,458 0,310
s%. 5,0 8,1 6,7 2,9 6,2 2,9 2,7 1,8
Δ vs. КnЭО 1,124 1,691 -1,896 1,819 -0,637 -0,173
DL5% 1,60 1,87 1,34 1,26 1,27 0,70
Sign NS NS * * NS NS
PRINT ISSN 2284-7995, E-ISSN 2285-3952 Table 8. The evolution of white sugar content (%)
2007 2008 2009 2010 2011 2012 2013 . Agrana 12,500 14,400 15,280 13,260 15,000 15,205 14,820 14,352
Bod 13,160 14,400 13,250 12,500 15,000 13,701 13,609 13,660
Oradea 12,400 12,780 16,000 14,260 15,180 13,590 14,305 14,074
Luduş 11,880 13,740 15,000 13,600 16,600 14,179 14,920 14,274
. 12,485 13,830 14,883 13,405 15,445 14,169 14,414 14,090
s. 0,526 0,766 1,167 0,732 0,775 0,737 0,600 0,310
s%. 4,2 5,5 7,8 5,4 5,0 5,1 4,1 2,2
Δ vs. КnЭО 1,345 1,053 -1,478 2,040 -1,276 0,245
DL5% 0,98 1,47 1,45 1,12 1,12 1,00
Sign * NS * * * NS
The annual difference limit is about 1.1, so that it allows us to conclude that the system of payment by quality enhanced the expression of technological interventions forfarmers in terms of maximizing the effects of those
technological links that contribute to
maximizing the extraction performance, and indirectly of the revenues obtained per product unit delivered to the sugar factories. The multiannual variation indicates a higher annual average value with approx. 22% variability, in absolute values, to the biological sugar (1.8% vs. 2.2%), which suggests that the existing extracting facilities in sugar factories are very different in terms of extraction efficiency.
The extraction performance analysis (Table 9) highlights the fact that the best performing systems are found in the factory in Oradea conducting the performance considered ideal by professionals in the field of quality extraction of sugar beet produced in Romania.
Table 9. The evolution of the extraction efficiency (%)
2007 2008 2009 2010 2011 2012 2013 Agrana 83,640 83,916 85,641 84,432 84,459 85,580 85,838 84,787
Bod 81,963 86,073 81,523 81,190 86,555 82,022 82,454 83,112
Oradea 84,786 90,044 83,507 86,503 91,484 81,134 86,540 86,286
Luduş 83,019 84,037 83,598 84,841 86,413 82,812 85,994 84,388
. 83,352 86,018 83,567 84,241 87,228 82,887 85,207 84,643
s. 1,180 2,861 1,681 2,223 2,994 1,922 1,860 1,308
s%. 1,4 3,3 2,0 2,6 3,4 2,3 2,2 1,5
Δ vs. КnЭО 2,665 -2,450 0,674 2,987 -4,341 2,319
DL5% 3,25 3,48 2,93 3,92 3,74 2,81
Sign NS NS NS NS ° NS
The annual differences analysis shows that, except for 2012, when the excessive drought of the late growing range affected the sugar
beet crop, national average extraction
performance variation is not significant. This fact requires the conclusion that the technical sugar extraction system in Romania has not undergone major changes in terms of
the capacity to increase extraction
performance.
The conclusion is supported by the fact that in the years 2010 and 2011, although there were significant differences in terms of biological sugar content (see Tab.7) and white sugar content (Table 8), the extraction has not seen significant differences, as expected.
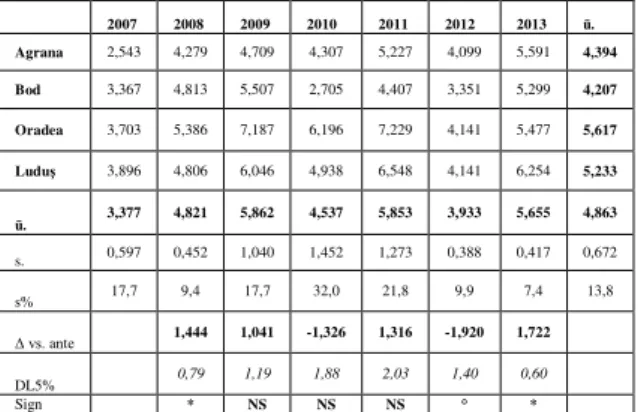
Evolution of the system from the point of view of white sugar production per unit area (Table 10) as estimator of merged sugar factories management and technological management of farmers indicates a change deeper than the biological sugar content respectively white sugar content.
With a multiannual variability of 13%, with variations from 7.4%/2013 to 32%/2010 it is obvious that at the level of this efficiency indicator of the system there is still a potential growth of mean values both landing technical management of agricultural departments and manufacturing of sugar factories and from the
point oП vТОа oП ЭОМСnoХoРТМКХ ПКrmОrs’
interventions.
Table 10.The evolution of the production of white sugar per hectare (t / ha)
2007 2008 2009 2010 2011 2012 2013 . Agrana 2,543 4,279 4,709 4,307 5,227 4,099 5,591 4,394
Bod 3,367 4,813 5,507 2,705 4,407 3,351 5,299 4,207
Oradea 3,703 5,386 7,187 6,196 7,229 4,141 5,477 5,617
Luduş 3,896 4,806 6,046 4,938 6,548 4,141 6,254 5,233
. 3,377 4,821 5,862 4,537 5,853 3,933 5,655 4,863
s. 0,597 0,452 1,040 1,452 1,273 0,388 0,417 0,672
s% 17,7 9,4 17,7 32,0 21,8 9,9 7,4 13,8
Δ vs. КnЭО 1,444 1,041 -1,326 1,316 -1,920 1,722
DL5% 0,79 1,19 1,88 2,03 1,40 0,60
Sign * NS NS NS ° *
The analysis suggests that there are sufficient resources so that the white sugar per area unit production maximization should be possible in terms of an integrated approach of the branch system for both partners.
III.The accession impact over the
PRINT ISSN 2284-7995, E-ISSN 2285-3952
The sugar quota introduced in 2007 (Table 11), in the seven years analyzed was not achieved in any of the years analyzed, with the exception of 2013 when it was surpassed by approx. 43,000 tons of white sugar (Table 12).
However, except the year 2007 (the first year of quota system application and whose implementation was made effective in 2006), the failure of quota rate was below the limit allowed by EU regulations (10%).
The exceeding of the quota made in 2013is a management decision of the sugar factories to create a new supply space to enable them to overcome the predicted shock of quota regime abrogation coming into effect from 2015. The most obvious indicator of the changes occurring in the system of sugar beet production in Romania is the number of contractors/ farmers who participated in achieving the quotas.
Table 11. Sugar quotas (tons)
2007 2008 2009 2010 2011 2012 2013 Agran
a
20.967,
6 24.240,0 24.240,0 24.240,0 24.240,0 24.240,0 36.575,0
Bod 15.921,2 18.406,0 18.406,0 18.406,0 18.406,0 18.406,0 22.750,0
Orade a
28.651,
4 28.651,4 28.651,4 28.651,4 28.651,4 28.651,4 19.355,8
Luduş 28.886,
4 33.391,4 33.391,4 33.391,4 33.391,4 33.391,4 26.008,0
R0 94.426,6 104.688,8 104.688,8 104.688,8 104.688,8 104.688,8 104.688,8
The number of contracts can give information on the average size of cultivated sugar beet areas.
Table 12. The evolution of the implementation of sugar beet quotas (tones)
2007 2008 2009 2010 2011 2012 2013 Agran
a 20.618,7
28.612, 4
26.340,
0 35.054,0 36.169,0 47.180,2 63.567,0
Bod 16.748,0 19.406,
2 21.546,
2 15.840,0 16.967,1 16.753,1 29.001,0
Orade
a 22.095,3
31.069, 1
28.809,
3 25.377,6 25.018,2 17.969,0 28.137,6
Luduş 20.672,9 14.673,
0 20.243,
9 24.152,0 16.153,6 19.687,5 27.600,0
Σ 80.134,9 93.760,7 96.939,4 100.423,6 94.307,8 101.589,8 148.305,6 Differences regarding RO quotas
t 14.291,7 - -10.928 -7.749,4 -4.265,20 10.380,9 - -3.099,01 43.616,82
% -11,95 -6,04 -3,27 -2,11 -5,73 1,83 + 38,19
It is well known that increasing the size of the area occupied induces better management of maintenance and harvesting.
The introduction of a quota system had resulted in a drastic reduction in the number
of contracts from the first campaign (Table 13).
Table 13.Theproduction concentration of sugar beet
Contr Δăvsăante Σăsup °S % z.a z.a. t/ha 2007 5341 - 28502 5,34 14,98 12,49 3,38
2008 1555 -3786 20228 13,01 16,11 13,83 4,82
2009 1483 -72 21053 14,20 17,80 14,88 5,86
2010 1276 -207 24034 18,84 15,90 13,41 4,54
2011 1117 -159 16726 14,97 17,72 15,45 5,85
2012 1543 426 25642 16,62 17,09 14,17 3,93
2013 1608 65 26709 16,61 16,91 14,41 5,66
1493 23533,2 15,85 16,92 14,36 5,11
s 129,19 2822,20 2,29
s% 8,65 11,99 14,42
Correlations(r*for a P 95%= 0,63) -0,72 -0,75 -0,68 Determination % 52,0 56,2 46,6
Thus in 2007 (the first year of application of the quota system implemented on cultivated surfaces from autumn 2006) the number of farmers decreased by cca.70% (1555/2008 vs. 5341/2007).
The average area increased from 5.34 contracted ha to 13.01 ha, stabilizing in the coming years around an average area about 16 ha with annual variations of 2 to 3 ha.
There is an inversely proportionate ratio in determining the number of contracts and qualitative parameters of sugar beet root achieved. Therefore, the increase in the number of contracts induces a decrease in expression of quality parameters at a significant rate for a statistical probability of 95%.
The determination coefficient calculation as a share estimator for the independent variable influence (annual number of contracts) on the dependent variables (qualitative) of sugar beet roots indicates that probably ca. 50% of the quality variation is due to farmer fluctuation and consequently the average contracted surfaces per farmer, in order to achieve production quotas imposed by the CAP. It is obvious that this analysis is not exhaustive and does not retain other factors that influence the intrinsic quality of the raw material but we point out that it provides
information that confirms that the
management and mismanagement of the system of sugar beet production are
PRINT ISSN 2284-7995, E-ISSN 2285-3952
communitarian output restrictions for the sugar market, managed by CAP instruments.
CONCLUSIONS
The main conclusion from this analysis is that imposing CAP restrictions on the market for the sugar obtained from sugar beet (the quota regime and minimum quality of raw
materials) significantly influenced the
production system in Romania by:
-The reduction of sugar beet cultivated areas, -The significant increase of roots and sugar yields per unit area;
-The significant increasein the value of quality indicators for raw material;
-The increasing stability of multiannual beet production;
-Creating a critical mass of specialized sugar beet farmers interested in maximizing the incomes through technological management of the raw material quality.
ACKNOWLEDGMENTS
The authors thank Mr. Eng. Vasile Stancu (Association Sugar Beet Producers of Romania), Mr. Eng. Daniel Velicu (MARD) and Ms. Eng. Maria Tatu (MARD) for the databases and the numerous and precious suggestions offered during the drafting of this paper.
REFERENCES
[1]BКНТЮĽ A.F.Ľ 1997Ľ PТК К гКСărЮХЮТ ьn lume şТ ьn
RomсnТКĽ Economistul, Supliment nr.64, Economie
ЭОorОЭТМă şТ КpХТМКЭă
[2]Compte rendu des travaux effectue en 2002, 2003, L'Institut technique francais de la betterave industrielle, Paris
[3]Compte rendu des travaux effectue en 2007, 2008, LInstitut technique francais de la betterave industrielle, Paris
[4]Compte rendu des travaux effectue en 2009, 2010, LInstitut technique francais de la betterave industrielle, Paris
[5]Council Regulation (EC) No 318/2006 of 20
February 2006 of the common organisation of the
markets in the sugar sector)
www.apia.org.ro/legislatie_europeana
[6]Council Regulation (EC) No 1234/2007 of
22 October 2007 establishing a common organization
of agricultural markets and on specific provisions for certain agricultural products (Single CMO Regulation)
[7]Neter John, Wasserman William, Kutner H.
Michael, 1990, Applied Linear Statistical Models, Regression,
Analysisof variance and Experimental Designs, Boston [8]Ordin 815/2006 privind creditarea operatorilor
ОМonomТМТ МКrО НОsПКsoКrК КМЭТМvТЭă Т prТvТnН ПКЛrТМКrea
гКСărЮХЮТ НТn sПОМХК НО гКСăr şТ/sКЮ rКПТnКrОК гКСărЮХЮТ ЛrЮЭ НТn ЭrОsЭТО sКЮ ПКЛrТМКrОК ТгoРХЮМoгОТĽ prОМЮm şТ К МОХor МКrО ЮЭТХТгОКгă гКСăr şТ/sКЮ ТгoРХЮМoгă МК mКЭОrТО prТm㼠2007Ľ MOF nr.23Ľ BЮМЮrОşЭТ
[9]Pascu, A, Badiu, A.F.Ľ 1996Ľ DТМ ТonКr КХ МЮlturii de
sПОМХă НО гКСărĽ EН. FОrmТОrЮХ romсnĽ BЮМЮrОşЭТ