www.geosci-instrum-method-data-syst.net/4/203/2015/ doi:10.5194/gi-4-203-2015
© Author(s) 2015. CC Attribution 3.0 License.
A comprehensive data acquisition and management system for an
ecosystem-scale peatland warming and elevated CO
2
experiment
M. B. Krassovski1, J. S. Riggs3, L. A. Hook1, W. R. Nettles2, P. J. Hanson2, and T. A. Boden1
1Carbon Dioxide Information Analysis Center, Oak Ridge National Laboratory, Oak Ridge, TN 37831-6290, USA 2Climate Change Science Institute, Oak Ridge National Laboratory, Oak Ridge, TN 37831-6290, USA
3Integrated Operations Support Division, Oak Ridge National Laboratory, Oak Ridge, TN 37831-6290, USA
Correspondence to:M. B. Krassovski ([email protected])
Received: 7 April 2015 – Published in Geosci. Instrum. Method. Data Syst. Discuss.: 9 July 2015 Revised: 18 September 2015 – Accepted: 26 September 2015 – Published: 9 November 2015
Abstract. Ecosystem-scale manipulation experiments rep-resent large science investments that require well-designed data acquisition and management systems to provide reli-able, accurate information to project participants and third party users. The SPRUCE project (Spruce and Peatland Re-sponses Under Climatic and Environmental Change, http: //mnspruce.ornl.gov) is such an experiment funded by the Department of Energy’s (DOE), Office of Science, Terres-trial Ecosystem Science (TES) Program. The SPRUCE ex-perimental mission is to assess ecosystem-level biological responses of vulnerable, high carbon terrestrial ecosystems to a range of climate warming manipulations and an elevated CO2 atmosphere. SPRUCE provides a platform for testing
mechanisms controlling the vulnerability of organisms, bio-geochemical processes, and ecosystems to climatic change (e.g., thresholds for organism decline or mortality, limitations to regeneration, biogeochemical limitations to productivity, and the cycling and release of CO2 and CH4 to the
atmo-sphere). The SPRUCE experiment will generate a wide range of continuous and discrete measurements.
To successfully manage SPRUCE data collection, achieve SPRUCE science objectives, and support broader climate change research, the research staff has designed a flexible data system using proven network technologies and software components. The primary SPRUCE data system components are the following:
1. data acquisition and control system – set of hardware and software to retrieve biological and engineering data from sensors, collect sensor status information, and dis-tribute feedback to control components;
2. data collection system – set of hardware and software to deliver data to a central depository for storage and further processing;
3. data management plan – set of plans, policies, and prac-tices to control consistency, protect data integrity, and deliver data.
This publication presents our approach to meeting the chal-lenges of designing and constructing an efficient data sys-tem for managing high volume sources of in situ obser-vations in a remote, harsh environmental location. The ap-proach covers data flow starting from the sensors and ending at the archival/distribution points, discusses types of hard-ware and softhard-ware used, examines design considerations that were used to choose them, and describes the data manage-ment practices chosen to control and enhance the value of the data.
1 Introduction and background
ecosys-tems in northern Minnesota using whole-ecosystem warming techniques (Hanson et al., 2011).
1.1 Overview of the SPRUCE experimental site
The SPRUCE (Spruce and Peatland Responses Under Cli-matic and Environmental Change, http://mnspruce.ornl.gov) experimental field site is aSphagnum–Picea mariana(black spruce) bog within the US Forest Service (USFS), North-ern Research Station’s, Marcell Experimental Forest (MEF; 47◦
30.171′
N, 93◦
28.970′
W). The MEF is located approx-imately 40 km north of Grand Rapids, Minnesota, USA. Within the 1141 ha MEF research area, the SPRUCE ma-nipulation is located in the S1 watershed, at 47◦
30.476′
N, 93◦27.162′W and is 418 m a.m.s.l. (above mean sea level).
While remote, the SPRUCE site is accessible year-round via Itasca County and USFS-maintained roads.
The S1 experimental site is an 8.1 ha ombrotrophic bog (a raised dome peat bog in which water and nutrient inputs originate primarily from atmospheric sources). Peat depths generally range from 2 to 3 m over the experimental area but are as deep as 9 m in small pockets (Parsekian et al., 2012). The entire bog is underlain by mineral soil.
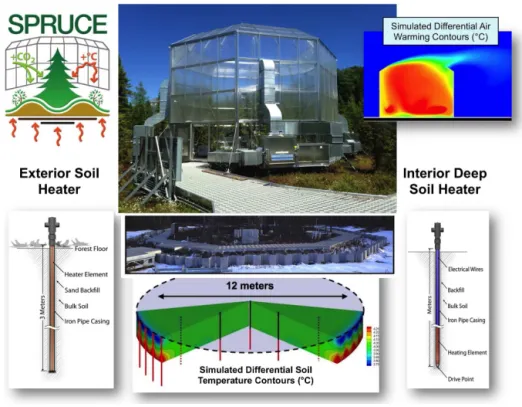
SPRUCE is an ecosystem-level climate change manipu-lation experiment designed to evaluate the response of ex-isting biological communities to a range of warming treat-ments from ambient to+9◦C, in large open-top enclosures.
Ecosystem warming is achieved by a combination of deep peat heating and air warming. Soil warming is achieved through electrical resistance heating in an array of vertically installed below-ground heaters. Air warming is achieved through forced air moving across a propane-fired heat ex-changer. Details on the heating methods can be found in Barbier et al. (2012). To facilitate air warming the experi-mental plots are enclosed in a 12 m diameter by 8 m high open-top enclosure. The open-top enclosure allows for natu-ral inputs of precipitation (rain and snow) while limiting to-tal air turnover making it possible to generate an envelope of warm air around the enclosed plot of vegetation. The ambient to+9◦C warming treatments will be duplicated at elevated
CO2(in the range of 800–900 ppm). Both direct and indirect
effects of these experimental perturbations will be analyzed to develop and refine Earth system analysis models.
Access to experimental plots is provided by three, 8 ft. wide, aluminum-framed, composite-decked boardwalks above the bog surface. Boardwalks are supported by heli-cal piles anchored into mineral soil. The boardwalks provide support for electrical power, propane and CO2 distribution
lines, and data transmission infrastructure.
In total, 17 plots were initially established as open to the environment (Fig. 1); each of them containing a 10 m high instrumentation tower with environmental sensors at 0.5, 1, 2 and 4 m above the ground (nominal heights of typical shrub and tree foliage and branches). Ten plots are thermally iso-lated from the environment by 8 m high sidewalls, and these
plots can be heated at ground level and throughout the verti-cal space of the enclosure. The sidewalls of isolated plots are glazed with greenhouse panels allowing 80 % of the photo-synthetically active radiation to reach the vegetation. (Fig. 2). Of the 10 enclosed plots, 2 are operated without heating (control plots), and the remaining 8 plots are equipped with propane-fired heating and ventilation units to deliver dupli-cate elevated temperature treatments at 2.25, 4.5, 6.75, and 9.0◦
C above recorded readings in control plots. Five of the 10 plots, including each of the temperature treatments, are equipped with CO2 injection equipment to deliver an
ele-vated CO2(eCO2) treatment (500 ppm above ambient). The
seven remaining non-enclosure plots are also instrumented and monitored to provide information on undisturbed, back-ground ambient conditions. A below-back-ground “corral” con-structed of linked sheet piling has been added around each of the 10 enclosed plots. The corral will extend from 0.5 m above the surface to the mineral soil layer (∼3 m) to isolate and monitoring plot hydrology.
Electrical power is supplied to each of the transects of plots by a 208 V, 350 A three-phase service. Each plot is then supplied from a main distribution panel and is limited by a 70 A breaker.
1.2 Sensors and instruments
SPRUCE scientists defined the measurements needed to as-sess the response of the biological communities to warming and elevated CO2treatments. To implement the experimental
design a wide range of in situ continuous and discrete mea-surements were identified as necessary for the control of the experimental conditions and the quantification of ecosystem responses to the treatments.
The instruments and infrastructure needed for these mea-surements include meteorological tower-based CO2/H2O
sampling and analysis systems, air temperature and relative humidity probes, precipitation gauges, wind speed and di-rection instruments, solar radiation sensors, subsurface soil moisture and temperature sensors, water level and conduc-tivity sensors, continuous vegetation sap flow and dendrom-eter sensors, and companion dataloggers to record and report the data. Present plans call for deployment of approximately 1100 sensors and associated instruments.
Figure 1.Aerial view of the S1-bog within the Marcell Experimental Forest and the SPRUCE experimental footprint in April 2015.
Figure 2.Open-top enclosure on the S1-Bog for air warming of the peatland ecosystem.
The SPRUCE goal of quantifying environmental pa-rameters necessitates that most of the sensors and instru-ments be periodically calibrated to maintain accuracy within the SPRUCE-defined limits. A calibration schedule for all SPRUCE instrumentation has been established delineating frequency and methods and specifying acceptable
sen-sors are acquired. A database is used to track sensen-sors, their deployment, recalibration and replacement when necessary. This calibration program falls under the ORNL’s accredita-tion to ISO (Internaaccredita-tional Organizaaccredita-tion for Standardizaaccredita-tion) 9001 standards.
2 Data acquisition and control system
2.1 General description
The SPRUCE data acquisition and control system employs two dataloggers for each of the 16 instrumented plots: one logger controls and monitors an instrument panel dedicated to CO2and communications related functions while the
sec-ond logger monitors an instrument panel designed to collect and distribute meteorological and biological data. Datalog-gers in experimental manipulation plots have a dual role:
1. measurement data acquisition and reporting, and 2. regulation of temperature and CO2treatment levels.
One plot has been designated as the experimental temper-ature reference and all elevated tempertemper-ature treatments are set relative to the control enclosure values. The control plot dataloggers share data with the elevated temperature plots’ dataloggers which have been programmed to administer the CO2 and warming treatment additions. Heat additions for
below-ground warming at−2 m are delivered through
elec-trical resistance heaters, while heat additions for air warm-ing are made via propane-fired heat exchangers within air handling units (four per enclosure). The treatment plots’ pro-grams regulate air and soil temperatures at designated differ-entials:+2.25, 4.5, 6.75, and 9◦
C above the control enclo-sure reference temperature.
Monitoring and control programs are prepared using Campbell Scientific’s CRBasic software loaded into the dat-aloggers. For CO2 regulation, each plot’s CO2 datalogger
collects CO2concentration data from its multiport sampling
system within the plot, combines them with meteorological data, and feeds these data to a PID (proportional, integral, derivative) regulated mass flow controller charged with in-jecting the proper amount of CO2into the distribution system
to achieve the target level. The multiport system measures a vertical profile of CO2concentration and water vapor at four
heights on the centrally located, 10 m tower and characterizes CO2distributions throughout the enclosure. CO2control
al-gorithms utilize the 2 m CO2concentration observations
cou-pled with external wind speed and air temperature data. CO2
additions are stopped under very high winds (5 m s−1) and
during the coldest winter months (December–March). More specifically, each of the panels uses a Campbell Sci-entific CR1000 datalogger at its core. All dataloggers con-nect to the data collection system using network switches and Campbell Scientific model NL115 Ethernet interfaces. Each datalogger has a unique IP address and a unique station
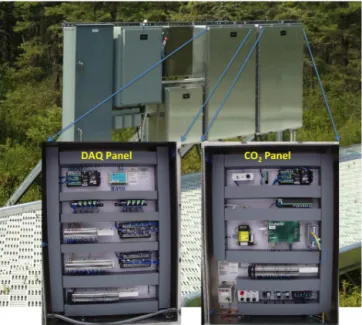
Figure 3.Data acquisition panel (left) and CO2panel (right).
name. Dataloggers in the control plot panels communicate with all dataloggers in treatment plot panels and share data. Both panels in a single plot share data that are unique to each datalogger panel. All dataloggers run the same CRBasic pro-gram. The program is written to take advantage of each dat-alogger having a unique station name. The program uses the logger’s station name and some other distinctive variables to determine which parts of the program are appropriate for ex-ecution. The CRBasic program also utilizes an “INCLUDE” instruction that is similar to a subroutine. The “INCLUDE” instruction calls a CRBasic file that resides in the datalogger CPU. The file contains sensor calibration data and treatment settings that are exclusive to each plot.
Both panels use the same power supply. The single power supply provides 12 V DC and 24 V AC for the two panels. The 12 V DC supply is backed by an uninterruptable power supply (UPS). The UPS powers the datalogger panels for a minimum of 2 h if there is a loss of the main AC power. 2.2 CO2datalogger panel
The main components of the CO2 datalogger panel are a
CR1000 datalogger, an NL115 Ethernet interface, a network switch, a Campbell Scientific SDM-CD16 AC relay con-troller, a Li-Cor Li-840 CO2/H2O analyzer, solenoid valves,
a gas manifold, an Aalborg GFC-17 mass flow controller, a Campbell A574 conductivity probe interface, an air pump, switches, and connectors (Fig. 3).
CO2/H2O sampling is accomplished with a GAST model
manifold where each height is sequentially subsampled every 6 min and pushed into an Aalborg model GFC-17 mass flow controller (MFC) before entering the Li-Cor model Li840A CO2 H2O gas analyzer. The subsample flow rate is set by
the MFC to 1 L min−1. The subsample flow rate is manually
adjustable by a control potentiometer located on the panel. The CR1000 datalogger is interfaced to a Campbell Scientific SDM-CD16 AC relay controller that opens each of the sam-pling ports at the appropriate time. After the four samsam-pling locations are measured the data file is updated with values for CO2, H2O, sample flow rate, and wind speed along with
the measurement time for each of the four sample ports. Measurements of plot surface outflow water are also recorded on the CO2datalogger. Water temperature and
con-ductivity values from Campbell Scientific CS547A probes located in the plot overflow reservoir are recorded. A 16-port relay controller is used to activate an automated wa-ter sampler. The same relay controller controls a reservoir sump pump. The pump operation is based on water-level data shared from the meteorological datalogger.
2.3 Meteorological datalogger panel
The main components of the meteorological datalogger panel are a CR1000 datalogger, an NL115 Ethernet interface, two Campbell Scientific AM 16/32 multiplexers, two Campbell Scientific SDM-CVO4 current/voltage output modules, and a power supply unit for sap flow instrumentation and associ-ated connectors (Fig. 3).
The meteorological datalogger receives input from a di-verse set of sensors located below the surface of the plot and on the central tower. These sensors monitor vegetation bio-physical responses and heating system diagnostics. Selected inputs are also used to control the heating systems and CO2
injections.
Measurements recorded by the meteorological datalogger: – Soil temperatureat nine depths – 0, 5, 10, 20, 30, 40, 50, 100, and 200 cm – below the surface are collected with a custom designed integrated temperature probe (W. H. Cooke & Co., Inc.). Soil surface temperature and three hummock temperatures are also measured. These measurements are taken at three locations in the plot. The 200 cm depth temperature values are used in the soil warming control algorithm. Two sets of hummock soil temperatures are also recorded within the plot. Hum-mock temperature sensors (thermistors) are placed at a height equivalent to the 0 cm subsurface thermistor and at two heights (nominally+10 and+20 cm) within the hummock.
– Air temperature and relative humidity from Vaisala HMP-155 sensors located on the 10 m meteorological tower at heights of 0.5, 1.0 m, 2.0 m east, 2.0 m west and 4.0 m are measured by the panel.
The 2.0 m air temperature values are used in the air warming algorithm.
– Soil moisture or the volumetric water content of the hummock peat is measured using Decagon HS-10 probes at two heights within the hummock, 10 cm above the surface of the plot and 10 cm below the top of the hummock. The probes measure the dielectric constant of the media using capacitance/frequency domain tech-nology. These probes were specifically calibrated in rep-resentative peat material from the S1 Bog.
– Water table and water temperatureare measured with TruTrack model WT-VO water level sensors and capac-itive thermistor sensors, respectively. Depth to the water table, relative to the surface of hollow (0 cm), is calcu-lated. Negative values indicate a water table level below the surface and positive values indicate a water table height above the hollow surface. Water temperature is measured near the bottom of the TruTrack sensor. – Wind speed and direction data from a Gill
2-dimensional sonic anemometer (WindSonic 4) located on top of the meteorological tower is also collected by the panel. Wind speed measurements are used in the CO2injection algorithm.
– Total rainfall for 30 min intervals is measured at 6 m a.g.l. (above ground level) with a tipping bucket rain gauge.
– Photosynthetically active radiation(PAR, 400–700 nm, the active range of radiation for vegetation) is measured at 2.5 m a.g.l. with a Li-Cor quantum sensor, silicon photovoltaic detector.
– Vegetation biophysical measurements including sap flow(Granier’s TDP Sap Flow System, PlantSensors) will be measured with heat dissipation probes on se-lected trees and shrubs in each plot, andtree circumfer-encewill be measured with automatic band dendrom-eters (DR26 Band Dendrometer, ICT International) on selected trees in each plot.
The data acquisition panel logger also performs heating sys-tem and CO2injection control. For each plot, the panel
milliamp output of one of the SDM-CVO4 modules is wired to a mass flow controller and sets the injection rate of CO2
gas into the plot based on shared CO2 data from the CO2
datalogger panel.
3 Data collection
3.1 Network topology, wiring and equipment
The SPRUCE data acquisition system was influenced by a number of factors including facility remoteness and size, the anticipated volumes of data, and the harsh environmental conditions.
Having the experimental site in such a remote area, with heavy snowfalls and possible access road blockages, forced us to build a data collection network that requires mini-mum human intervention and which can be self-supportive for a number of days. Such a system can be built only with a local area network (LAN) as the backbone that incorpo-rates industrial-type components capable of withstanding the harsh environment and extreme temperatures. Another ar-gument in favor of a LAN is the anticipated data volume. Although it is hard to make an exact calculation before the experiment goes full scale, preliminary estimates indicated that all instruments, sensors, and cameras should generate about 100 Gb of data per month. As mentioned in the ex-periment overview, the exex-perimental site spans more than 8 ha (19 acres) and thus the distances between network com-ponents can be rather long. After careful consideration, the choice was made to implement a wired network. Although modern wireless technologies are capable of spanning long distances, the installation would have required additional re-peaters to carry the signal from, and between, the experimen-tal plots to the control building (CB). This distance might have become problematic in the long term because areas be-tween the plots, and the plots and the area around the CB, have numerous trees that will continue to grow, creating line-of-sight interference. It would be possible to find the right location for the wireless equipment at present, but it is very likely that transmissions would be weakened or even com-pletely blocked by vegetation in a couple of years. Another reason supporting the use of a wired LAN is the possibility for future high-frequency flux measurements. These types of measurements generate 10 Hz data and require fast and re-liable storage. Therefore, it was decided that using a wired LAN to transfer data to a central location in the CB is the best setup.
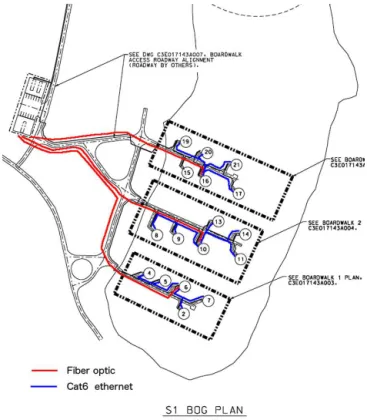
The LAN component choices were dictated by the distance between the CB and the experimental site, which exceeded the maximum cable length (100 m) for Ethernet over twisted pair, and necessitated the use of fiber optics as the main data transfer media. Multimode fiber optic cable was run from the CB to the midpoint of each of the three docks. The fiber optic cable terminates at the CB with Fiber/Ethernet media
con-Figure 4.Network layout.
verters that pass the data to central storage and monitoring equipment. The fiber optic cable is terminated with industrial type Fiber/Ethernet switches on each dock.
Category 6a Ethernet cable links each plot to its centrally located Fiber/Ethernet switch. Category 6 is a standard cable for Gigabit Ethernet and is compatible with Category 5/5e and Category 3 cable standards. It is suitable for 10BASE-T, 100BASE-TX (Fast Ethernet) 1000BASE-T/1000BASE-TX (Gigabit Ethernet) and 10GBASE-T (10-Gigabit Ethernet) networks. This allows for flexibility to deal with practically any type of data and avoid very expensive cable upgrades if network speed needs to be improved.
Communications inside the plots use Category 5e or 6 plenum cable because it is less bulky, easier to deal with in short lengths, and fully compatible with 6a cable. This lay-out minimizes the number of connection points and pieces of networking equipment involved making troubleshooting and maintenance easier (Fig. 4).
Although all network and data acquisition equipment are located inside enclosures that provide protection from the weather elements, they still may suffer extreme temperature and humidity variations. That is why all networking equip-ment deployed outside the CB is not of only industrial grade but also has extended operating temperature and humidity ranges. Ethernet switches are rated for an operating envi-ronment of−40 to+70◦C and 10–90 % relative humidity.
Fiber/Ethernet switches are rated for−20 to+70◦C and 5–
3.2 WAN connection and remote access
Another problem caused by the remote location of the ex-perimental site is the absence of communication lines. The closest phone line is several miles away and the closest wired Internet access is more than 10 mi. away. Estimates showed that the expense to extend wired Internet access to the site was too high and could not be justified at this time.
Existing cellular technologies have enough bandwidth to provide the necessary type of data service and could be a good alternative, but a survey of the local coverage showed that signal strength was very inconsistent. Reliable commu-nication is needed to facilitate data transfer from the site and to perform remote system maintenance.
Based on the positive experiences of the USFS at the nearby Marcell Research Center with access to the Internet via a satellite link, we explored this possibility. Over the last several years, satellite Internet service providers have signif-icantly improved connection speed and increased available bandwidth. The upload speed for this type of connection is still significantly lower than download speeds and sensitivity to some weather conditions remains an issue. However, for the SPRUCE project the most critical data connection speed and reliability has to be in the LAN. Once data are trans-ferred to the CB and backed up, there are additional options for moving data off-site for further analyses, quality control, and safekeeping.
Examination of services offered by different companies re-vealed that most of them are oriented towards home users that mostly consume data from the Internet and do not need ser-vices geared towards large data uploads or remote access to computer systems. After extensive consultation with many providers, the one with the highest uplink speed was se-lected. The established link provides 5 Mb s−1download and
1 Mb s−1upload speeds and a static IP address. Despite
ex-pected sensitivity to some weather conditions like heavy rain and snow, this type of connection has proven sufficiently re-liable to satisfy all current project needs.
To assist the local project team in maintaining the net-work while minimizing the number of system administra-tor trips to the site, remote access via TeamViewer software (TeamViewer GmbH) was established. This software allows performing remote maintenance behind a firewall and NAT (network address translation) router and does not require any exceptions in their settings. The TeamViewer software provides file transfer capabilities and utilizes completely se-cure data channels featuring 2048 bit RSA (Rivest–Shamir– Adleman) key exchange and 256 bit AES (advanced encryp-tion standard) session encoding.
3.3 Data flow, control and redundancy
The components described above (sensors, instruments, data acquisition panels, LAN, and networking equipment), com-bine to create a system that allows the project to efficiently
collect data from all plots and to transfer it to the central data storage location (Fig. 5). Data from an instrument or a sensor are recorded by dataloggers located in the data acquisition panels and then copied via the LAN to the data storage server. The data storage server calls each datalogger, every 30 min. If communication is established, the server copies the data acquired since the last call. Each datalogger has removable, compact flash (CF) card storage that serves as an interme-diate buffer. The CF storage operates as a re-writable stack, which means that if storage space is not available, newer data will replace older data at the top of the stack. Using CF cards as additional storage in dataloggers provides redundancy and serves as localized backup in case the whole network is down (e.g., power outage). Each CF card can hold several days of data, which is likely sufficient time to restore network com-munications. For longer outages new CF cards can be man-ually swapped with the installed CF cards. All dataloggers deployed are Campbell Scientific (CS) CR1000 models com-monly used for environmental science experiments and long-term meteorological observation stations. Use of commonly available standard equipment makes it possible to employ a suite of off-the-shelf software produced by CS as well. The main software component is the LoggerNet package. It sup-ports programming, communication, and data movement be-tween dataloggers and PCs. LoggerNet consists of a server application and several client applications integrated into a single product. Use of this package is especially convenient in applications that require telecommunications and sched-uled data retrieval within large datalogger networks. Another software package used to control and monitor data collection, sensors and instrument performance is the CS Real-Time Monitoring and Control software (RTMC). RTMC graphi-cally displays data, sets input locations, and toggles ports and flags. A simple yet powerful user interface allows RTMC to use components such as alarms, sliders, graphs, toggles, ta-bles, and gauges to design custom multitab displays that can be published via a web server and used for remote moni-toring and control (see example output window; Fig. 6). All collected data are saved in two forms for redundancy and as a backup: as comma separated value (CSV) text files and as a database where each table corresponds to a file. The CS LoggerNet Database software (LNDB) is used to move data from a LoggerNet data cache into a database such as Mi-crosoft SQL Server or MySQL. To reduce costs, the MySQL database was chosen as one of the most widely used open-source relational database management systems. This allows quality control and quality assurance procedures to be per-formed using flexible SQL queries and facilitates automated generation of necessary data reports. MySQL’s built-in repli-cation mechanisms are deployed to create an additional layer of redundancy and backup. A MySQL server at CB acts as a master and a slave server is set up off-site in the SPRUCE experiment office in Grand Rapids, MN.
Figure 5.SPRUCE data collection and monitoring system.
Figure 7.The data flow diagram.
4 Data management
As outlined above, data management is a set of policies, plans, and practices to control consistency, protect integrity, and deliver data to project users and the public. It sets operational definitions before the collection of data begins, ensures that everyone in the system has the same under-standing, collects data in a consistent manner, and outlines how to handle the data both during the experiment and after completion. Data management was planned to provide a structured framework for implementing project-defined requirements for maintaining data quality and consistency and controlling data processing from collection through archival and public access. SPRUCE data plans are consis-tent with the recently issued DOE (Department of Energy), Office of Science, Statement on Digital Data Manage-ment (http://science.energy.gov/ber/funding-opportunities/ digital-data-management) and with the Memorandum of Understanding (http://mnspruce.ornl.gov/system/files/sites/ default/files/MOU_USFS%26UT-Battelle.pdf) between the USFS and UT-Battelle.
4.1 Data flow
Figure 7 shows the SPRUCE data flow diagram starting from the sensors and ending at the archiving/distribution points as a representation of the data policy to inform investigators and potential data users of the general flow of data and in-formation before, during, and after the experiment. Data and metadata reporting standards help to facilitate efficient data
reporting, processing and analysis, and promote integration of diverse data across measurement domains.
4.2 Consistency and standardization
Data consistency and standardization plans assure that in-formation is uniformly created and maintained as it moves across the network to facilitate future processing of data in comparable forms. SPRUCE adopted several reporting con-ventions, best represented by three examples.
code should be negative and large enough to not be reason-able as an actual data value:−9999 for all integer and dec-imal variables. It is acceptable to match the format of the column and use repeated 9s (e.g., decimal: −999.99; inte-ger:−999) or scientific format (e.g.,−9.99×10²).
For identifying measured parameters, accepted variable names follow the standards of established research commu-nities (e.g., AmeriFlux) and are likely familiar to data users, for example, with temperature as TA for air temperature, TS for soil temperature, and TW for water temperature. Names also incorporate information about measurement height or depth and duplicates. For instance, the first duplicate air tem-perature at 2.0 m is abbreviated as TA_2_0_1.
Plant species codes are derived from the Natural Re-sources Conservation Service PLANTS Database (NRCS, 2010).
4.3 Data process planning
Data processing best practices were identified to support data collection, processing, quality assurance, and archiving ac-tivities. For example, guidance is provided for researchers regarding data entry, transfers, and transformations to ensure data integrity is maintained. Guidance is provided for man-aging and protecting hard copy and electronic media records during and after the project. Scripted programs are encour-aged for processing, quality assurance, and analysis of data as they provide documentation and traceability, and can be easily revised and re-executed as needed. Project conventions are specified for naming archive data products and for pre-ferred archive data file formats and file name structures.
The purpose of identifying best practices for data process-ing is to ensure the consistent quality of data products as de-fined in the SPRUCE Data Policy. More specifically, multi-ple levels of data quality are defined and managed for the SPRUCE experiment. Level 0 data are products of unspeci-fied quality that have been subjected to minimal processing in the field and/or in the laboratory (e.g., raw data, hard copy data sheets, scanned data sheets, and notebooks). This may, for example, be data from an instrument logger, expressed in engineering units or using nominal calibrations, or high-resolution data before aggregating to a selected interval. All Level 0 data should be submitted to the Data Archive for long-term storage but they are not shared. Instead, Level 1 data represent an internally consistent data product that has been subjected to standard quality checks and data manage-ment procedures. Level 1 data are suitable for sharing and analyses within the project. Level 2 data undergo additional quality checks and the addition of detailed metadata descrip-tions to enable their use externally as a consistent data prod-uct that has undergone interpretative and diagnostic analysis by SPRUCE. Level 2 data are intended to be shared with a the broad research community and the public well beyond the projects active time frame.
4.4 Data documentation, archiving and sharing
One of the main goals of the data policy is to expe-ditiously share experimental data among researchers, the broader scientific community, and the public. Advanced planning furthers efforts to identify, collect, and report consistent data and metadata and to facilitate timely data analysis, sharing, integration, and synthesis by all users. The pre-experiment S1 Bog characterization data are avail-able as file-based products for download including results of peat depth and volume studies, vegetation surveys and allometry measurements (http://mnspruce.ornl.gov/content/ public-data-download). S1 environmental monitoring data collected continuously from 2010 are available as a complete time series for project use but in annual increments of consis-tent products specifically for modelers and the public. Exper-imental treatment plot-based data products including discrete pre-treatment characterization results for vegetation growth, peat physical and chemical properties, water chemistry, and microbiological assays are and will be available as files. Inte-grated plot-based automated collection of treatment response variables will be accessed through relational database (RDB) interface for specific queries and visualizations. This RDB access is not intended for public use. Public access to these products is planned to be as exported files with consistent content for modeler and public use.
Data products are documented for users to understand the “who, what, when, where, and why” of the data product to maximize data reuse. Metadata includes the format and a data dictionary with column names, units, and a brief description of each field. The documentation includes any code defini-tions, methods and materials, links to related products, ref-erences to published analysis papers, and a complete citation for the data product with a registered digital object identi-fier (DOI). The DOI citation should be included as a refer-ence in subsequent publications to properly credit the origi-nal data providers.
(http://mnspruce.ornl.gov/) is implemented as part of the Carbon Dioxide Information Analysis Center (CDIAC) at ORNL. CDIAC is the primary climate-change data and in-formation analysis center of the US DOE and provides the long-term system stability and archive longevity required for the SPRUCE multiyear project and reliable public data ac-cess.
5 Summary
Ecosystem-scale manipulation experiments are getting more complicated and require innovative approaches that help manage high volumes of in situ observations. New large-scale, well-designed, and reliable data acquisition and man-agement systems will become common in the future. The presented approach shows an example of such a system that was built in a remote and harsh environmental location. The provided details about sensors, network layout, hardware, software, and data flow as well as the considerations behind them can be used for the design and development of similar systems for other experiments in the future.
Acknowledgements. This research and CDIAC were supported by the US Department of Energy, Office of Science, Biological and Environmental Research (BER), and conducted at Oak Ridge Na-tional Laboratory (ORNL), managed by UT-Battelle, LLC, for the US Department of Energy under contract DE-AC05-00OR22725.
This manuscript has been authored by UT-Battelle, LLC under contract no. DE-AC05-00OR22725 with the US Department of Energy. The publisher, by accepting the article for publication, acknowledges that the United States Government retains a non-exclusive, paid-up, irrevocable, worldwide license to publish or reproduce the published form of this manuscript, or allow others to do so, for United States Government purposes. The Department of Energy will provide public access to these results of federally sponsored research in accordance with the DOE Public Access Plan (http://energy.gov/downloads/doe-public-access-plan).
Edited by: L. Vazquez
References
Barbier, C., Hanson, P. J., Todd Jr., D. E., Belcher, D., Jekabson, E. W., Thomas, W. K., and Riggs, J. S.: Air Flow and Heat Transfer in a Temperature Controlled Open Top Enclosure, Pa-per #IMECE2012-86352, ASME International Mechanical En-gineering Congress and Exposition, 2012, Houston, TX, 2012. Hanson, P. J. and Wullschleger, S. D. (Eds.): North American
Tem-perate Deciduous Forest Responses to Changing Precipitation Regimes, Springer, New York, p. 421, 2003.
Hanson, P. J., Amthor, J. S., Wullschleger, S. D., Wilson, K. B., Grant, R. E., Hartley, A., Hui, D., Hunt Jr., E. R., Johnson, D. W., Kimball, J. S., King, A. W., Luo, Y., McNulty, S. G., Sun, G., Thornton, P. E., Wang, S., Williams, M., Baldocchi, D. D., and Cushman, R. M.: Oak forest carbon and water sim-ulations: model intercomparisons and evaluations against inde-pendent data, Ecol. Monogr., 74, 443–489, doi:10.1890/03-4049, 2004.
Hanson, P. J., Classen, A., Kueppers, L., Luo, Y., McDowell, N. G., Morris, J., Rogers, A., Thornton, P., Ceulemans, R., Dukes, J., Goulden, M., Jackson, R., Knapp, A., Kirschbaum, M., Lewin, K., MacCracken, M., Melillo, J., Ringler, T., and Workshop Participants: Ecosystem Experiments: Understanding Climate Change Impacts On Ecosystems and Feedbacks to the Physical Climate, in: Workshop Report on Exploring Science Needs for the Next Generation of Climate Change and Elevated CO2
Ex-periments in Terrestrial Ecosytems, 14–18 April 2008, Arlington, Virginia, http://science.energy.gov/~/media/ber/pdf/Ecosystem_ experiments.pdf (last access: 4 November 2015), 2008. Hanson, P. J., Childs, K. W., Wullschleger, S. D., Riggs, J. S.,
Thomas, W. K., Todd, D. E., and Warren, J. M.: A method for experimental heating of intact soil profiles for application to cli-mate change experiments, Global Change Biol., 17, 1083–1096, doi:10.1111/j.1365-2486.2010.02221.x, 2011.
Norby, R. J., Hanson, P. J., O’Neill, E. G., Tschaplinski, T. J., Weltzin, J. F., Hansen, R. T., Cheng, W., Wullschleger, S. D., Gunderson, C. A., Edwards, N. T., and Johnson, D. W.: Net primary productivity of a CO2 enriched deciduous forest and
the implications for carbon storage, Ecol. Appl., 12, 1261–1266, 2002.
NRCS – Natural Resources Conservation Service: Plants Database, Minnesota subset, http://plants.usda.gov/java/ nrcsStateDownload?statefips=27 (last access: 6 Novem-ber 2015), 2010.
Parsekian, A. D., Slater, L., Ntarlagiannis, D., Nolan, J., Sebesteyen, S. D., Kolka, R. K., and Hanson, P. J.: Uncertainty in peat volume and soil carbon estimated using ground-penetrating radar and probing, Soil Sci. Soc. Am. J., 76, 1911–1918, doi:10.2136/sssaj2012.0040, 2012.
Walker, A. P., Hanson, P. J., De Kauwe, M. G., Medlyn, B. E., Zaehle, S., Asao, S., Dietze, M., Hickler, T., Huntingford, C., Iversen, C. M., Jain, A., Lomas, M., Luo, Y., McCarthy, H., Parton, W., Prentice, I. C., Thornton, P. E., Wang, S., Wang, Y.-P., Warlind, D., Weng, E., Warren, J. M., Woodward, F. I., Oren, R., and Norby, R. J.: Comprehensive ecosystem model-data synthesis using multiple model-data sets at two temperate forest free-air CO2enrichment experiments: Model performance at
am-bient CO2concentration, J. Geophys. Res.-Biogeo., 119, 937–