Exciton Polariton Emission from a Resonantly
Excited GaAs Microcavity
E. A. Cotta, H. P. Ribeiro Filho, F. M. Matinaga, L. A. Cury, M. V. B Moreira,
W. N. Rodrigues, and A. G. de Oliveira
Departamento de F´ısica, Instituto de Ciˆencias Exatas,
Universidade Federal de Minas Gerais, Av. Ant ˆonio Carlos 6627, C.P. 702, CEP:30123-970, Belo Horizonte, MG, Brazil
Received on 28 June, 2004
Coherent emission efficiency in a 100 ˚A GaAs SQW microcavity was enhanced one order when pumped re-sonantly at 10 K, compared to the off-resonant excitation. The usual kink observed in the exciton emission linewidth as well as in the emission intensity in relation to the pump power, changes smoothly instead of the usual abrupt kink observed in the off-resonant microcavity laser. In addition, polarization measurements show a correlation relationship between the pump light polarization and the cavity emission polarization.
Cavity quantum electrodynamics effects (CQED) in a semiconductor microcavities with a volume of ∼ λ3
have been studied intensively in the last decade by many groups [1-5]. In contrast to the usual laser, which displays a well defined kink in the input-output (I/O) power curve, there is a dramatic change for this behavior in a cavity with high Q factor, i.e. high mode coupling efficiency (β). Thisβ factor has been enhanced from 1%[1, 2] in a Fabry Perot microcavity laser to 5% in a hemispherical cavity[3], and even more in a whispering gallery mode cavity[4]. In ad-dition, Rabi splitting effects were observed in the cavity re-flectance spectrum, characterizing a weak coupling regime in a planar microcavity[5]. All these effects were observed by off-resonant excitation techniques. On the other hand, changing to resonant excitation process, exciton-polariton (e-p) emission was observed for special pump beam inci-dence angle[6, 7, 8]. The emission nature of the e-p has been intensively discussed in the literature due to the possibility of generation of exciton condensed states [9-12], and also to explore the coherence property in a mesoscopic system[13]. We have studied experimentally a single quantum well (SQW) GaAs microcavity laser by off and resonant excita-tion techniques. The white light reflectance, photolumines-cence and polarization characteristics of the cavity emission was measured at 10 K. A Rabi Splitting of the cavity mode was observed in the low intensity white light reflectance, and such coupling regime was studied for higher pump intensity, and for different wave vector excitations. The optical pro-perties of the resonantly excited cavity show a non linear laser regime, showing us differences in relation to the off-resonant laser. These results are discussed in terms of the exciton polariton emission compared to a bare exciton laser, which depends on the excitation condition angle close or far from the “magic” incidence angle [10, 11] of the pump light. The GaAs planar microcavity structure was grown by molecular beam epitaxy (MBE). The cavity is formed
by a 100 ˚A GaAs SQW between two spacer layers of AlxGa1−xAs (x = 0.3) with a thickness of λ/n. The ca-vity layers are sandwiched between two distributed Bragg reflector (DBR) mirrors formed by 29.5 (below) and 24 (up-per) pairs of AlxGa1−xAs (x = 0.2)/AlAs layers with thick-ness ofλ/(4n) (n stands the respective refraction index of each layer). The cavity was designed in order to get the re-sonance window around 800nm, which matches the 100 ˚A GaAs SQW photoluminescence peak when cooled to 10 K. Thus, by growing half of the cavity without rotation in the MBE machine, we could find easily one position around the wafer, that matches the SQW emission peak with the cavity resonance.
(a)
(b)
Figure 1. (a) Experimental setup for resonant excitation and nor-mal mode emission measurement. (b) Rabi splitting observed in the reflectance spectrum of the white light as a function of the po-sition (0 to 495µm) in the microcavity.
The experimental results for the off-resonant excitation at 740 nm, i.e. the I/O pumping power relation, is shown in Fig. 2. The inverse relation of the kink’s amplitude in this I/O data curve (solid square symbols) gives us aβ es-timation of∼1% in good agreement with the theoretical li-mit for a planar DBR microcavity structure[14]. We attri-bute this higher performance to a confinement of the exci-ton dipole oscillator in the plane of the 100 ˚A SQW, which enhances the gain in the planar cavity mode. High perfor-mances of theβfactor in a planar Fabry Perot cavity have been observed already by Yokoyama in a dye microcavity laser[15]. The kink on the I/O pump power data curve indi-cates a threshold pump of 140 mW. If we consider the beam loss by reflections and considering an absorption coefficient of≈104
cm−1[16], a recombination time of 0.2 ns for the 100 ˚A SQW [17], the estimated intensity pump threshold is Pth ≈105W/cm2or one exciton density of≃8.4×10¹⁷
sity, and the previous normal mode splitting of 3.2 meV, cer-tify us the high quality of our microcavity sample.
Figure 2. I/O power measurement for a off-resonant excitation (closed circles), and linewidth(open blocks) & pump power.
The resonant pumping excitation with the incidence an-gleθ=6.8◦(in plane wave vectork
k = 9162cm−
1
), was measured by tuning the pump energy higher (∆= 1.6 meV) than the cavity emission. The value of∆was fixed by ob-serving the maximum efficiency of the cavity emission in-tensity as a function of the pump wavelength. These results are shown in Fig. 3a by the PL spectra sequence as a func-tion of the pump power. In these curves, there is a small blue shift of the emission peak (δ ≤ 0.2 meV) as we in-creased the pump power. In the I/O data (peak intensity of the photoluminescence spectra) for this resonant excitation (Fig. 3b), we did not observe a clear kink in the curve around the Pth(300 mW), but instead a smooth transition indicating a higher value for theβ value (∼17 %). In agreement with the I/O data, the emission linewidth as a function of pum-ping power also does not present a kink, it just decreases continuously in a sharp contrast with the off-resonant exci-tation behavior of the planar microcavity laser[18].
(a) (b)
Figure 3. (a) photoluminescence spectra as a function of pump power (the used power intensity sequence is the same illustrated in part b) ) for resonant excitation at kk= 9162 cm−1, (b) I/O of the peak power obtained from the photoluminescence s spectra (closed circles) and the Linewidth (open circles) versus pump power.
(a) (b)
Figure 4. (a) photoluminescence spectra sequence as a function of pump power(the power intensity sequence is illustrated in part b) for resonant excitation at kk= 5206 cm−1, (b) photoluminescence intensity peak power (closed circles) obtained from the photoluminescence spectra and the linewidth (open circles) as a function of pump power.
Figure 5. Energy flow paths for generation of the e-p and the ex-citon withk1wave vectors through lower (ωLP) polariton branch, and theωca(cavity photon energy) dispersion of the wave vector k2before emission.
When we excited with a smaller wave vector (kk= 5206 cm−1
), we observed that the “kink” at Pthreappeared, i.e. the coupling efficiency of the emission decreased, showing us different scattering process in these two wave vector pum-ping experiments. For smaller wave vector, we believe the exciton polariton emission is quenched due to the bot-tle neck effect for wave vector smaller than the magic an-gle[17]. The behavior of the measured photoluminescence spectra (fig.3,4), and the relation betweenδfor these two experiments,i.e. a larger blue shift in the small wave vector, leads us to conclude one e-p lower branch emission for kk = 9162 cm−1
and an exciton emission for excitation at the wave vector kk= 5206 cm−1as illustrated in Fig. 5.
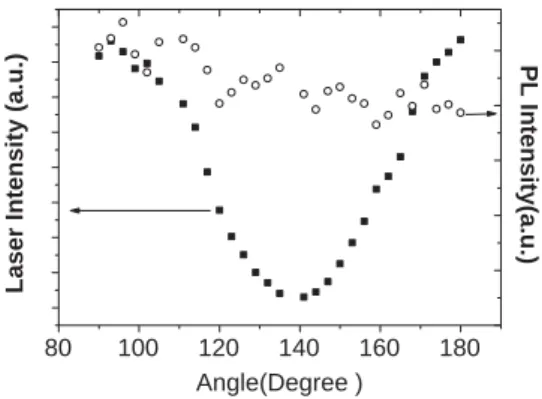
red with the pump polarization (left axis) at 440 mW. As we can observe, the exciton emission polarization orientation clearly follows the pump polarization orientation besides its lower polarization visibility. This behavior is not observed in the polarization dependence of the exciton emission in the off-resonantly excited microcavity laser, as well as in the resonantly excited cavity with smaller wave vector, as shown in Fig. 7. Some previous works claim that the pola-rization effects in a microcavity are due to the strain effect in the SQW[20] or are due to the bi-refringence effect[21]. In this experiment, however, the e-p polarization effect is a singular behavior of the scattering process coherence and not by structural characteristics of the microcavity. The po-larization dependence observed in this work shows directly the maintenance of the polarization during the e-p scattering process when generated from the lower e-p branch, which is not observed when we excite with smaller wave vector. This result corroborates with the coherence between the input la-ser and the output beam from the e-p scattering obla-served in the parametric amplification of the light by e-p microcavity [22].
0 30 60 90 120 150 180
0 1 2 3 4 5 6
e-p Emission Intensity (a.u.)
Pump Laser Intensity (a.u.)
Angle(Degree)
0 1 2 3 4 5
Figure 6. e-p emission polarization relationship for resonant exci-tation at kk= 9162 cm−1(right axis, open circles) and 440 mW, compared to the pump polarization light(left axis, closed circles).
The I/O curve, as well as the transition in the linewidth around the Pth, show us an improvement of more than an order of magnitude in theβ value (1% up to∼17%) when an e-p was generated by exciting the lower branch. It de-creased back to around 1% when we excited in the lower wave vector case. This lower β value is clearly observed also in the measured emission linewidth as a function of the pump power (Fig. 4b). Also, the blue shift in the exciton emission peak was much larger (0.62 meV) in the smaller wave vector excitation case, whose process is quite similar to the usual off-resonant exciton laser process. The obser-ved blue shift (≤0.2 meV) in the lower branch dispersion (Fig. 3) indicate no transition from the e-p emission to ex-citon emission when we increased the pump power. Those results comes close to the behavior observed by Stevenson [10]. This comparison lead us to conclude an exciton polari-ton emission process in our sample beyond the Pthintensity.
80 100 120 140 160 180
PL Intensity(a.u.)
Laser Intensity (a.u.)
Angle(Degree )
Figure 7. Pump (left axis, closed blocks) and cavity emission (right axis, open circles) intensity relationship as a function of the pola-rization angle for resonant excitation of the cavity at kk = 5206 cm−1and 440 mW.
The Pth observed in the resonantly excited e-p (lower branch) laser emission was around 300 mW, with a mea-sured 63% reflection loss in the pump beam. Considering the absorption coefficient of the pump light (α) one order of magnitude smaller in this resonant case[23], we estimate a density of n≃1016
cm−3
for the generated e-p at the Pth excitation level. This value is much smaller than the pre-vious off-resonant density at the respectivePth, which was estimated to be of the order of8.4×1017
cm−3. This smal-ler density enables us to estimate an e-p pair approximation length of d∼100nm. These values lead us to a picture of an e-p condensation into a final state in this resonantly exci-ted lower branch e-p emission. The evaluaexci-ted value for the e-p approximationd≃100 nm indicates a much higher ef-ficiency for the e-p emission process compared to the usual off-resonantPthcarrier density in the microcavity.
The mode coupling efficiency (β) analysis, the blue shift (δ) and the polarization’s correlation demonstrate that the coupling regime is strengthened when we excite the lower e-p branch, when compared to the usual off-resonant and or small wave vector excitation process. We measured a strong coupling regime only for low excitation regime with the white light reflectance spectrum (Fig. 1b), and we do not know how far this strong regime remain when we incre-ase the excitation power, but these results assure us one non linear regime for this exciton polariton emission from this SQW GaAs microcavity. Particularly, the small blue shift may be a sign for the state condensation of the exciton pola-riton, which comes in a good approach for our previous Pth density estimation.
branch, confirming us the coherence nature of the emitted light. The thermal scattering process in the smaller wave vector excitation case leads the emission process to a bare exciton laser, as usually observed in the off-resonant micro-cavity lasers. Finally, our results indicate that our microca-vity sample presents a non linear laser emission characte-ristics, which show us a powerful system to study coherent scattering process of the exciton polariton.
The authors acknowledges the financial support from Fa-pemig, CNPq and Finep/Pronex.
References
[1] R. Horowicz, G. Bj¨ork, A. Karlsson, and Y. Yamamoto, Phys. Rev. A 50, 1675 (1994).
[2] H. Yokoyama, K. Nishi, T. Anan, Y. Nambu, S. D. Brorson, E. P. Ippen, and M. Suzuki, Opt. Quantum Electron. 24, S245 (1992).
[3] F. M. Matinaga, A. Karlsson, S. Machida, T. Mukai, Y. Yama-moto, T. Suzuki, and M. Ikeda, ”Large Spontaneous Emission Coupling Efficiency in Hemispherical Microcavity Lasers”, -paper Conf. of Quantum Electronics Laser Science, Balti-more, May 1-7, paper QFI4, 1993.
[4] S. L. McCall, A. F. J. Levi, R. E. Slusher, S. J. Pearton and R. A. Logan, Appl. Phys. Lett. 60, 1492 (1992).
[5] C. Weisbuch, M. Nishioka, A. Ishikawa, and Y. Arakawa, Phys. Rev. Lett. 69, 3314 (1992).
[6] L. C. Andreani, F. Tassone, and F. Bassani, Solid State Com-mun. 77, 641 (1991).
[7] E. L. Ivchenko, Fiz. Tverd. Tela 33, 2388 (1991) [Sov. Phys. Solid State 33, 1344 (1991)].
[8] Y. Yamamoto, F. M. Matinaga, S. Machida, A. Karlson, J. Jacobson, G. Bj¨ork, and T. Mukai, J. De Physique IV, 3, 39 (1993).
[9] H. Cao, S. Pau, J. M. Jacobson, G. Bj ¨ork, Y. Yamamoto, and A. Imamoglu, Phys. Rev. A, 55, R4632 (1997); R. Huang, F. Tassone, and Y. Yamamoto, Phys. Rev. B 61, R7854 (2000).
[10] R. M. Stevenson, V. N. Astratov, M. S. Skolnick, D. M. Whit-taker, M. Emam-Ismail, A. I. Tartakovskii, P. G. Savvidis, J. J. Baumberg, and J. S. Roberts, Phys. Rev. Lett. 85, 3680 (2000).
[11] M. Kira, F. Kanhke, S. W. Koch, J. D. Berger, D. V. Wick, T. R. Nelson Jr., G. Khitrova, and H. M. Gibbs, Phys. Rev. Lett.
79, 5170 (1997).
[12] J. P. Dowling and C. M. Bowden, Phys. Rev. Lett. 70, 1421 (1993).
[13] D. Snoke, Science 298, 1368 (2003).
[14] G. Bj¨ork and Y. Yamamoto, IEEE J. Quantum Electron.
QE-27, 2386 (1991).
[15] H. Yokoyama, Science 58, 66 (1992).
[16] Landolt-B¨orstein, Numerical Data and Functional Relati-onships in Science and Technology, Vol 17, Springer-Verlag, Berlin 1984.
[17] D. S. Citrin, Cond. Mat. Phys. 16, 263 (1993).
[18] R. J. Horowicz, H. Heitmann, Y. Kadota, Y. Yamamoto, Appl. Phys. Lett. 61, 393 (1992).
[19] J. J. Baumber, P. G. Savvidis, R. M. Stevenson, A. I. Tarta-kovskii, M. S. Skolnick, D. M. Whitaker, and J. S. Roberts, Phys. Rev. B 62, R16247 (2000).
[20] F. M. Matinaga, A. Karlsson, T. Suzuki, Y. Kadota, M. Ikeda, and Y. Yamamoto, Appl. Phys. Lett. 62, 443 (1993).
[21] E. C. Valadares, L. A. Cury, F. M. Matinaga, M. V. B. Mo-reira, J. Appl. Phys. 82, 1500 (1997).
[22] S. Savasta, O. Di Stefano, and R. Girlanda, Phys. Rev. Lett.
90, 096403-1 (2003).