76
Brazilian Journal of otorhinolaryngology 75 (1) January/feBruary 2009 http://www.rborl.org.br / e-mail: revista@aborlccf.org.br
Correlation analysis of the
visual-analogue scale and the
Tinnitus Handicap Inventory
in
tinnitus patients
Summary
Ricardo Rodrigues Figueiredo1, Andréia Aparecida de Azevedo2, Patrícia de Mello Oliveira3
1 MSc in General Surgery, Otorhinolaryngology - Federal University of Rio de Janeiro, Assistant Professor of ENT - Medical School of Valença, RJ. 2 MD. Otorhinolaryngologist - OTOSUL, Otorrinolaringologia Sul-Fluminense, Volta Redonda, RJ.
3 Speech and Hearing Therapist, OTOSUL, Otorrinolaringologia Sul-Fluminense, Volta Redonda, RJ.
OTOSUL, Otorrinolaringologia Sul-Fluminense.
Send correspondence to: Rua 40 número 20 salas 216 a 218 Vila Santa Cecília Volta Redonda RJ 27255-650. Tel/fax (0xx24) 3348-6382 ¬- home Page www.otosul.com.br - E-mail rfigueiredo@otosul.com.br This paper was submitted to the RBORL-SGP (Publishing Manager System) on 18 August 2007. Code 4723.
The article was accepted on 9 October 2007.
O
ne of the most challenging topics in tinnitus clinical studies is the measuring method used. Visual Analogue Scales (VAS) and Tinnitus Handicap Inventory (THI) are frequently used in tinnitus. Aim: To verify the relationship between VAS and THI scores in tinnitus patients in a prospective study.Materials and methods: 43 patients classified their tinnitus according to VAS and THI, and both scores were compared through the Spearman’s correlation coefficient test. Results:
There was a correlation between the VAS and THI scores.
Conclusion: There is correlation between VAS and THI scores in patients with sensorineural tinnitus.
Keywords: measurement, tinnitus.
original article Braz J Otorhinolaryngol
77
Brazilian Journal of otorhinolaryngology 75 (1) January/feBruary 2009 http://www.rborl.org.br / e-mail: revista@aborlccf.org.br
INTRODUCTION
Tinnitus is defined as the perception of a sound in the absence of an external sound source. Epidemiological studies report tinnitus incidence of 1 to 32% of the popu-lation, estimating between 35 and 50 million people in the USA. This incidence increases in the elderly population,
reaching up to 15% in the age range above 65 years1,2.
We may classify tinnitus in para-auditory (genera-ted by muscular and vascular structures near the auditory pathways) and auditory (generated by alterations in the ear and auditory pathways). Among the latter, most cases
correspond to the so-called “sensorineural tinnitus”3. The
most recent theories consider tinnitus being generated at a cochlear level, with later perception in the central auditory pathways4,5.
Tinnitus treatment is, until current days, one of the major challenges faced by otolaryngologists. Among the many factors responsible for this difficulty, one of them is, without doubt, how precarious are the tinnitus measure-ment and assessmeasure-ment methods, and there is no consensus in the literature as to the ideal assessment method.
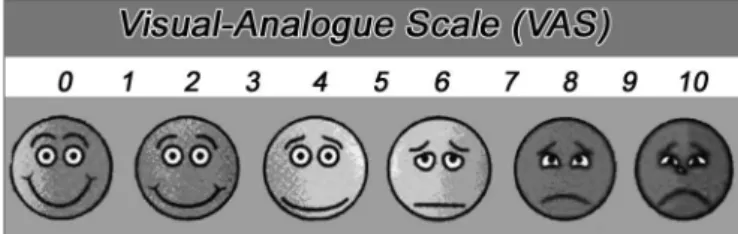
One of the most used method is the visual-analogue scale (VAS), very much used to assess chronic pain. In tin-nitus patients, we ask the patient to assign a 0 to 10 score to their tinnitus, with the help of a proper ruler (Fig.1). The assessment must be carried out in relation to volume and disturbance. It is easily applicable and understood by most patients. However, this is a superficial assessment,
impac-ted by cultural, intellectual and psychological aspects6.
In 1996, Newman et al. published a paper about the development of a Tinnitus Handicap Inventory (THI), through observing and studying other methods, such as Tinnitus Handicap/Support Questionnaire, Tinnitus Effect Questionnaire, Tinnitus Severity Questionnaire and Tin-nitus Reaction Questionnaire. According to the authors, its main goal was to create a method with the following characteristics7:
- Validity and reliability.
Clinical data of patients with tinnitus and data from other scales were used in order to develop THI. Three
main items are assessed in THI, namely7:
- Functional reactions to tinnitus, such as difficulties to concentrate and anti-social trends;
- Emotional reactions to tinnitus, such as anger, frustration, irritability, depression;
- catastrophic reactions to tinnitus, such as despair, a feeling of hopelessness, a fear of a “severe disease”, loss of control and incapacity to cooperate.
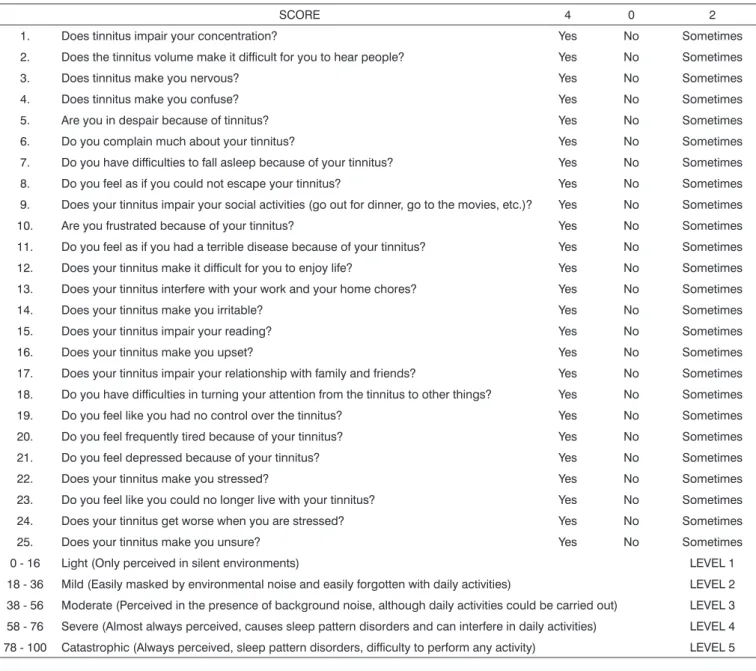
THI is today one of the most accepted method to assess tinnitus, having been advocated in many consen-sus. THI validation to Brazilian Portuguese (Chart 1) was carried out in 20058.
Our objective in the present study is to assess the correlation between VAS scores and THI in patients with sensorineural hearing loss.
MATERIALS AND METHODS
We selected 43 patients with tinnitus seen in our service between March 2006 and January 2007. Inclusion criteria were sensorineural-related tinnitus, and we ruled out cases of concurrent external and middle ear diseases and TMJ disorders. Tonal and vocal audiometry and impe-dance tests were carried out in all the patients, and we took off those with conductive hearing loss, mixed hearing loss and those with types A-r, A-d, C and B tympanic curves. The audiometer we used was an AMPLAID A 177 PLUS, and the AMPLAID 750 impedance meter.
We asked the patients to fill out a validated questio-nnaire, in the case of THI (Tinnitus Handicap Inventory) in its Portuguese version. Moreover, the patients classified their tinnitus according to the visual-analogue scale, from 1 to 10 (in terms of volume and disturbance), and we correlated THI and VAS scores through the Spearman’s coefficient correlation. Spearman’s correlation coefficient (rs) measures the level of association between two varia-bles. This coefficient varies from -1 to 1, the closer it is to 1 or -1, the stronger is the association the closer it is to zero, the weaker the relation between the two variables. The negative coefficient expresses an inverse relationship between the two variables.
The study was approved by the Ethics in Research Committee of the Valença Medical School, under protocol # 003/2006.
RESULTS
The data on the sample characterization can be found on Chart 2.
According to the Spearman’s relation coefficient, we observed that there is a significant correlation between Figure 1. Model of the visual-analogue scale (VAS) used.
- Summarized and proper for daily clinical prac-tice
- Easy application and interpretation
78
Brazilian Journal of otorhinolaryngology 75 (1) January/feBruary 2009 http://www.rborl.org.br / e-mail: revista@aborlccf.org.br
Chart 1. THI questionnaire adapted to Brazilian Portuguese (Ferreira PEA, Cunha F, Onishi ET, Branco FCA, Ganança FF).
SCORE 4 0 2
1. Does tinnitus impair your concentration? Yes No Sometimes
2. Does the tinnitus volume make it difficult for you to hear people? Yes No Sometimes
3. Does tinnitus make you nervous? Yes No Sometimes
4. Does tinnitus make you confuse? Yes No Sometimes
5. Are you in despair because of tinnitus? Yes No Sometimes
6. Do you complain much about your tinnitus? Yes No Sometimes
7. Do you have difficulties to fall asleep because of your tinnitus? Yes No Sometimes
8. Do you feel as if you could not escape your tinnitus? Yes No Sometimes
9. Does your tinnitus impair your social activities (go out for dinner, go to the movies, etc.)? Yes No Sometimes
10. Are you frustrated because of your tinnitus? Yes No Sometimes
11. Do you feel as if you had a terrible disease because of your tinnitus? Yes No Sometimes
12. Does your tinnitus make it difficult for you to enjoy life? Yes No Sometimes
13. Does your tinnitus interfere with your work and your home chores? Yes No Sometimes
14. Does your tinnitus make you irritable? Yes No Sometimes
15. Does your tinnitus impair your reading? Yes No Sometimes
16. Does your tinnitus make you upset? Yes No Sometimes
17. Does your tinnitus impair your relationship with family and friends? Yes No Sometimes
18. Do you have difficulties in turning your attention from the tinnitus to other things? Yes No Sometimes
19. Do you feel like you had no control over the tinnitus? Yes No Sometimes
20. Do you feel frequently tired because of your tinnitus? Yes No Sometimes
21. Do you feel depressed because of your tinnitus? Yes No Sometimes
22. Does your tinnitus make you stressed? Yes No Sometimes
23. Do you feel like you could no longer live with your tinnitus? Yes No Sometimes
24. Does your tinnitus get worse when you are stressed? Yes No Sometimes
25. Does your tinnitus make you unsure? Yes No Sometimes
0 - 16 Light (Only perceived in silent environments) LEVEL 1
18 - 36 Mild (Easily masked by environmental noise and easily forgotten with daily activities) LEVEL 2
38 - 56 Moderate (Perceived in the presence of background noise, although daily activities could be carried out) LEVEL 3
58 - 76 Severe (Almost always perceived, causes sleep pattern disorders and can interfere in daily activities) LEVEL 4
78 - 100 Catastrophic (Always perceived, sleep pattern disorders, difficulty to perform any activity) LEVEL 5
Figure 2. Relationship between VAS and THI scores.
THI and VAS (rs = 0.564; p = 0.0001; n = 43). This means that, the higher the VAS, the higher the expected value for THI (direct relation), as shown on Fig.2.
DISCUSSION
79
Brazilian Journal of otorhinolaryngology 75 (1) January/feBruary 2009 http://www.rborl.org.br / e-mail: revista@aborlccf.org.br The correlation between the two methods, seen in
our data, increases the reliability of the studies already car-ried out with VAS, a simpler method and, in our opinion, it is easier to understand by the majority of the Brazilian population. However, we consider THI a more complete method for tinnitus assessment, especially when we con-sider the daily and psychological aspects of tinnitus.
Considering such facts, we started to employ both methods together in our clinical studies, and this makes our results more reliable, as we see it.
CONCLUSION
There is a correlation between the Visual-Analogue Scale and the Tinnitus Handicap Inventory in patients with sensorineural tinnitus.
ACKNOWLEDGEMENTS
Rosângela Noé, through statistical analysis.
REFERENCES
1. Azevedo AA, Figueiredo RR. “Atualização em zumbido”, Rev Bras Otorrinolaringol . 2004 70(1). Caderno de Debates:27-40.
2. McFadden, D. Tinnitus: Facts, Theories and Treatments. Washington, D.C.: National Academy Press. 1982;1-150.
3. Shulman A. Classification of tinnitus. In Tinnitus, Diagnosis and tre-atment (Shulman A et al.). Philadelphia: Eds. Lea and Feibiger; p. 248-52.
4. Figueiredo RR, Azevedo AA. Aminoácidos neurotransmissores nas vias auditivas. Revista da Sociedade de ORL do Rio de Janeiro . 2004;4(2):49-54.
5. Eggermont J. Central Tinnitus. Auris Nasus Larynx . 2003;30:7-12. 6. Azevedo AA, Mello PO, Siqueira AG, Figueiredo RR. Análise Crítica
dos Métodos de Mensuração do zumbido. Rev Bras Otorrinolaringol. 2007;73(3):418-23.
7. Newman C, Jacobson CG, Spitzer JB. Development of the Tin-nitus Handicap Inventory. Arch Otolaryngol Head Neck Surg . 1996;122(2):143-8.
8. Ferreira PEA, Cunha F, Onishi ET, Branco FCA, Ganança FF. Tinnitus Handicap Inventory: adaptação cultural para o português brasileiro. Pró-Fono . 2005;17(3):303-10.
Chart 2. Sample characterization.
N=43 MEAN STANDARD DEVIATION ()
AGE 62.85 years 10.30 years
GENDER M- 30.33%; F-69.77%
-x-TIME OF TINNITUS 7.45 years 9.55 years
PERIODICITY Continuous - 74.42%
Intermittent - 35.58%
-x-TYPE OF TINNITUS
Low pitch - 62.84% High pitch- 28.56% Other - 8.60%
-x-PROBABLE ETIOLOGY
Presbycusis - 35.8% PAINEPS - 11.3% Metabolic - 7.5% Others - 3.8% Multiple - 24.6% Idiopathic - 17%
-x-AUDIOMETRIC CURVE
Descending - 81.1% Drop - 7.5% Ascending - 7.5% Other - 3.9%
-x-Analogue-Visual Scale 6,7 2,5