A Work Project, presented as part of the requirements for the Award of a
Master Degree in Finance from the
NOVA
–
School of Business and Economics
and a
Professional Master in Finance from the
Fundação Getúlio Vargas
-
São Paulo School of Economics.
The determinants of Brazilian corporate credit ratings:
How did the market react to sovereign downgrades?
Nicolò Rocca
Nova SBE Student number: 26275 FGV-EESP Student number: 334782
A Project carried out on the International Master in Finance Brazil-Europe course, under the supervision of:
Professor Miguel Ferreira (Nova SBE, Lisbon, Portugal)
Professor Ricardo Rochman (EESP-FGV, Sao Paulo, Brazil)
Abstract
The first purpose of this research is to study which are the main determinants of the
changes of Brazilian corporate credit ratings provided by Standard & Poor’s. Panel
regressions are applied in order to analyze the relations between ratings and seven
determinants. Results show five statistically significant determinants.
The second part of the study examines how Brazilian listed companies reacted to the
recent sovereign downgrades issued by Standard & Poor, Moody’s and Fitch. Event
study methodology is used. All the events deliver empirical evidences of negative
abnormal returns, showing a strong negative correlation between the credit rating
negative actions and the Brazilian stock market. When aggregating the events,
downgrades to junk territory and Moody’s rating’s changes are the ones upsetting
stocks returns the most.
Contents
1.
Introduction
………..
4
2.
Literature Review
………....
...
7
3.
Hypothesis...
………....
...
10
3.1 Determinants of ratings hypothesis
………
10
3.2 Brazilian sovereign downgrade hypothesis
………
13
4.
Methodology
………
...
16
4.1 Panel Data Regression
………
16
4.2 Event Study
………
17
5.
Data and Sample
………..
...
20
6.
Results
……….
21
6.1 Regression Results
……….
21
6.2 Event Studies Results
………
25
7.
Conclusions
………...
...
36
8.
Reference
………
...
38
1. Introduction
Credit rating agencies play an important role in modern financial markets since they have
privileged access to private information about security issuers thanks to their needed
screening processes. According to Kang and Liu (2007), credit ratings have been
historically embraced by financial markets because the levels and changes in ratings
demonstrated to be a measure of the likelihood of defaults.
Companies in Brazil, and elsewhere, generally seek credit ratings to facilitate their
issuance of bonds and commercial paper. Investors normally prefer rated securities to
unrated securities and generally, the higher the rating, the larger is the second market of
the related financial securities. Higher ratings securities are then easier to sell and
exchange. In addition to that, some financial institutions are prohibited by their by-laws
to invest in securities which ratings are below a certain level, especially in emerging
markets. Changes in ratings can reflect variations of investor’s positions; they can
strongly affect financial securities’ prices as well.
The Brazilian firms are mostly rated by the two leading rating agencies, Standard and
Poor’s and Moody’s. Each of these agencies rate individual companies for both long
-term and short--term obligations (commercial paper). Standard and Poor’s further
expands the rating classification in terms of local currency and foreign currency ratings.
Credit ratings, in an emerging market as Brazil, are important not only because they
help to assess risk in the Brazilian capital markets, but they also affect the ability of the
Brazilian firms to borrow in overseas markets and in foreign currency.
According to Han, Shin, Reinhart, and Moore (2009), credit ratings, especially those
wish to invest in corporate debt from emerging markets. Normally financial information
in emerging markets is considerably less transparent than in advanced markets, this is
due to a lack of reliable financial institutions that can certify the safety of an obligation
to international investors.
Standard and Poor’s screening for each firm is both quantitative and qualitative, it
attempts to capture the unique characteristics of each issuer. Factors that could affect
the rating are the industry regulations, its competition and functional activities,
management strategy, expected growth, risk profile, and the shareholders structure and
vision. Identifying an pragmatic relationship between the qualitative factors and the
ratings is complicated. However, Standard and Poor’s indicate that financial ratios play
a key role in assigning ratings. According to Lopes and Walker (2012), the Brazilian
market is characterized by low law enforcement, high manipulation of financial
statements due to tax influences, an unstable financial market and modest governance
standards. In this sense, it is not clear if credit ratings play a significant role in the
Brazilian market.
Emerging markets in general have some specific characteristics that can lead to
different results than those found in other more developed markets. Different
regulations, governance standards and lower liquidity can lead to different results
compared to mature markets.
This study initially tries to find out which are the main determinants of corporate
credit ratings in Brazil. Starting from some hypothesis, it then studies the behavior of
seven determinants in relation to the corporate credit ratings’ movements.
Due to the overall economic instability following the recent financial meltdown,
sovereign downgrades outpaced upgrades in the last years. During the European debt
crisis, almost every European sovereign debt suffered downgrades from the main rating
agencies (Standard & Poor’s - Moody’s - Fitch). Similarly, during the recent
commodities crisis, most of the emerging markets “commodity-dependent” sovereigns
were downgraded. In the meantime Brazil suffered an economic and political
breakdown that brought rating agencies to downgrade several times the national debt.
The second part of the research tries to understand how these recent sovereign
Brazilian debt’s downgrades affected the stock market, studying the behavior of the
stocks returns of the main Brazilian listed firms that are part of the Ibovespa index.
After studying the relation between quantitative determinants and ratings, it is of the
study interest to understand how Brazilian companies reacted to negative changes of the
national rating. The sovereign rating of a country is often seen as the maximum rating
for the national companies; downgrades of the broad debt strongly affect companies’
ratings. The research tries to evaluate how these changes affected companies’ stock
2. Literature Review
Credit risk is related with the capacity of a lender to fulfill its obligations. The concept
of credit risk can be seen as the probability of an issuer to default, that leads to
non-payment of interest and/or principal. Corporate Rating, in the Australian case, per Gray
(2006), is “an independent valuation of a firm’s ability to make debt payments in time”.
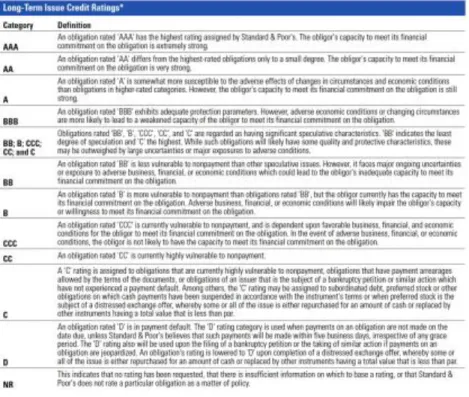
Normally credit ratings are associated to letters. Table 1 shows Standard & Poor’s
rating definitions for long-term issue credit ratings.
Illustration source: Standard&Poors.com
The credit agencies emphasize that ratings from AA to CCC may be modified by the
addition of positive (+) and negative (-) signs to show a relative position within a
certain rating category. Periodical outlooks (Negative – Positive – Stable), that indicates
The researches regarding determinants of credit ratings start with Bouzouita and
Young (1998) paper. They studied United States insurance companies that received a
rating from the A.M. Best. They find out, as significant variables for the determination
of credit ratings, profitability, growth in surplus, leverage, line mix, liquidity, size and
organizational form.
Researches on this topic continue with Adams, Burton and Hardwick (2003) paper,
they both study Insurance companies credit ratings determinants but for companies from
United Kingdom. As already mentioned Gray, Mirkovic and Ragunathan (2006) study
determinants for Australian companies and, regarding Brazil, Sales (2006) do a first
research on 44 Brazilian banks. Bone (2007) considers just Petrobras on his study.
Damasceno, Artes and Minardi (2008) paper is focused on 39 firms that operate in
Brazil. Finally, Bone and Ribeiro (2009) study 16 non-financial Brazilian firms and
Murcia, Rover, Rover and Borba (2011) work on a sample of 49 non-financial Brazilian
firms.
All the researches try to find significance of different determinants on credit ratings.
Depending on the sample and type of company, different variables seem to be
significant. Profitability and leverage seem to be the most relevant ones.
It is important to mention that credit ratings have been criticized in the last years; they
played a significant role in American subprime crisis. Hundreds of billions of mortgages
related securities and collateralized debt obligations were rated triple A, enabling them
to be traded and to have a relevant secondary market. The write-downs and losses from
these securities led to the collapse of the financial system. The same agencies were
debt crisis issuing “political” and strict downgrades. According to literature the rating
classification process lacks transparency, leading to the question of what are the
relevant factors taken into consideration by the agencies.
Reactions of the markets following changes of sovereign ratings debt have been
broadly studied as well. Sovereign downgrades directly affect corporate ratings (as the
sovereign debt can be seen as a measure of the overall economy health) and the loss of
the sovereign investment grade can mean that investors are forced to sell country’s
bonds. Brooks, Faff, Hillier and Hillier (2003) found out that sovereign debt’s rating
upgrades have little market impact, while downgrades are normally associated to an
overall reduction in the market value. In case of downgrades, S&P and Fitch were found
to be the most informative ones for the markets studied.
Almeda, Cunha, Ferreira and Restrepo (2012) show that debt impairments can have
considerable effects on the respective stock markets and real economy activities through
the sovereign credit rating channel. Following sovereign downgrades, firms reduce their
investment and reliance of the credit market. This is consistent with the increase in
firms’ cost of debt caused by the downgrades. Fatnassi, Ftiti and Hasnoui (2014) realize
that sovereign credit signals normally have impact on financial markets. Reactions
follow both own-country and closely related foreign countries. During the recent
sovereign debt crisis, market of four European countries, Greece, Italy, Spain and
Portugal, where affected by ratings’ negative announcements. Own-country market
returns’ where initially affected and contaminated the neighbors’ markets shortly after.
In addition, an interesting research by Shang and Saito (2005) shows that the Brazilian
3. Hypothesis
3.1 Determinants of ratings hypothesis
For the first part of the research seven hypotheses are formulated. Each of these is
associated to an hypothesis and has an expected relation with Brazilian corporate credit
ratings.
Hypothesis 1: More profitable firms have higher credit ratings.
According to literature the proxy used for profitability is Net Profit / Equity.
Auditing of profitability ratios enable financial analysts and regulators to assess a
company ability to continue its growth and to invest in new projects. In addition to
provide an indication of a company ability to respect its obligations, measures of
profitability help to understand if the company it is successful in controlling expenses
adequately.
Managers of profitable companies expect to obtain higher rating that helps to improve
the corporate market profile. Moreover, in general, the higher the level of profitability,
the better the company’s assigned credit rating.
Hypothesis 2: Bigger companies have higher credit ratings.
In many studies, company size is calculated as the Logarithm of the total assets, the
paper will use the same proxy.
Bouzouita and Young (1998) suggest that “company size is likely to be positively
correlated with assigned credit ratings because larger entities have access to a relatively
operations”. The research expects bigger companies to obtain higher ratings.
Hypothesis 3: More leveraged companies have lower credit ratings.
According to literature the used proxy for leverage is Total Liabilities / Total assets.
Normally, as a company increases its level of debt, it becomes, from a credit
perspective, riskier. Shiu and Chiang (2008) suggest that “a firm with high debt tends to
have high financial uncertainty and consequent high risk of insolvency”. Its financial
obligations are more likely to be found insolvent. The paper then expects an overall
negative correlation between credit ratings and leverage.
Hypothesis 4: Higher company growth means higher credit ratings.
Company growth is approximated as the Change in annual revenues.
A company with high growth it is expected to keep increasing its revenues over time.
Adams et al. (2003) shows that higher growth rates are often associated with higher
credit ratings because they indicate an expected important future cash flow
performance. Companies with constant and high growth are showing the market their
health, therefore they are more likely to be considered less risky than companies with
non-constant, low or negative growth.
Hypothesis 5: Companies with higher financial coverage have higher credit ratings.
The approximation for financial coverage is EBIT / Interest expense.
The financial coverage indicators attempt to understand how well a company can
generate cash flow to pay its future interest expenses (Bone, 2007). As companies’ cash
flows decline, the default risk directly increases, as there is a reduction of earnings that
be positively correlated to credit ratings.
Hypothesis 6: Higher long-term-debt-ratio means lower credit ratings.
Per Roje (2005) long-term-ratio can be approximated as Long term debt / Total assets.
A high level of long term debt obligations can higher the credit risk of the company, the
firm can face difficulties to respect its obligations if future cash flows will not rise
accordingly. In fact, the more the ratio is increasing, the more the company is going to
be leveraged in the long term compared with the total assets, even more if the revenue
growth is not growing at the same pace. This relationship should be particularly
informative for an emerging market like Brazil, where long term is less predictable for
the presence of inflation and political risks as well as other unsecure economic factors
(i.e. BRL/USD exchange rate, China economic performance).
Hypothesis 7: Liquidity has a positive relationship with credit ratings.
Liquidity is approximated as Current Assets / Current Liabilities.
Higher liquidity helps companies to meet unpredicted needs for cash, without fronting
liquidation of assets (Bouzouita & Young (1998), p. 27). Higher liquidity means a firm
has a better ability to cover liabilities with its current liquid assets, in fact either they are
3.2 Brazilian sovereign downgrades hypothesis
For the extent of the research,, this work will use event study methodology to study how
Brazilian listed companies’ stock returns behaved around each downgrade. Strong
evidences that each downgrades affected stock prices are expected. The reaction of 58
listed Brazilian companies around 11 events are going to be studied, each representing a
sovereign downgrade or a negative change in the outlook. Events’ days are reported in
table 2.
24.03.2014 S&P Downgrade two notch
09.09.2014 Moody’s Negative change in the outlook 09.04.2015 Fitch Negative change in the outlook 28.07.2015 S&P Negative change in the outlook 11.08.2015 Moody’s Downgrade one notch
08.09.2015 S&P Downgrade to junk 15.10.2015 Fitch Downgrade one notch
09.12.2015 Moody’s Negative change in the outlook 16.12.2015 Fitch Downgrade to junk
17.02.2016 S&P Downgrade one notch 24.02.2016 Moody’s Downgrade to junk
Table 2: Brazilian sovereign debt’s rating changes.
On the 24th of March 2014 S&P downgrades Brazilian debt, denominated in both local
and foreign currency, from BBB+ to BBB-, following large fiscal deficits, measly
growth prospects and use of accounting tricks. Shortly after, Moody’s, on the 9th of
September of the same year, changed the outlook from stable to negative, threatening to
downgrade Brazilian debt soon if the economy would not end the slowdown and live in
political instability. Fitch was the last agency to react to the Brazilian slowdown under
the Rousseff government, changing the outlook from stable to negative on the 9th of
April 2015.
junk; the agency changes its outlook on the sovereign debt from stable to negative.
Soon after Moody’s downgrades Brazilian debt from Baa3 to Baa2, following weaker
than expected economic performance, the related increase in government expenditures
and in the overall debt.
On the 9th of September 2015, for the first time since 2008, S&P downgraded
Brazilian debt to BB+, the highest junk rating. The faster-than-anticipated downgrade
came after amplified political problems that have muddled economic policy. On the 15th
of October, Fitch downgrades Brazil to BBB-. Shortly after Fitch is the second rating
agency, on the 16th of December 2015, to downgrade the sovereign debt to the highest
notch of junk, citing mostly political risks. This is the downgrade that the work expects
to influence the most the market as many foreign investors and pension funds are
required to sell bonds once two separate agencies rate them as speculative grade.
Few days before, on the 9th of December, Moody’s changed the outlook again from
stable to negative, citing mostly political instability. The agency threatened to cut the
debt to junk soon. That happened on the 24th of February 2016, when Moody’s rating
was scratched to Ba2 from Baaa3. The event brought the sovereign Brazilian debt to
speculative grade for all the three main credit agencies. The economic recession, the
increasing fiscal deficits, the commodities crisis, the currency devaluation and the
political situation, with the president Dilma Rousseff involved in an impeachment
process, were the main drivers of the downgrades.
Hypothesis: This paper expects to find a negative correlation between downgrades and
negative changes in outlooks and the stocks returns of the main Brazilian listed
companies. The most informative downgrade is expected to be Fitch one the 16th of
December 2016, which brought the whole country into junk territory. The extent of the
research groups the events together; S&P downgrades, since it is normally the first
agency to act, and downgrades to junk, are the groupings expected to be more
4. Methodology
4.1 Panel Data Regression
In order to be able to run regressions with ratings as variables, several authors have
converted ratings into numerical values. By doing so, we obtain an ordinal variable,
which may be ordered.
This research will use two different conversion tables, inspired by different papers.
These studies, Ashbaugh-Skaife, Collins, & LaFond, (2006); Damasceno, Artes, &
Minardi, (2008); Silva, Santos, Torres, & Ferreira, (2009), have opted to split the
ratings into seven groups. While Emawtee Bissoondoyal, Bheenick (2008) have opted
to split the ratings into 21 groups. Table 3 and Table 4 show the different conversion
ratings approach for Standard & Poor’s ratings.
Table 3: Ratings conversion into 21 classes. Table 4: Ratings conversion into 7 classes.
S&P CLASSES AAA 22 AA+ 21 AA 20 AA- 19 A+ 18 A 17 A- 16 BBB+ 15 BBB 14 BBB- 13 BB+ 12 BB 11 BB- 10 B+ 9 B 8 B- 7 CCC+ 6 CCC 5 CCC- 4 CC 3 C 2 D/SD 1
S& P CLA SSES
Testing the correlations is also important to be sure that multicollinearity can be
excluded.
The following equation is used to run the panel data regression in order to estimate the
coefficients of the independent variables:
RATING = 𝛽0 + 𝛽1Leverage + 𝛽2Profitabilty + 𝛽3Size + 𝛽4Coverage + 𝛽5Growth +
𝛽6Liquidity + 𝛽7Longtermratio + 𝜀1
The equation is used for two different dependent variables, derived from the
two-different ratings conversation tables.
4.2 Event Study
Event study is used for the second part of this project. Fama et al. (1969) introduced this
methodology. Since then many studies have used this methodology to produce useful
evidence on how stock prices respond to a set of information. Event study analyses
differentiate between the returns that would have been expected if the analyzed event
would not have taken place, normally the returns calculated on a previous-event
window and the returns that were caused or not by the respective event, namely the
abnormal returns. They can be summarized by the following equation:
𝐴𝑅𝑖,𝑇 = 𝑅𝑖,𝑇 − 𝐸[𝑅𝑖,𝑇|Ω𝐼,𝑇] (1)
The expected returns are then considered unconditional on the event but conditional on
a separate information set. Different analytic techniques can be used; they differ with
respect to the model used for predicting the normal returns before the event date.
For the objective of the research the focus is on one measure of aggregated abnormal
returns. The cumulative abnormal returns (CAR) that accumulates abnormal returns
𝐶𝐴𝑅𝑖(𝑇1,𝑇2) = ∑𝑡=𝑇1
𝑇2 𝐴𝑅
𝑖,𝑇 (2)
Due to the chance of downgrades prevention and anticipation by the market, this study
estimates the estimation windows from 320 to 120 days before the announcement date,
in order to exclude possible biased information in the pre-event window.
For the considerably high level of the risk-free rate in Brazil, it is preferred not to
consider the market return model and the CAPM, since they assume a risk-free asset to
compute a return premium. The market model is used.
The mentioned model is built upon the assumption of a constant and a linear relation
between asset returns and the returns of a market index, such that:
𝑅𝑖,𝑇 = 𝛼𝑖 + 𝛽𝑖𝑅𝑀,𝑇+ 𝜀𝑖,𝑇 (3)
with
𝐸[𝜀𝑖,𝑇] = 0 (4)
and
𝑉𝐴𝑅[𝜀𝑖,𝑇]= 𝜎𝜀,𝑖2 (5)
This model mainly differs from the market return model because the latter calculates
abnormal returns by subtracting the returns of a market index and thus can be
considered a restricted market model with alpha equal to zero and beta equal to one for
each stock.
Furthermore, the market model parameters in the estimation window are estimated by
The main test statistic in this paper is the t-test statistic. The t-test statistic for the null
hypothesis is that the cumulative average abnormal return (CAAR) is equal to zero. The
t-test for the time series is defined as follows:
𝑇𝑡𝑖𝑚𝑒 = 𝐶𝐴𝐴𝑅𝑡
(𝑇2− 𝑇1+ 1)
1 2𝛼𝐴𝐴𝑅
𝑡
(6)
The statistics follows asymptotically normal distribution. The returns of the estimation
window (that goes from 320 to 120 prior the event) are the basis for the variance
estimator of the t-statistic, where M is the number of non-missing returns and d the
degrees of freedom (e.g. market model d = 2), such that:
σ̂AAR2 t =
1
M−d ∑ [AARt−
1
M ∑ (AARt)
Estmax
Estmin ]
2
(7)
Estmax
t=Estmin
The post-event window abnormal returns are out-of-sample predictions and thus the
standard error should be adjusted by the forecast error. The adjustment for the market
model is such that:
√1 + M 1 (Rm,t− R̅m,Est)
2
∑EstEstmaxmin(Rm,t− R̅m,Est)2
5. Data and Sample
To study the independent variables’ hypothesis the research uses financial information
of public Brazilian companies available on Wharton Database.
Regarding credit ratings, historical Standard & Poor’s long term local currency ratings
are used, which are available on Bloomberg. Stock prices of Brazilian listed companies,
as well as Ibovespa index, are from Bloomberg.
The first part of the research does not include financial companies for their differences
in accounting standards and interpretation of various ratios. The period in consideration
goes from 2007 to 2015. Due to the relatively young age of the fixed income market, in
Brazil most of the companies were not rated before 2006-2007. Companies with no
credit ratings or credit ratings issued by other agencies are not considered. Starting from
a sample of 118 non-financial companies, to make observations reliable, the sample is
reduced to 35 Brazilian companies for a total 280 number of observations. In the cases
where more than one rating is assigned for a certain company during a year, only the
last rating issued during the year is considered.
For the study on the sovereign downgrades effects on the stock market, the period
took in consideration is between 2014 and 2016. Events are the recent Brazilian
downgrades days of the major rating agencies, Standard & Poor, Moody’s and Fitch.
The number of listed companies that are taken in consideration is 58, according to data
available. Daily returns of listed Brazilian companies are constructed from Bloomberg
6. Results
6.1 Regressions Results
As already mentioned, to find out the determinants of credit rating in Brazil, panel data
regression is used. Credit ratings (RatingN) and (RatingN1) have been the dependent
variables for the regression and seven independent variables have been implemented
(Leverage, Profitability, Size, Coverage, Growth, Liquidity, Longtermratio).
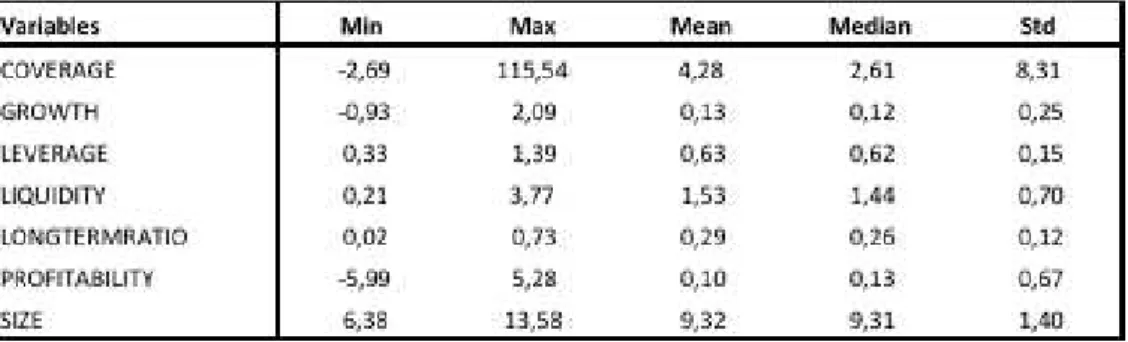
Table 4 shows descriptive analysis (minimum, maximum, mean, median and standard
deviation) of the independent variables.
Table 4: Descriptive analysis of the independent variables.
I find out the frequency distributions for my two dependent variables. Table 5 and Table
6 show the results.
Table 6: Frequency distribution for rating conversion split in 22 classes.
Table 7 shows the results of the correlation matrix, helpful to check for multicorrelation
between the independent variables. Correlation between the variable are relatively low.
Highest correlation registered is the 54,2% between Leverage and Longtermratio. I can
then assume absence of multicorrelation and that results are not going to be biased by
that.
Table 7: Correlation matrix for the independent variables.
V a ria b les COVERAGE GROWTH LEVERAGE LIQUIDITY LONGTERMRATIO PROFITABILITY SIZE
COVERAGE 1 0,052 -0,212 -0,076 -0,277 0,099 0,132
GROWTH 1 0,06 -0,095 0,03 0,072 0,057
LEVERAGE 1 -0,288 0,542 -0,045 -0,288
LIQUIDITY 1 0,197 -0,033 0,24
LONGTERMRATIO 1 -0,011 0,001
PROFITABILITY 1 0,001
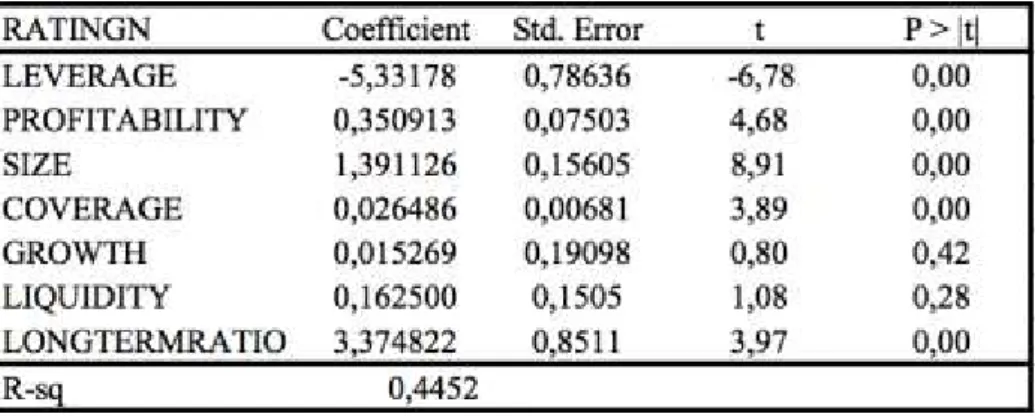
Table 8 shows the results of the panel data regression for the first dependent variable,
RatingN.
Table 8: Panel data regression results for RatingN.
Leverage, Profitability, Size, Coverage and Longtermratio are statistically significant
variables, at 5% level of significance, to explain the dependent variable RatingN, which
is generated from the first conversion table (7 groups). Growth and Liquidity are not
statistically significant and they are not considered in the conclusions. In term of
significance of the variables, same results appear for the second panel data regression,
which results are shown in table 9, that has as dependent variable RatingN1, constructed
from the second conversion table (22 groups). Growth and Liquidity are again not
Table 9: Panel data regression for RatingN1.
It is immediate to observe that the effects of variables on the dependent variables are the
same. For RatingN1, Leverage is equally the only variable that delivers a negative
coefficient.
For both the first and the second regression, Hypothesis 1, Hypothesis 2, Hypothesis 3
and Hypothesis 5 are not going to be rejected as Profitability, Size and Coverage are
positively related to credit ratings as expected. Leverage, therefore, in negatively related
to my dependent variables. Only Hypothesis 6 should be rejected, in fact Longtermratio
variable looks to determine in a positive way corporate credit ratings that goes against
the negative hypothesized effect. This result could be related to different currencies
used when issuing debt obligations and to a possible positive “rating bias” whenever
Dollar denominated debt was issued, especially during the period when the Brazilian
Real strongly appreciated against the US dollar.
Using different credit ratings conversions do not lead to different a result, which helps
6.2 Event Study Results
For the second purpose of the study, the next tables show event study results for the 11
events on which the research focuses. The estimation window goes from 320 days prior
the event to 120 days before it. These windows follow previous results with
closer-to-the-event windows that showed important movements of returns anticipating the events.
It was then of the work interest to increase the size of the estimation windows.
It is also important to have results with different event windows, with 0 set as the
event date, there are larger ones that go from -60 days to +30, from -60 to 0, from -30 to
0, from 0 to +30, days before and after the events. Some shorter ones have been
implemented as well (from -10 to +10, from -5 to +5, from -2 to +2 and from -1 to +1,
days before and after the events). From cumulative abnormal returns results and graphs’
analysis it is possible to analyze if anticipations of the market happened.
After the individual study of each event the research continues grouping the events in
three different ways. The first grouping separates all the events from the “junk”
downgrades, the ones that brought the sovereign debt into junk territory. This approach
continues in the second grouping, separating “normal” sovereign downgrades, “junk”
downgrades and the negative changes in outlook. The last one strives to analyze each
rating company individually, to attest how the market reacted to separately S&P,
Table 10: 24/03/2014 S&P downgrades Brazil of two notches
The results show strong evidence against the null hypothesis for all but two windows.
Surprisingly the only window that delivers negative CAAR is the (-60; 0) window. The
longest post-event window (0; 30) shows significant positive CAAR, as well as the
shortest windows around the event. It seems that the market anticipated the downgrade.
The event itself was not informative as the market already “priced” the sovereign
downgrade in the previous weeks. Nevertheless, the negative CAAR suggests that the
news and the possibility of a downgrade negatively affected the market. By analyzing
the figure, it is easier to assess the anticipation of the market, with the CAAR
decreasing substantially approximately 40 days before the event.
Table 11: 09/09/2014 Moody’s changes the outlook to negative
Moody’s change of the outlook to negative seems to be less market anticipated than the
significant CAARs. That suggests that Moody’s did not release as many information
about its move as S&P previously did.
Table 12: 09/04/2015 Fitch changes the outlook to negative
Fitch was the last rating agency to react to Brazil poor macroeconomic results and
recession. Its change in the outlook to negative did not affect the market. Results show
statistically significant positive CAARs both before and after the event (-60; 0) (0; 30)
deliver positive results, suggesting a positive trend that did not suffer changes after the
announce.
Table 13: 28/07/2015 S&P changes outlook to negative
S&P change in the outlook was anticipated as the previous agency downgrade. The
(-30; 0) window shows important significant negative CAAR, that leads to assume that
date, CAAR shows high negative values. It can be assumed that the Brazilian
environment was influenced by this change but it was also preparing for the future
downgrades.
Table 14: 11/08/2015 Moody’s downgrades one notch
Evidences from graph’s analysis and the (-30; 0) window, shows that Moody’s
downgrade to Baa2 was slightly anticipated by the market. All the CAAR results show
strong significant results and it is possible to observe a severe increase in the CAARs
negative values in the windows around the downgrade. These results show an important
negative reaction of the market following the event, even if a part of the shock was
already absorbed in the previous to the event days.
Table 15: 08/09/2015 S&P downgrades to junk
As observed before, S&P downgrades tend to be largely anticipated by the Brazilian
equal to 0,0261. From the graph, it is possible to assume that the equity market
anticipated the move approximately 20 days before the event as the CAAR drastically
dropped. The (-30; 0) window shows negative significant results equal to -0,1339.
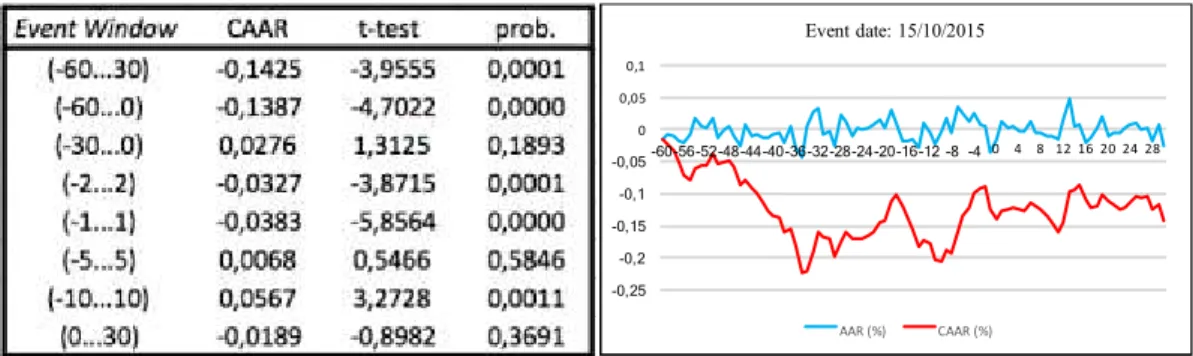
Table 16: 15/10/2015 Fitch downgrades one notch
Fitch downgrade to the last level of investment grade came after S&P downgrade to
junk. The trend was negative around the period and it is difficult to assess if the
downgrade was anticipated or not. The short-term windows (-2; 2) and (-1; 1) both
deliver significant negative values, implying that the event negatively influenced the
market in the short term.
Table 17: 09/12/2015 Moody’s changes outlook to negative
Moody’s change in the outlook gives a significant negative value for the (-2; 2) window
of -0.0350. That imply a short-term market movement following the announcement,
Table 18: 16/12/2015 Fitch downgrades to junk
Fitch downgrade on the 16th of December 2016 brought the whole Brazil debt into junk
territory. Event study results are helpful to suggest that the market did not react in the
period before the event. Both the shortest-term windows lack of statistical significance,
while the (-10;10) and (0;30) windows deliver significant negative results. It is possible
to assume that the market itself took some days to adjust and react to Fitch downgrade
to junk. From a graph analysis, the CAAR looks to suffer an important drop
approximately eight days after the event. Results show a late response to the event: the
result could be also red as an anticipation of the following downgrades.
Table 19: 17/02/2016 Moody’s downgrades to junk
Moody’s was the last agency to downgrade the Brazilian sovereign debt to junk. Results
show a clear anticipation of the downgrade, as it is also possible to observe in the
the (-2; 2) (-1; 1) (-10; 10) and (0; 30) windows all deliver positive significant results.
These outputs help to confirm market anticipation and show an important recovery in
the period that followed the event. Probably, as Brazil as the whole country was already
in the junk territory, a downgrade from the third main credit agency did not worry the
market for long.
Table 20: 24/02/2016 S&P downgrades one notch
S&P downgrades Brazil into deeper junk territory on the 24/02/2016. This downgrade
came shortly after Moody’s one. CAAR analysis ends to be similar to the previously
mentioned downgraded. The work assumes that the market anticipated both the
movements, as they came one week after each other. (-30; 0) window delivers positive
significant value, implying that the anticipation was offset by a strong market recovery.
Aggregate Samples 1; Downgrades to junk– All other events
Table 21: Aggregated downgrades to junk
When grouping the three downgrades that brought Brazilian sovereign debt into junk
territory, it is possible to observe strong and significant CAAR results for the (-30; 0)
and (-60; 0) windows. That shows some clear market anticipation of the relevant
downgrades. The closer to the event windows are not significant, while the (-5; 5) and
(-10; 10) windows deliver negative significant results. It is possible to assume that the
studied stocks were still negatively affected by the event downgrades, even after some
strong anticipation.
Table 22: Aggregated other events
All the other events together deliver some interesting and contrasting results. The
(-60; 0) window’s CAAR are significantly negative, showing again some anticipations.
positive and significant CAAR results. This unexpectedly shows how around these
events Brazilian stocks were not overall negatively influenced and how they probably
already priced the negative rating actions.
Aggregate Samples 2; Downgrades –Downgrades to Junk –Changes in outlooks
Table 23: Aggregated normal downgrades
For the second grouping I firstly observe results for all the negative downgrades from
the three main rating agencies. The (-60; 0) window delivers once again negative and
significant results that could imply some market anticipation. (-5; 5) (-10; 10) and
(-30; 30) windows show, similar as in table 22, positive and significant CAAR results
that is again surprising. These events were probably already priced into stocks prices
and the events themselves were not significant for the overall market.
Changes in outlook, when analyzed together, can help to draw interesting conclusions.
The close to the events windows (5; 5), (-2; 2) and (-1; 1) all deliver statistically
significant and strong evidences that stocks returns were negatively affected by these
events. The windows that study prior to the event CAAR do not have statistically
significant results. Compared to the previously discussed groupings, in this case there
are fewer instances of market anticipations and the negative CAARs show clearly how
Brazilian stocks were directly affected by the events themselves. The last window
(0; 30) strengthen this finding, CAAR is large and significantly negative.
Aggregate Samples 3; S&P - Moody’s - Fitch
Table 25: Aggregated S&P ratings changes
S&P events studies show strongly significant CAARs but contrasting results. From the
above values, it is easy to deduce that all the S&P negative sovereign downgrades were
strongly anticipated. CAARs of the prior to the event windows are negative and large
while for the closer to the event windows results are strongly statistically significant and
Table 26: Aggregated Moody’s ratings changes
Moody’s event studies deliver some different results; in fact, market anticipation is less
clear and significant. The (-30; 30) shows not significant results while all the closer to
the events windows have significance and show negative values. It is possible to deduce
that Moody’s shares less information about its future rating movements and stocks’
returns are more directly affected from the negative changes in ratings rather than from
previous-to the events news.
Table 27: Aggregated Fitch ratings changes
Fitch events, when individually studied, are the less significant, and the aggregate
results are difficult to analyze as well; the agency mostly reacted to the other main
agencies ratings actions. An interesting result comes from the shortest window (-1; 1)
that delivers negative significant values. The negative events themselves affected
Brazilian stocks’ returns but not constantly and decisively as the other two credit rating
7. Conclusions
This research first aims to identify the determinants of credit ratings in Brazil. Two
panel data regression are built, with credit ratings as dependent variable and seven other
independent variables: Leverage, Profitability, Size, Coverage, Long-term-ratio,
Growth and Liquidity. The sample contained 280 credit ratings observations, issued by
Standard & Poor’s, from 35 Brazilian public companies for the period from 2007 to
2015. Empirical results show that, for both regressions, five variables are statistically
significant at a 5% level: Leverage, Profitability, Size, Coverage and Long-term-ratio.
Long-term-ratio variable shows a positive relation with the dependent variables, which
goes against the negative hypothesized effect. Debt issued in foreign currencies, mainly
US dollars, could help to explain this finding. Whenever the home currency is relatively
strong compared to the issuing currency, long term obligations could be considered
helpful and convenient for the future of the company.
For the second part of the study, the research strives to understand how the Brazilian
stock market reacted to Sovereign downgrades. Event studies are used to help assess
companies’ abnormal returns values before, around and after the events. The sample
contained 58 companies that are part of the Brazilian Ibovespa index around the events
period. Results suggest market anticipation for all but two events. CAAR results in the
pre-event windows are often negative, significant and large. S&P downgrade to junk on
the 8th of September 2016 is the most informative for the market as CAAR outputs
deliver the highest negative values. The hypothesis of Fitch downgrade to junk to be the
most informative is rejected, as the market was not that responsive previously or shortly
showing a strong negative correlation between the credit rating actions and the Brazilian
stock market.
When aggregating the events in different groups, junks downgrades deliver the
greatest negative CAAR and surprisingly, collectively, negative changes in outlooks
seem more informative than simple negative downgrades. Market anticipation for the
latter group is greater but negative values do not upset the ones of the former group.
S&P movements result to be the most market anticipated ones while Moody’s negative
ratings changes are the ones negatively affecting stock returns the most. Fitch
downgrades do not affect returns as the other agencies actions do.
Overall, the research shows how the sovereign rating directly affects equities as well
as bonds ratings. Financial ratios are crucial to define ratings but the overall country
8. References
Adams, M., Burton, B., & Hardwick, P. (2003). The determinants of credit ratings in
the United Kingdom insurance industry. Journal of Business Finance & Accounting,
30(3/4), 539-572.
Almeida, H., I. Cunha, M. Ferreira, & F. Restrepo (2014): The Real Effects of Credit
Ratings:The Sovereign Ceiling Channel. Working Paper.
Bone, R. B. (2007). Determinantes de ratings corporativos no setor de petróleo: o caso
da Petrobrás. 107-125.
Bone, R. B., & Ribeiro, E. P. (2009). Conteúdo informacional dos ratings corporativos
de empresas brasileiras, 1995-2007. Anais do Encontro Brasileiro de Finanças.
Bouzouita, R., & Young, A. (1998). A probit analysis of best ratings. Journal of
Insurance Issues, 21(1), 23-34.
Brooks, R., Faff, R., Hillier, D. & Hillier, J., (2003), Do stock markets react to the
re-rating of sovereign risk?, Journal of the Securities Institute of Australia, issue 4, pp. 2-8.
Choy, E. Y. W., Gray, S. F., & Ragunathan, V. (2006). Effect of credit rating changes
on Australian stock returns. Accounting and Finance, 46(5), 755-769.
Damasceno, D. L., Artes, R., & Minardi, A. M. C. F. (2008). Determinação de rating de
crédito de empresas brasileiras com a utilização de índices contábeis. Revista de
Administração, 43(4), 344-355.
Ftiti Z. Fatnassi, I. & H. Hasnaoui (2014). Stock market reactions to sovereign credit
rating changes: evidence from four european countries. Journal of Applied Business
Research, 30(3).
Gray, S., Mirkovic, A., & Ragunathan, V. (2006). The determinants of credit ratings:
Australian evidence. Australian Journal of Management, 31(2), 333-354.
Han, S. H., Shin, Y. S., Reinhart, W., & Moore, W. T. (2009). Market segmentation
effects in corporate credit rating changes: the case of emerging markets. Journal of
Kang, Q., & Liu, Q. (2007). Credit rating changes and CEO incentives [Working
Paper]. Social Science Research Network.
Lopes, A., & Walker, M. (2012). Asset revaluations, future firm performance and
firm-level corporate governance arrangements: new evidence from Brazil. The British
Accounting Review, 44(2), 53-67.
Murcia, F. C. d. S., Murcia, F. D., Rover, S., & Borba, J. A. (2014). The determinants of
credit rating: Brazilian evidence. Brazilian Administration Review, 11, 188-209.
Roje, G. (2005). The role of accounting determinants in predicting long term credit
ratings. Proceedings of the European Accounting Association Congress, Gotheborg,
Sweden, 28.
Sales, B. F. (2006). Desenvolvimento de metodologia de rating baseado no modelo
ordered probit (Dissertação de mestrado). Fundação Getúlio Vargas, Rio de Janeiro,
Brasil.
Sheng, H. & Saito, R. (2005). Determinantes de spread das debêntures no mercado
brasileiro. Revista da Administração da Universidade de São Paulo (RAUSP), São
9. Appendix
Determinants of Corporate Ratings Research – 35 Companies
COPEL-CIA PARANAENSE ENERGIA
GERDAU SA
ULTRAPAR PARTICIPACOES SA
DUKE ENERGY INTL GERACAO
BRASKEM SA
ELETROBRAS-CENTR ELETR BRAS
CIA SANEAMENTO BASICO ESTADO
BRF SA
AMPLA ENERGIA E SERVICOS SA
COMPANHIA SIDERURGICA NACION
TELEMAR NORTE LESTE SA
USINAS SIDERURGICAS DE MINAS
FORJAS TAURUS SA
CIA DISTRIBUIDORA DE GAS DO
ELEKTRO ELECTRICIDADE SVC SA
ALL AMERICA LATINA LOGISTICA
ENERGISA MATO GROSSO
CIA ENERGETICA CEARA COELCE
CCR SA
JEREISSATI PARTICIPACOES SA
LOCALIZA RENT A CAR SA
ENERGISA S.A.
CPFL ENERGIA SA
DIAGNOSTICOS DA AMERICA SA
TAM SA
GAFISA SA
CELPA-CENTRAIS ELETRICAS
LUPATECH SA
CEMAR CIA ENERGETICA
TRACTEBEL ENERGIA SA
ULTRAPAR PARTICIPACOES SA
KLABIN SA
WHIRLPOOL SA
VALE SA
Sovereign Downgrades Research - Companies
Vale SA Preference Shares
Petroleo Brasileiro SA Petrobras Preference Shares
Itau Unibanco Holding SA Preference Shares
Banco Bradesco SA Preference Shares
Banco do Brasil SA
Itausa - Investimentos Itau SA Preference Shares
Companhia Siderurgica Nacional
Petroleo Brasileiro SA Petrobras
BM&F Bovespa SA
Usiminas Pfd-A N1
Vale SA
Gerdau SA Preference Shares
Cielo SA
Ambev SA
Companhia Energetica Minas Gerais Preference Shares
CCR SA
Gafisa SA
PDG Realty SA Empreend e Participacoes
BR Malls Participacoes SA
TIM Participacoes SA
Hypermarcas SA
Oi SA Preference Shares
BRF SA
MRV Engenharia e Participacoes SA
JBS SA
Cyrela Brazil Realty SA Emprdts e Prtpcs
Banco Santander Brasil SA Unit
Companhia de Saneamento Basico-Sabesp
Natura Cosmeticos SA
Suzano Papel e Celulose SA Preference Shares Class A
Cia Hering
Lojas Renner SA
Telefonica Brasil SA Preference Shares
Braskem SA Preference Shares Series A
Companhia Brasileira de Distribuicao Preference Shares
Cetip SA Mercados Organizados
Klabin SA Preference Shares
Fibria Celulose SA
Lojas Americanas SA Preference Shares
Kroton Educacional SA
Diagnosticos da America SA
Gol Linhas Aereas Inteligentes SA
Embraer SA
Ultrapar Participacoes SA
BR Properties SA
Bradespar SA Preference Shares
Centrais Eletricas Brasileiras SA Preference Shares Series B
Anhanguera Educacional SA
Localiza Rent a Car SA
Cosan SA Industria e Comercio
EDP - Energias do Brasil SA
Eletropaulo Metropolitn Eltrcd Sao Paulo Preference Shares
Centrais Eletricas Brasileiras SA
Duratex SA
Souza Cruz SA
Metalurgica Gerdau S.A. Preference Shares
Rossi Residencial SA
CESP Pfd-B N1
America Latina Logistica SA
Light SA
CPFL Energia S.A.
Marfrig Global Foods SA
Copel Pfd-B N1
Prumo Logistica SA
Brookfield Incorporacoes SA
B2W Companhia Digital
Oi SA
MMX Mineracao e Metalicos SA
Usinas Siderurgicas de Minas Grs SA Usms
Vanguarda Agro SA